Электронное письмо с подтверждением и ссылкой для установки пароля отправлено по адресу Для доступа к покупкам в будущем вам понадобится пароль.
Получите 10 изображений Stock с бесплатной пробной версией
Добавлены новые фильтры
Сортировать по

21 276 результатов по запросу «cluster chart» в категории «все»

Результатов в видео: 3 879
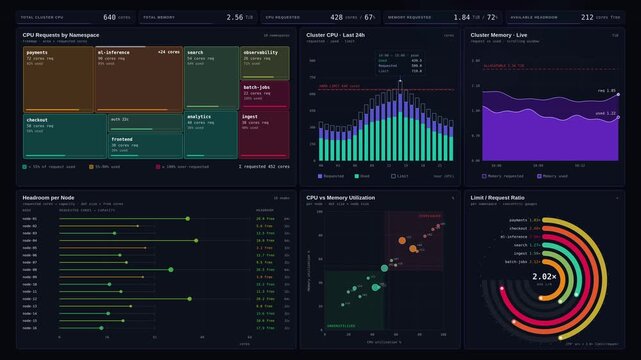
Premium 4K dark mode cluster capacity dashboard animation visualizing CPU memory requests limits and headroom with animated data charts and KPI counters on indigo background.
00:15
HD
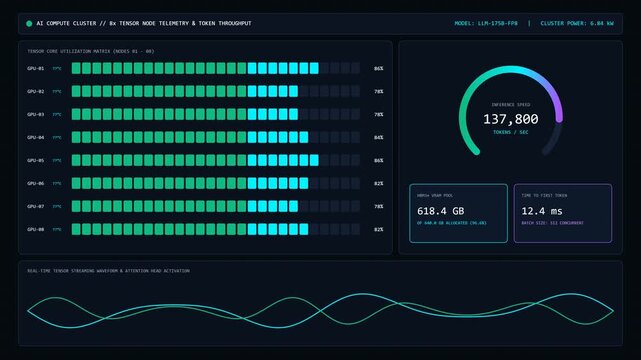
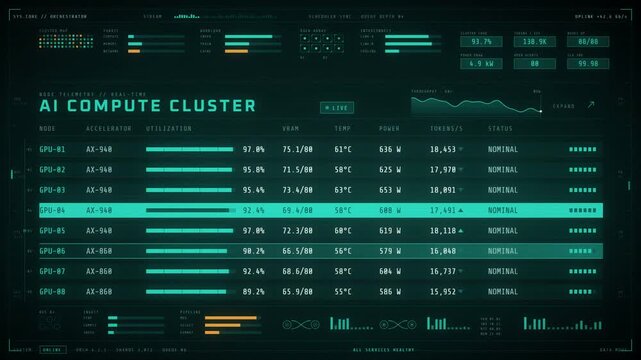
AI compute cluster telemetry dashboard showing gpu utilization metrics and
00:10
HD
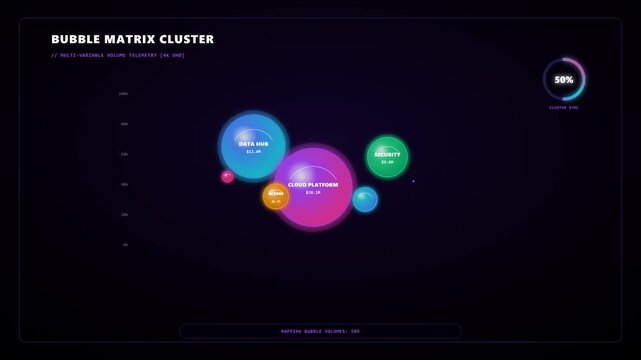
Futuristic Bubble Matrix Cluster HUD Data Visualization Dashboard Showing Cloud Platform Data Hub and Security Metrics with Loading Progress Percentage for Science and High Tech Concepts
00:10
HD
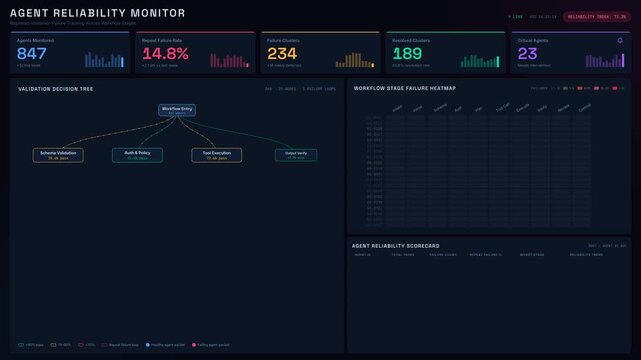
Dark mode agent reliability dashboard with animated decision trees, failure heatmaps, and KPI metrics for workflow monitoring for commercial creative technology and business use.
00:15
HD
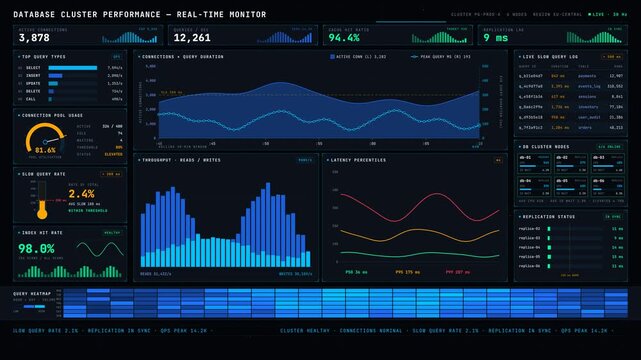
4K real-time database cluster performance dashboard animation with live query metrics, connection counts, and latency charts on a dark neon interface for IT monitoring.
00:15
HD
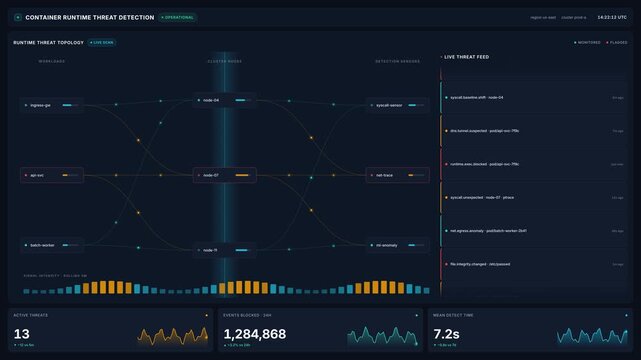
Container runtime threat detection dashboard for kubernetes cluster security topology, live threat feed, blocked events, mean detect time for cloud security monitoring
00:20
HD
High frequency algorithmic trading UI with quantitative execution matrix displaying green candlestick charts and automated auto buy server cluster nodes
00:59
HD
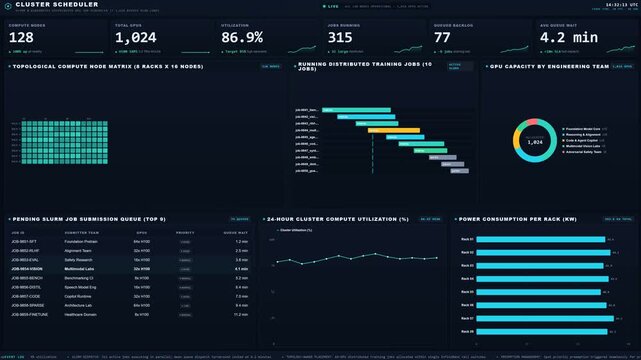
Advanced cluster scheduler dashboard displaying real time metrics and active computing nodes telemetry data
00:15
HD
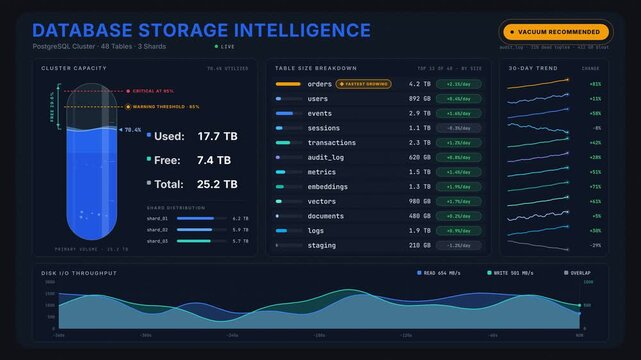
Database storage dashboard animation showing table growth metrics, available disk space cylinder, and real-time I/O activity charts on a dark premium interface.
00:15
HD
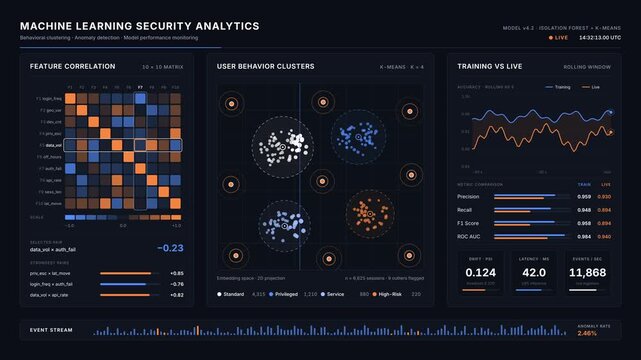
Machine learning security analytics dashboard with user behavior
00:15
HD
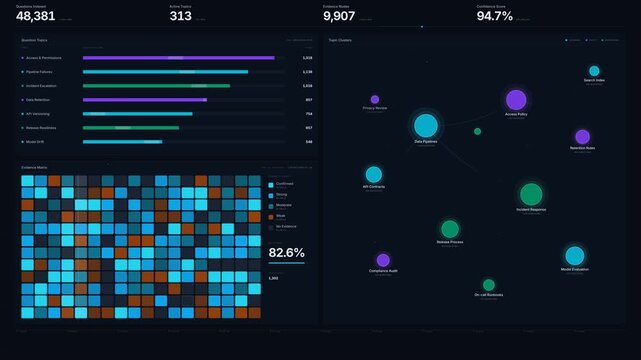
Cinematic dark mode knowledge operations dashboard featuring animated evidence matrices, topic clusters, and live data metrics in 4K for commercial creative technology and business use.
00:15
HD
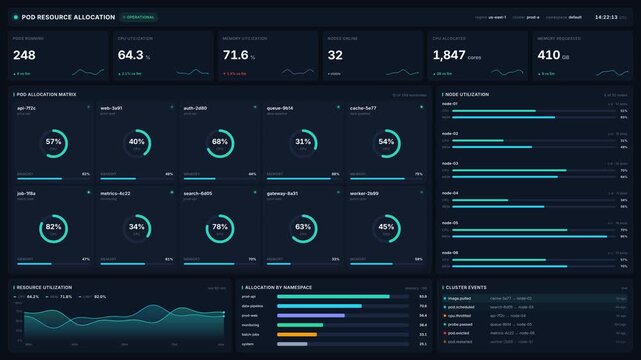
Kubernetes pod resource allocation dashboard for live cpu memory metrics, node utilization, cluster events, for cloud infrastructure monitoring
00:20
HD
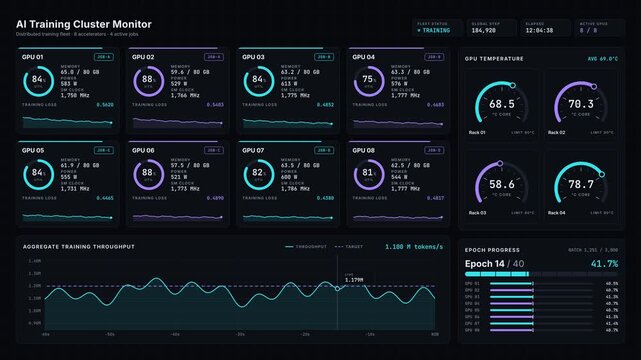
AI training cluster monitor dashboard showing GPU performance metrics
00:15
HD
AI compute cluster dashboard animation with GPU node telemetry and thermal alert status
00:20
HD
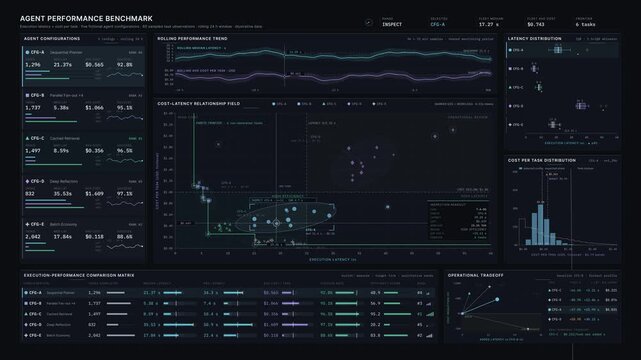
UHD animated agent performance dashboard comparing execution latency and cost per task with statistical charts and efficiency metrics for enterprise AI analytics.
00:15
HD
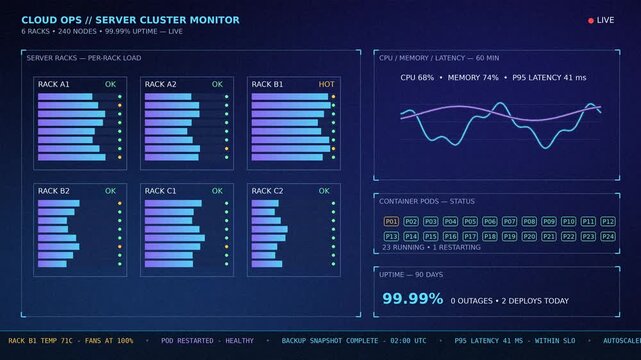
Cloud server cluster monitoring dashboard with server rack load bars, CPU memory latency charts and container pod status, animated data visualization
00:10
HD
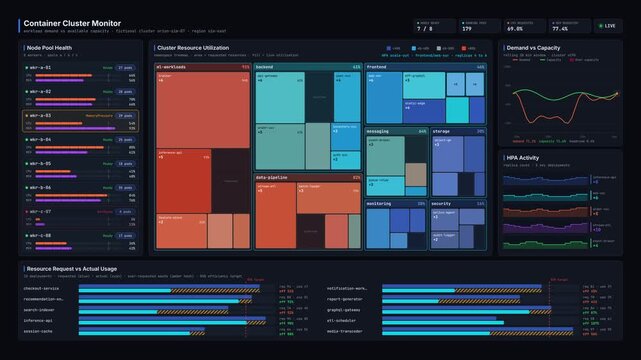
Kubernetes monitoring dashboard animation showing cluster resource utilization treemap, node health, and workload demand charts in dark mode for commercial creative technology and business use.
00:15
HD
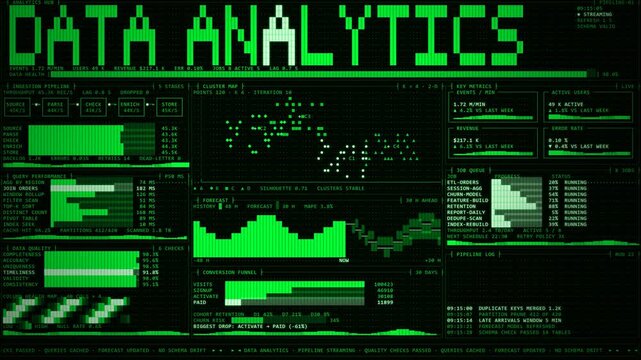
ASCII Data Analytics Business Intelligence Dashboard Green Terminal.
00:20
HD
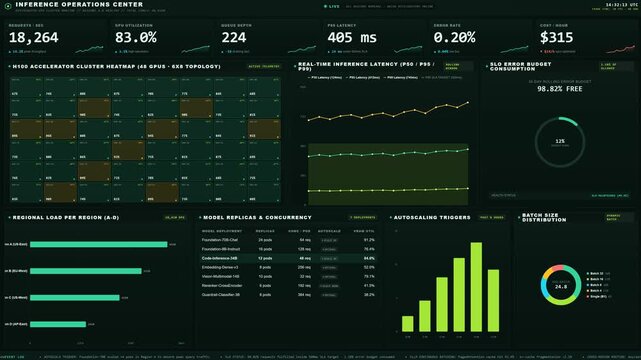
Digital inference operations center dashboard monitoring real time artificial intelligence system performance metrics
00:15
HD
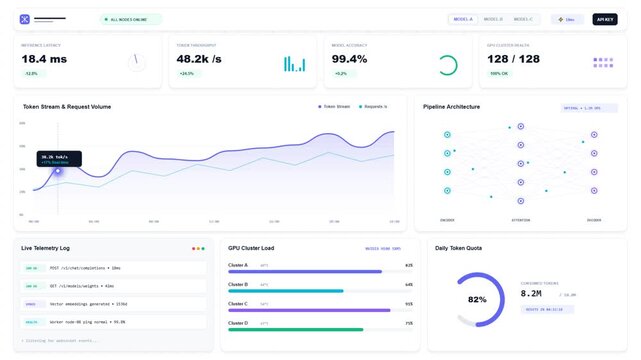
Futuristic clean white Bento Grid dashboard animation for AI SaaS, neural network monitoring, GPU cluster health, and cloud telemetry. Seamless 7-second 60fps loop.
00:07
HD
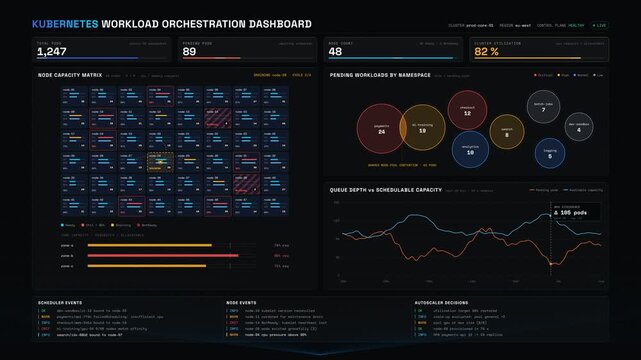
Kubernetes operations dashboard showing pending workloads and node capacity with animated charts, KPI counters, and cluster utilization metrics in a dark 4K interface.
00:15
HD
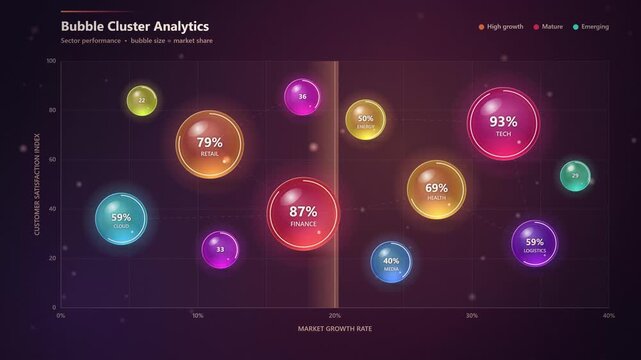
Glowing bubble cluster analytics dashboard displaying market growth
00:10
HD
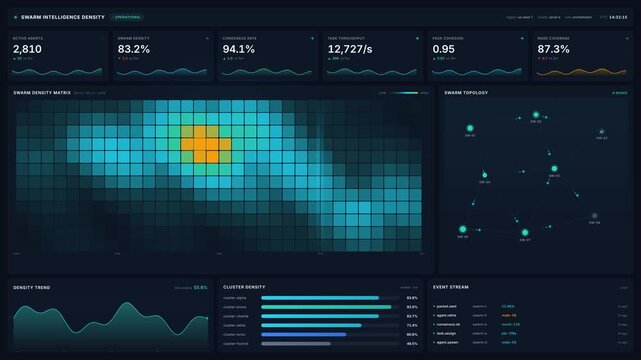
Futuristic swarm intelligence density heatmap dashboard with live analytics, cluster tracking, water meter anomaly radar, for real time data monitoring oversight
00:20
HD
Isometric 3D monochrome bar chart cluster in white slate gray and dark charcoal on a deep black background
00:10
HD
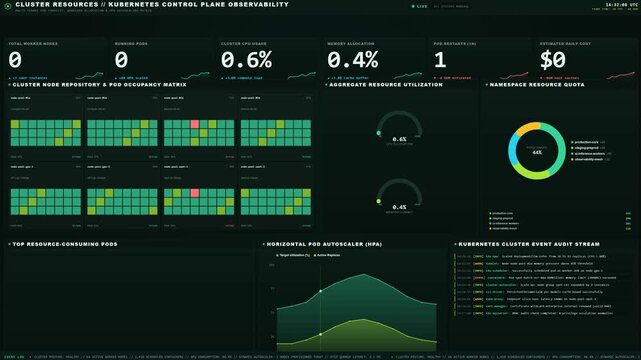
Advanced kubernetes control plane dashboard displaying cluster resources node occupancy and real time metrics
00:15
HD
Abstract clusters of colorful dots on dark background
00:15
HD
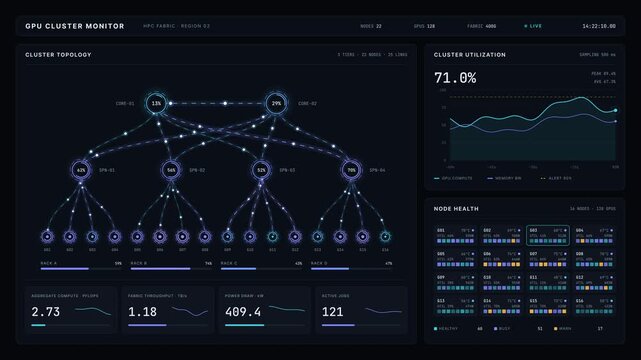
GPU cluster monitor dashboard showing network topology and real time server performance metrics
00:15
HD
Data cluster analysis icon animation on transparent background showing minimal line scatter plot chart and blocks with trim paths in and out. Statistical machine learning and grouping concept idea.
00:10
HD
Patent portfolio link graph dashboard with glowing network nodes core ip connections, for data analytics, innovation tracking, live cluster ranking
00:20
HD
Dynamic Scientific Graphs and Data Visualization in Action.
00:10
HD
Blue stragglers created in a packed star cluster core
00:15
HD
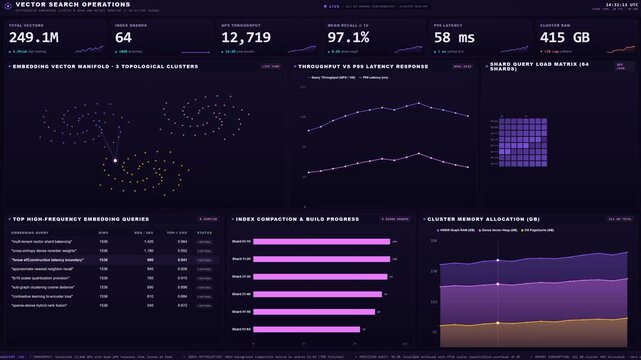
Advanced vector search operations dashboard displaying real-time database queries and cluster memory allocation metrics
00:15
HD
ait Modern Editable Pie Chart Infographic
Digital audience segmentation visualization showing dynamic cluster patterns with glowing data point nodes and circular metrics updating on a dark screen during a computer network analysis process
00:06
HD
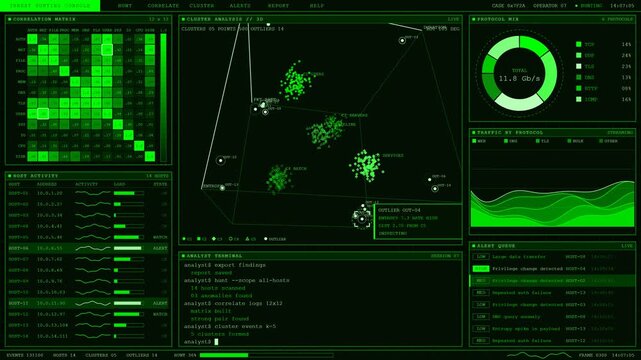
Green Threat Hunting Cluster Correlation Console.
00:15
HD