Электронное письмо с подтверждением и ссылкой для установки пароля отправлено по адресу Для доступа к покупкам в будущем вам понадобится пароль.
Получите 10 изображений Stock с бесплатной пробной версией
Добавлены новые фильтры
Сортировать по

434 425 результатов по запросу «circular graph» в категории «все»

Результатов в видео: 22 516
ait Business Timeline Process Infographic Template with Teamwork Illustration
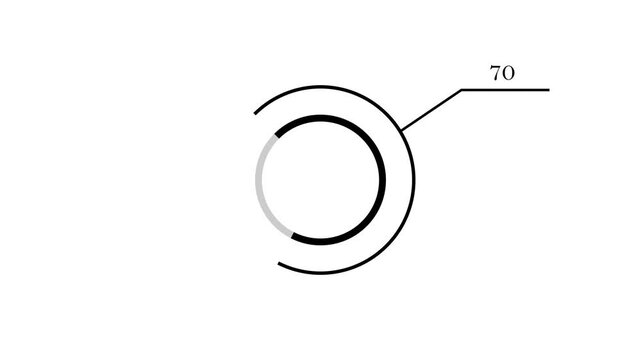
Animated circular progress bar chart showing 70 percent on a white background
00:10
HD
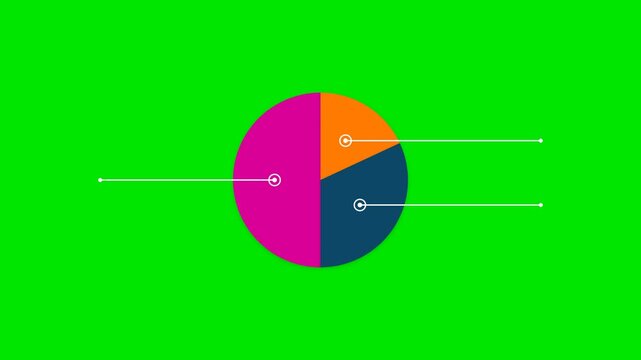
Three segment circular graph expanding with data labels green chroma key background featuring smooth graphical transitions for corporate financial reporting
00:10
HD
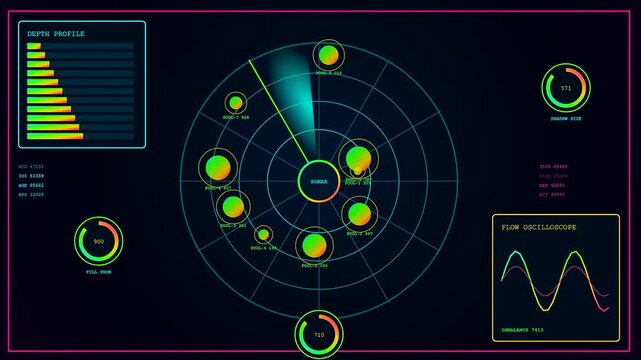
Three panels displaying algorithmic trading interface with rotating sonar circles neon glowing circular graphs and rhythmic wave patterns flickering in dark digital space for data visualization
00:06
HD
ait Business Timeline Process Infographic Template with Diagonal Circles and Teamwork Illustration
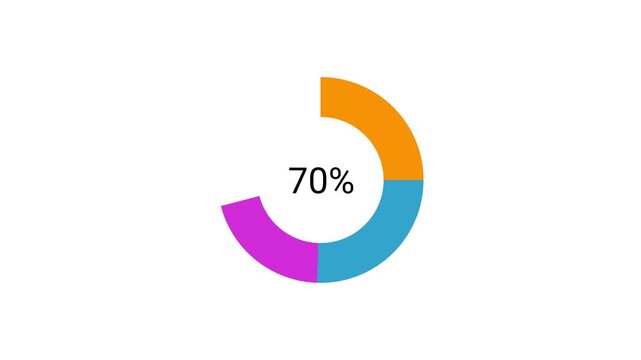
Animated colorful circular progress bar and percentage counter on white background.
00:06
HD
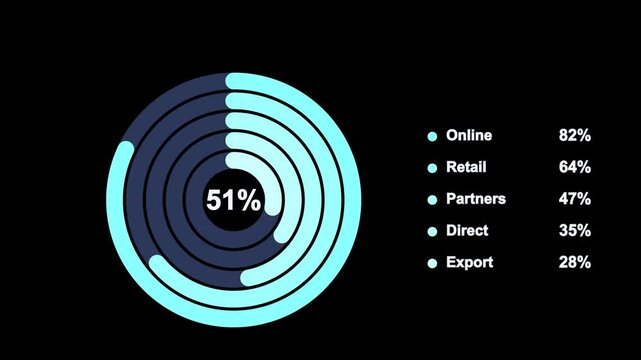
Animated circular progress chart displaying online and retail distribution percentages diagram infographic circle percentage data diagram infographic circle percentage data
00:08
HD
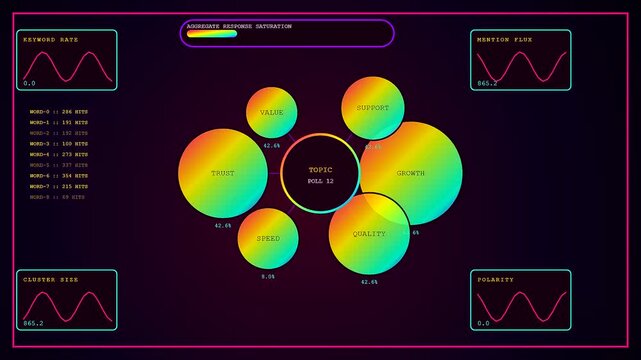
An animated interactive poll interface displays shifting data visualizations with colorful circular nodes and waveform graphs pulsating on a dark purple digital display screen panel array
00:06
HD