Электронное письмо с подтверждением и ссылкой для установки пароля отправлено по адресу Для доступа к покупкам в будущем вам понадобится пароль.
Получите 3 видео или 25 изображений в рамках бесплатной пробной версии
Добавлены новые фильтры
Сортировать по

19 819 результатов по запросу «increase and decrease» в категории «видео»

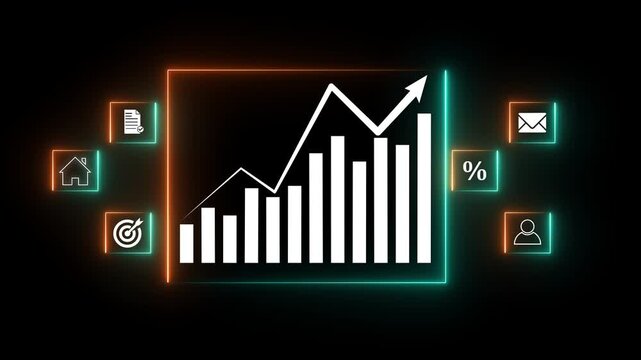
Business growth concept in graph chart showing marketing sales profit increasing and decreasing to future target . growing business concept. Clean Hi-tech style technology chart with a grid Mockup.
00:12
HD
A group of diverse hands joining together symbolize collaboration in climate action, set against a backdrop of digital icons representing emissions and sustainability initiatives. Raster
00:15
HD
Abstract 3D number 1981 text animation floating against a deep black void offering a vibrant and modern visual for the year with a sense of digital energy. 4k motion video.
00:10
HD
FLOW Level Text or Word Low and Medium to High Meter Concept Animation on Black Background and black Screen. a medium level of flow with labels low and on either side against a stark.
00:10
HD
Wheat and barley field poor vegetation with patchy green zones and dry soil strips. Agricultural land showing crop failure and drought conditions. Farming crisis with reduced harvest and weak crop
00:24
HD
Response level indicator scale. Low normal & high meter infographic animation on black background. Showing high response level color gauge indicator for customer service and communication analysis.
00:10
HD
Illustration depicting accumulated revenue with increasing financial assets, managing deferred liabilities, and addressing potential business risks in a dynamic market environment
00:17
HD
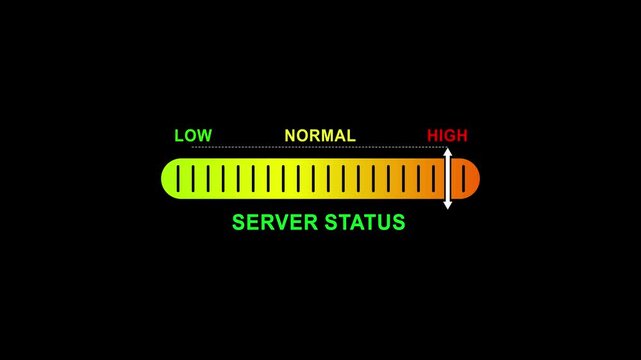
server status level indicator scale. Low normal high meter infographic animation on black background. Showing high pressure level color gauge indicator.4k animation video
00:10
HD
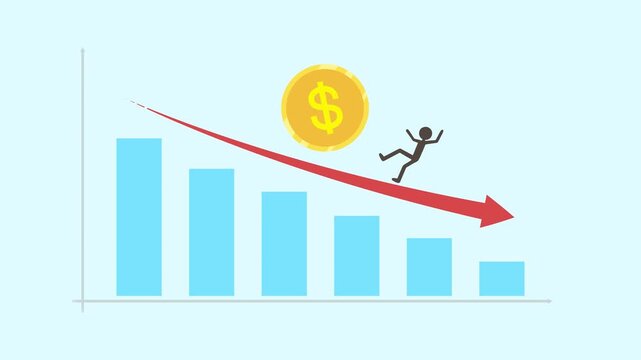
Decreasing value graph, inflation crisis animation, economic recession chart, business and financial loss
00:06
HD
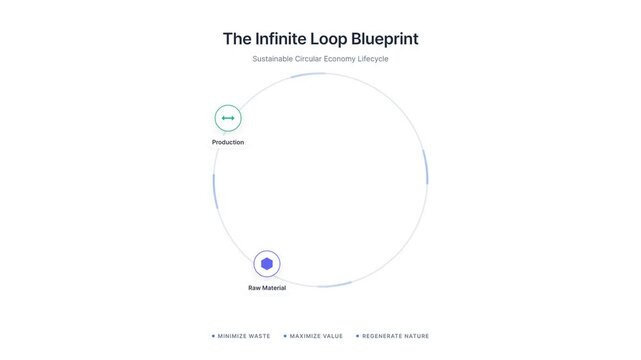
Circular Economy Blueprint Animation
00:15
HD
Cryptocurrency trading. Bitcoin stock graphic. Bitcoin mining and Finance banking management concept, oil and Money trading, Digital trade platform. Profit and loss graph. Online trading
00:10
HD
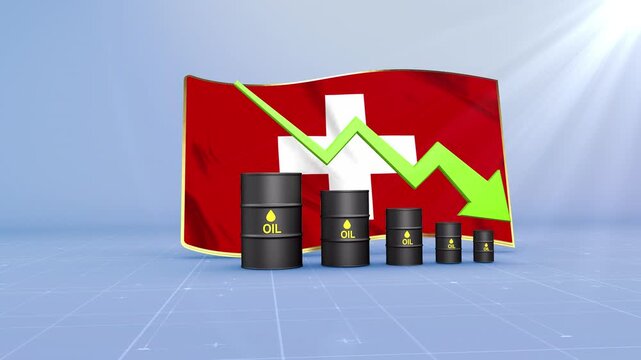
Switzerland Oil Price Falling with Oil Barrels Downward Green Arrow and 3D Financial Data Visualization Graphs for Economy and Business Concept
00:11
HD
Thermometer Temperature Increase and Decrease Animation Clinic and Weather Alpha Channel 4K Resolution
00:06
HD
Animated Line Graph and Area Chart Growing on Green Screen Background.
00:06
HD
Abstract glowing neon swipe arrow. 4k animation. Down to up neon line arrow direction animation. Neon line raising business arrow on black background.on black backgraund .HD video animation.
00:10
HD
Futuristic dollar countdown timer animation, glowing dollar symbol integrated with a circular countdown display, numbers decreasing smoothly from 0 to 50
00:10
HD
Bar chart graphic shows a declining trend with a sharp downward arrow indicating poor financial performance or negative market growth in this simple neon linear design for modern digital.
00:10
HD
Zoom in and out animation the clipboard symbol. Large black symbol in the center and four small symbols around. Seamless looped 4k animation on white background
00:12
HD
Minus and plus buttons press alternately inside a rounded ivory control on a sage background in a seamless eight second loop.
00:08
HD
falling dollar value  in market showing with dollar icon and   down arrow  animation. Cyan Dollar Symbol Inside Circle on Black Background
00:10
HD
Brightness slider level control animation isolated on black background, slider level adjust 0 to 100, simple brightness contrast icon animated.
00:06
HD
Inverse relationship chart animation scales on grids. Corporate inverse relationship chart animation tracks inverse links. Modern inverse relationship chart animation details paths.
00:08
HD
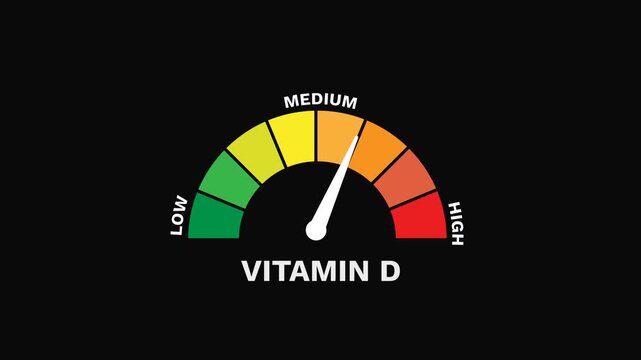
Vitamin D Level Gauge Increasing and Decreasing Indicating Nutritional Health Animation
00:19
HD
A group of professionals collaborates in a meeting to discuss climate change solutions with visual data on CO2 impact and eco-friendly strategies for a sustainable future. Raster
00:20
HD
Israel economic bar chart graph showing decreasing downturn with national Flag 3D animation on black background.
00:16
HD
Red bar chart with downward arrow on white background representing market decline
00:05
HD
Bank account withdrawal process money decreasing from an account, reflecting financial transactions and payments or a failed attempt to withdraw funds
00:17
HD
Rising graph, chart moving up, stock market rally, plus hundred percent, gain, high profit. Bull market, economic moving up, growth, progress, strong business.
00:09
HD
Glowing Neon Percentage Growth and Decline Icon Animation with Up and Down Arrows on Black Background, Financial Business Statistics, 4K Motion Graphics Loop..
00:10
HD
Candles of the stock market, price falls. Falling prices of securities. Loss of assets in equities stock. Decreasing trend showing unsuccessful performance and losses failure due to economic crisis
00:20
HD
Nasal Polyps Narrowing Airway in Sectional Anatomy Visualization for Medical Education
00:08
HD
Australia Crude Oil Price Drop with Oil Barrels Downward Green Arrow and 3D Financial Data Visualization Graphs for Economy and Business Concept
00:11
HD
Dynamic 50 percent discount tag promotion animation 4k graphical element
00:10
HD
Equatorial Guinea Oil Prices Decline with Oil Barrels, Gold Coins and Downward Green Arrow, 3D Economic and Financial Market Concept
00:11
HD
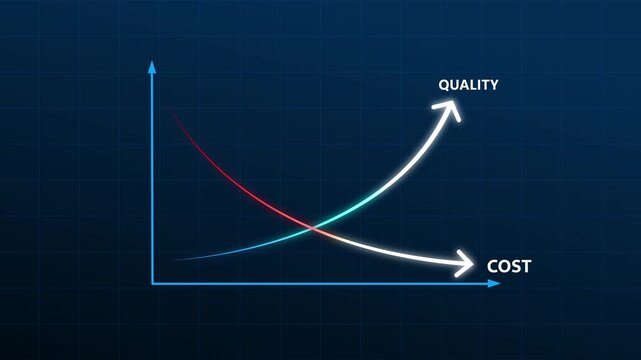
Quality control and company cost reduction. Cost and quality control concept. Successful organization strategy and management.
00:10
HD
Person holds tablet with arrow pointing down labeled 'COST %'. Hands focus on device showing financial concept. Image suits budget, savings, or cost-cutting themes. Ideal for business, finance
00:10
HD
Screen Brightness Increase and Decrease Animation.
00:07
HD
Zoom in and out animation the server symbol. Large black symbol in the center and four small symbols around. Seamless looped 4k animation on white background
00:12
HD
Bright white 3D number 2017 text animation floating against a deep black void offering a vibrant and modern visual for the year with a sense of digital energy.
00:10
HD
Adoption Rate Uptrend Chart Business Analytics Graphic Concept
00:07
HD
Dynamic Floating Sales Promotion Labels Featuring Fifty Percent Discount Banner Graphic
00:10
HD
Performance level indicator scale. Low normal & high meter infographic animation on bblackbackground. Showing high performance level color gauge indicator for business productivity efficiency and work
00:10
HD
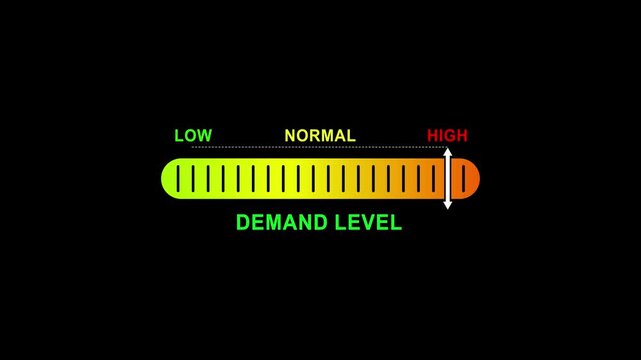
demand level indicator scale. Low normal high meter infographic animation on black background. Showing high pressure level color gauge indicator.4k animation video
00:10
HD
Artificial Intelligence Concept for Business Growth and Cost Reduction with Graphs and Data Visualizations in a Modern Office Environment Sigmoid
00:10
HD
Currency fluctuation icon featuring money with upward and downward arrows. Visual representation of exchange rate movement and financial market changes.
00:10
HD
Cryptocurrency trading. Bitcoin stock graphic. Bitcoin mining and Finance banking management concept, oil and Money trading, Digital trade platform. Profit and loss graph. Online trading
00:18
HD
Person reducing personal debt through strategic financial planning and saving money, working towards future goals like family security and leisure for a better lifestyle
00:17
HD
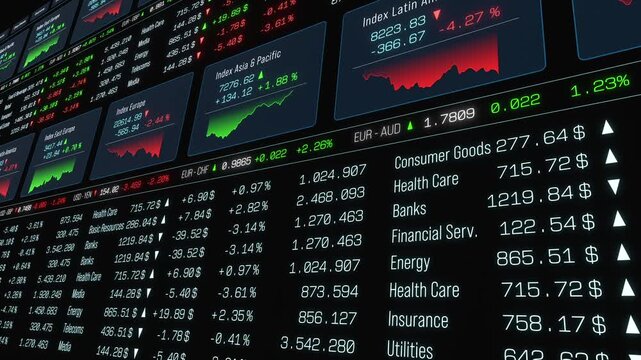
Close-up stock market trading screen with market data, trading volume, prices and percentage changes. Investment strategy, analyzing, data spreadsheet, financial figures, trading board, exchange infor
00:10
HD
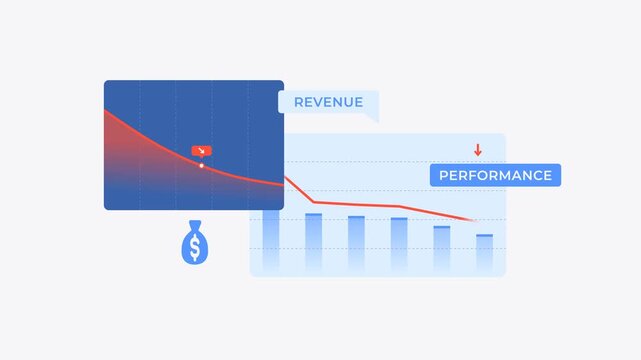
Business revenue and performance chart animation cartoon
00:10
HD
Falling Bar Chart with Downward Arrow, Business Decline and Loss Concept
00:10
HD
Cortisol Level Gauge Increasing and Decreasing Indicating Stress Response Animation
00:19
HD
Botswana Crude Oil Price Drop with Oil Barrels Downward Green Arrow and 3D Financial Data Visualization Graphs for Economy and Business Concept
00:11
HD
Blue neon Up and down arrow icon representing bidirectional movement, data transfer, upload and download, exchange, navigation, switching, workflow, financial transactions, and directional change.
00:10
HD
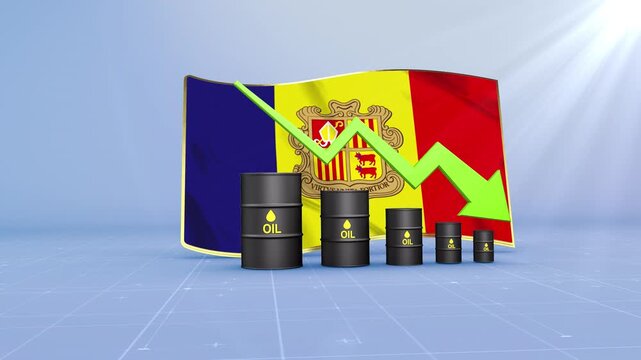
Andorra Crude Oil Price Decline with Oil Barrels and Downward Green Arrow
00:11
HD
Thirty percent discount sign represented by colorful plastic numbers on wet ground during rain
00:17
HD
Animated White Signal Bars on Green Background - A dynamic graphic displays white signal strength bars on a vibrant green background.
00:08
HD
Green background with animated graph showing decline over time
00:10
HD
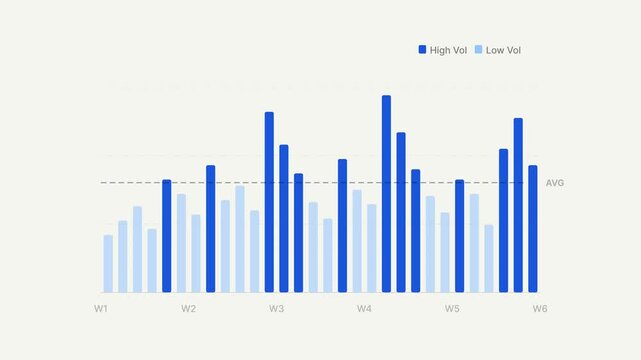
Volume Bar Chart Animation Displaying Business Data Growth
00:10
HD
Bright white 3D number 2030 text animation floating against a deep black void offering a vibrant and modern visual for the year with a sense of digital energy.
00:10
HD
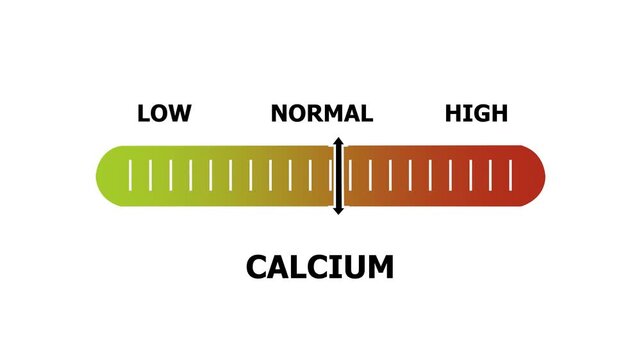
calcium level indicator scale. Low normal & high meter infographic animation. Showing high calcium level color gauge indicator. on a white background 4k animation video
00:10
HD
1,000,000,000,000 → 0 animation, Zeroing One Trillion, one trillion countdown animation on transparent background in 4k with alpha channel
00:31
HD
Probability level indicator scale. Low Normal High meter infographic animation on black background. Animation showing high probability level color gauge indicator for statistical analysis and outcome.
00:10
HD
cyber threat level indicator scale. Low normal high meter infographic animation on black background. Showing high pressure level color gauge indicator.4k animation video
00:10
HD
Person Wearing Virtual Reality Headset Smiling with Digital Graph and AI Elements on Screen in Blue and Pink Background for Technology and Innovation Themes Sigmoid
00:15
HD
Animated Percentage Symbol on transparent Background for Sales and Discounts.
00:12
HD
Cash-To-Cash Cycle Time Word Cloud
00:11
HD
People achieving body transformation by following a balanced diet, incorporating regular exercise, and maintaining healthy eating habits for successful weight management
00:17
HD
Close-up trading board, currency ticker, global markets charts, stock market sector data. Business, investment information, Financial market, sector data, prices, trading volume.
00:10
HD
Futuristic dollar countdown timer animation, glowing dollar symbol integrated with a circular countdown display, numbers decreasing smoothly from 0 to 10,
00:10
HD
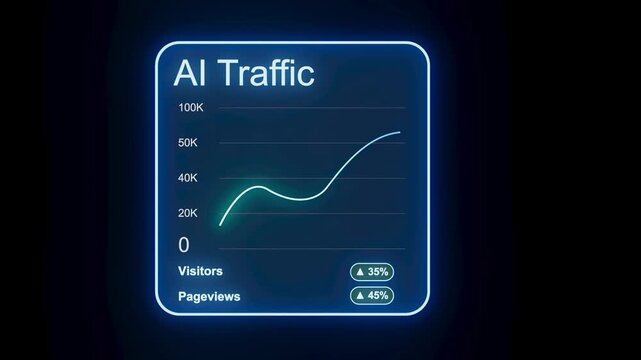
Graph displays AI traffic data with numbers for visitors and pageviews. The design has a blue background with a simple line showing trends.
00:10
HD
Neon percentage icon animation with glowing blue up and down arrows for financial market, interest rate and business analytics.
00:10
HD
Andorra Crude Oil Price Drop with Oil Barrels Downward Green Arrow and 3D Financial Data Visualization Graphs for Economy and Business Concept
00:11
HD
Digital Graph Animation Abstract Motion Data Visualization
00:10
HD
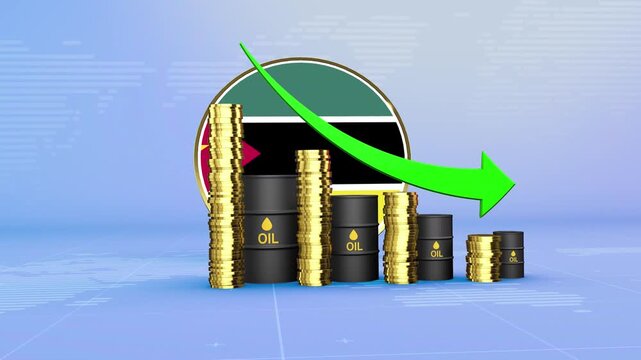
Mozambique Oil Prices Decline with Oil Barrels, Gold Coins and Downward Green Arrow, 3D Economic and Financial Market Concept
00:11
HD
Horizontal 4K motion graphic with vertical Portuguese typography appearing word by word using spacing reduction, zoom motion, circular loop rotation, and black and white backgrounds.
00:12
HD
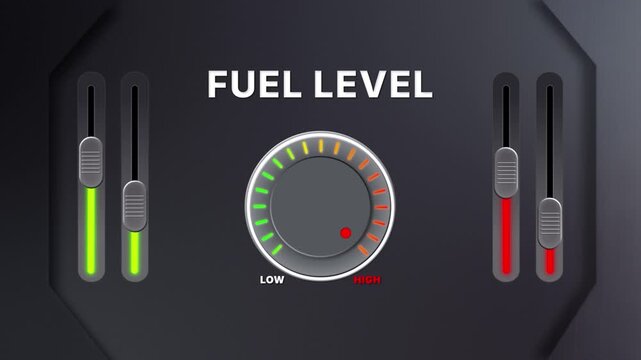
Animation of Fuel level on a circular gauge moving from low to high and back. Can be used to show increase or decrease. Perfect for energy, transport, or industrial content.

00:26
HD
3D Business Statistics Bar Chart with Downward Arrow Showing Financial Decline, Falling Revenue, Market Loss and Negative Growth Data Visualization on Green Screen
00:05
HD
Falling Chart with Arrow Animation, Animated Financial Crisis Chart with Trend Line Graph, Down business graph icon animation on black background.footage of Graph showing fluctuate downward trend.4k
00:10
HD
Bright white 3D number 2031 text animation floating against a deep black void offering a vibrant and modern visual for the year with a sense of digital energy.
00:10
HD
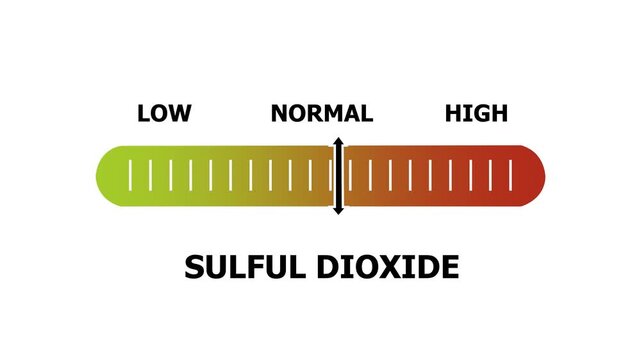
sulful dioxide level indicator scale. Low normal & high meter infographic animation. Showing high sulful dioxide level color gauge indicator. on a white background 4k animation video
00:10
HD
Businessman analyzing profit and quality management concepts long term cost planning, product quality, budgeting, financial forecasting, and company revenue and expense projections.4k video
00:10
HD
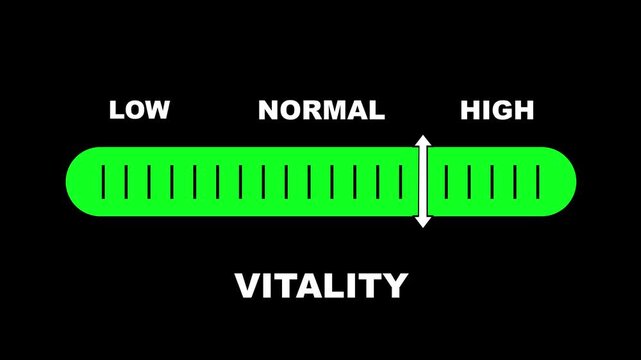
Vitality level indicator scale. Low normal & high meter infographic animation on black background. Showing high vitality level color gauge indicator for energy, health, and wellness monitoring
00:10
HD
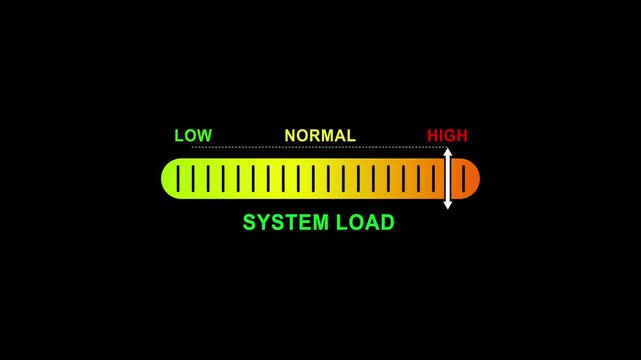
system load level indicator scale. Low normal high meter infographic animation on black background. Showing high pressure level color gauge indicator.4k animation video
00:10
HD
A businessman engages with virtual reality technology to explore innovative strategies for reducing carbon dioxide emissions and promoting environmental sustainability. Raster
00:15
HD
Bar chart graph data animation displays falling financial sales lines. Chart graph monthly performance grid features a downward trend arrow. Data animation layout loops perfectly for video.
00:12
HD
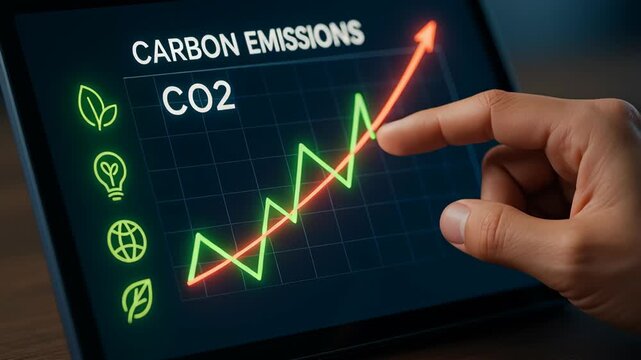
Climate Finance Innovation Analyzing Data on Technology Driving Reduction of Carbon Emissions and Addressing Climate Change Challenges
00:05
HD
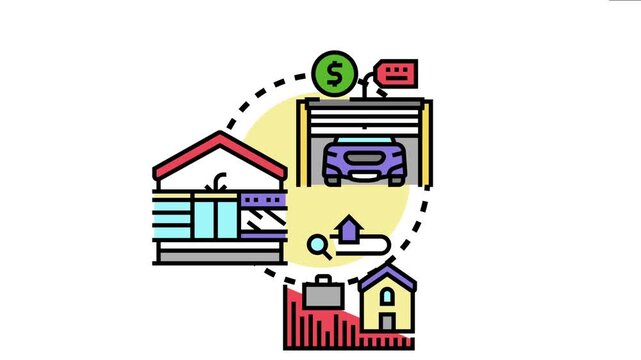
Property condition evaluation involves analyzing building structure. Asset value like a car in a garage with a price tag. And market trends represented by a chart and magnifying glass
00:17
HD
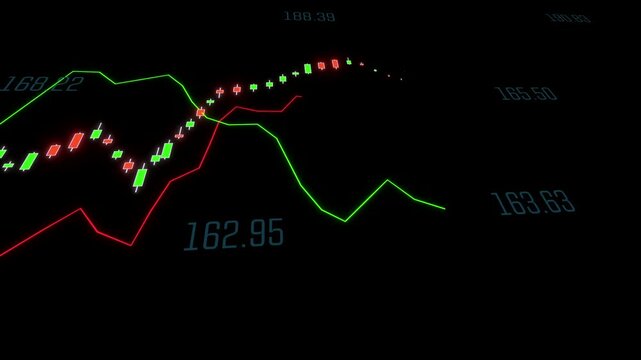
Candle stick chart and two lines graphs, moving average and market data. Banking, moving up and down, finance, equity, investment, making money, strategy, stock market trend, stock trading.
00:14
HD
animation of coins icon with red arrow. financial and economy concept. Isolated on white color background.
00:12
HD
Graph direction arrow animation. Down to up arrow.
00:08
HD
white arrow concept. rendering down to up arrow on black background. arrow for road direction very important. Flashing direction indicators
00:10
HD
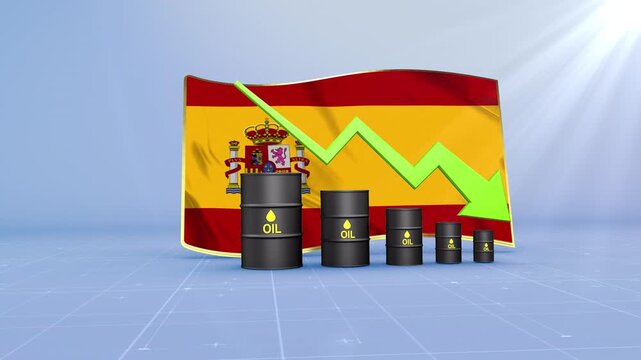
Spain Oil Price Falling with Oil Barrels Downward Green Arrow and 3D Financial Data Visualization Graphs for Economy and Business Concept
00:11
HD
A motion graphic of a financial growth icon with an up arrow and stack of dollar coins within a circle, then a cross mark appears, all on a white background,
00:05
HD
Albania Oil Prices Decline with Oil Barrels, Gold Coins and Downward Green Arrow, 3D Economic and Financial Market Concept
00:11
HD
Testosterone level indicator scale. Low normal high meter infographic animation on white background. Showing high testosterone level color gauge indicator for hormone balance and health monitoring.
00:10
HD
Zoom in and out animation the grapes symbol. Large black symbol in the center and four small symbols around. Seamless looped 4k animation on white background
00:12
HD
A businessman in a suit sits at a desk holding a green up arrow and a red down arrow, symbolizing financial choice, market volatility, and corporate business strategy for growth
00:09
HD
business team discussion reusable product in office,start up eco-friendly business,environmental protection,sustainable business model,ESG strategy,sustainability,team meeting,ESG Report concept
00:11
HD
Bright white 3D number 2050 text animation floating against a deep black void offering a vibrant and modern visual for the year with a sense of digital energy.
00:10
HD
fat level indicator scale. Low normal & high meter infographic animation. Showing high fat level color gauge indicator. on a white background 4k animation video
00:10
HD