Электронное письмо с подтверждением и ссылкой для установки пароля отправлено по адресу Для доступа к покупкам в будущем вам понадобится пароль.
Получите 3 видео или 25 изображений в рамках бесплатной пробной версии
Добавлены новые фильтры
Сортировать по

19 816 результатов по запросу «increase and decrease» в категории «видео»

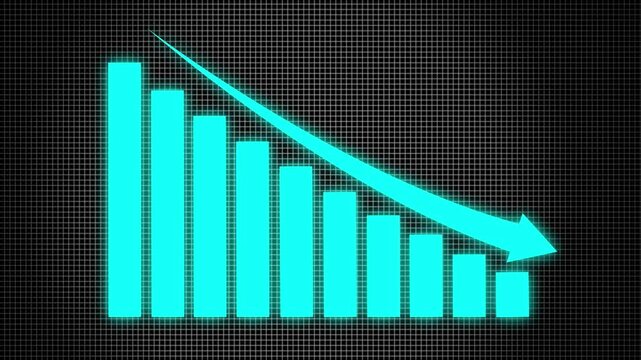
Bar chart for declining business performance by month. the curve shows a downward move .chart graph animation, 4k arrow is making downfall on a grid ...
00:10
HD
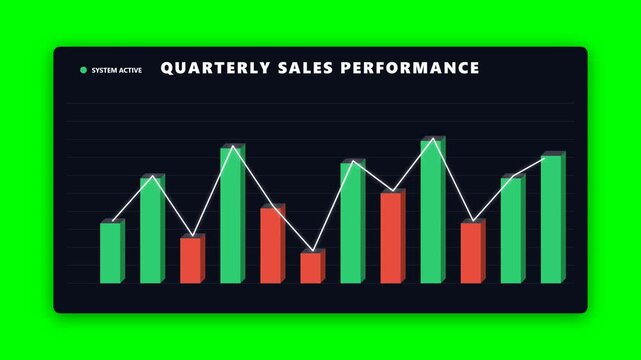
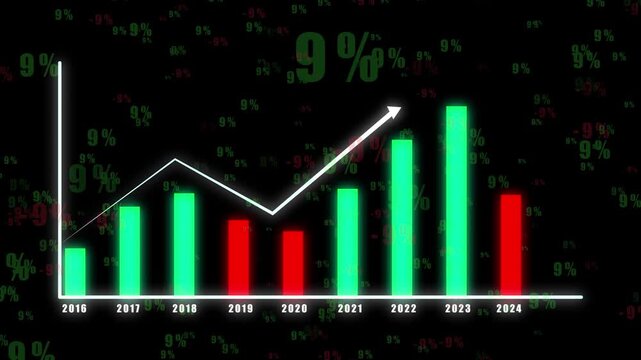
Quarterly sales performance chart with green and red bars on dark background.
00:05
HD
Neon Celsius thermometer displayed temperature 40 degree. Digital Temperature Meter Display 40°C. That's indicates weather temperature 40 degree increase or decline.4k video.
00:10
HD
Managing Your Finances Tracking Debt Reduction and Progress Towards Financial Freedom
00:10
HD
A diverse team engages in active discussions on ESG strategies, emphasizing sustainability and corporate responsibility in a modern office environment. Raster
00:18
HD
Haiti Oil Price Falling with Oil Barrels Downward Green Arrow and 3D Financial Data Visualization Graphs for Economy and Business Concept
00:11
HD
Finance fund stocks price increase and decrease charts arrow up and down, ticker display. table grid Stock exchange screen number with financial trade index rates
00:20
HD
Poland Oil Prices Decline with Oil Barrels, Gold Coins and Downward Green Arrow, 3D Economic and Financial Market Concept
00:11
HD
Energy level indicator scale. Low Normal High meter infographic animation on black background. Animation showing high energy level color gauge indicator for power and performance monitoring.
00:10
HD
Bright white 3D number 2014 text animation floating against a deep black void offering a vibrant and modern visual for the year with a sense of digital energy.
00:10
HD
Animated progress bar representing carbon neutrality goals from 2026 to 2050 with co2 emission reduction for sustainable tomorrow corporate environmental strategy and climate change mitigation
00:10
HD
Area chart visualizes quantitative changes over time using filled regions, making cumulative values, fluctuations, and comparisons easier to understand visually
00:08
HD
Animated of down business graph icon .business or finance concept icon ,Animated illustration of a downward statistical curve with a loss sign business graph...
00:10
HD
Proactive risk prevention strategy involves identifying potential threats. Managing hazards with strategic planning
00:17
HD
Financial Growth Graph Animation Featuring Increasing Business Performance Bars
00:07
HD
Noradrenaline Level Gauge Increasing and Decreasing, Alertness and Stress Response Animation
00:19
HD
Colorful Digital Promotional Banner Featuring a Dynamic Shopping Frenzy Sale Event with Large Discount Offer and Festive Confetti Elements
00:10
HD
Animated white line graph arrow pointing downwards on black background, for financial analysis, and market trend presentation
00:10
HD
Stock market and exchange sector data, trading information, prices up and down.  Currency exchange rates ticker, volatile markets, making money, trading screen, growth, investment, risk, business.
00:10
HD
Discount sign animation with blue neon seventy percent. Discount sign marketing sale banner. Discount sign digital ecommerce graphic on black background for retail.
00:13
HD
Cell-To-Pack Word Cloud
00:11
HD
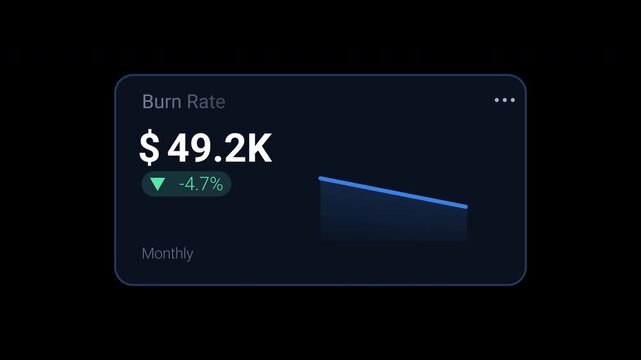
burn rate KPI dashboard card displaying monthly spending, decrease percentage and downward trend graph. Animated motion graphics component for startup finance, cash flow management, budgeting
00:10
HD
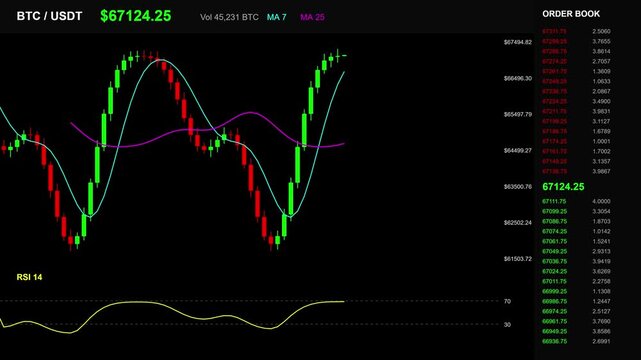
Cryptocurrency trading dashboard with multiple market price charts
00:09
HD
Money increases icon, dollar rate increase arrow up icon .Glowing up arrow black blackground Glowing neon line of dollar sign icon and up arrow isolated on transparent motion animation 4k video...
00:10
HD
Future Sustainability Forecast with Graphs, Yearly Projections, and Net Zero Goals on a Laptop with Diverse Hands Collaborating Sigmoid
00:12
HD
Ukraine Oil Price Falling with Oil Barrels Downward Green Arrow and 3D Financial Data Visualization Graphs for Economy and Business Concept
00:11
HD
Glowing neon red animated line graph illustrating a downward market trend on black background. 4K Video motion graphic animation
00:10
HD
Kyrgyzstan Oil Prices Decline with Oil Barrels, Gold Coins and Downward Green Arrow, 3D Economic and Financial Market Concept
00:11
HD
Animated down graph icon designed in flat icon style. Finance, Business Info graphic animation, Bar down graph Animated down graph icon, business or finance, down graph bar,4k video
00:10
HD
Bright white 3D number 2048  text animation floating against a deep black void offering a vibrant and modern visual for the year with a sense of digital energy.
00:10
HD
Digital Volume Control Slider Animation - System Volume Adjusting
00:10
HD
Vertical adjustment bar animation with orange and yellow gradient level indicator on transparent background
00:08
HD
Zoom in and out animation the pie chart symbol. Large black symbol in the center and four small symbols around. Seamless looped 4k animation on white background
00:12
HD
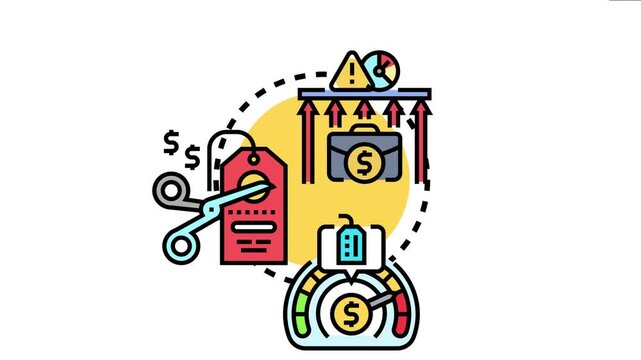
Pricing control concept managing business cost strategy, showing a scale with a dollar sign, scissors cutting a price tag, and arrows indicating rising expenses towards a briefcase
00:17
HD
Revenue and Profit Growth Animation for Corporate Business Reports
00:08
HD
Glowing red downward arrows pulsing on dark background with subtle particles, concept for financial decline, market crash and negative growth
00:10
HD
Exploring percentage symbols in various arrangements and movements
00:08
HD
changes level indicator scale. Low normal & high meter infographic animation. Showing high changes level color gauge indicator. on a white background 4k animation video
00:10
HD
Bar chart animation shows declining percentages on black. Negative economic trading analytics track on bar chart animation. Financial investment downturn marks the chart.
00:07
HD
Glowing white bar chart and downward arrow illustrating business decline, financial loss and economic downturn. Concept of recession, falling profits, market crash and negative growth performance
00:12
HD
Animated White Bar Chart Showing Growth and Data Fluctuations on Green Screen for Business Statistics
00:05
HD
Retro 8-Bit Pixel Art Style Audio Volume Level Bar Animation with Speaker Icon on Dark Background
00:10
HD
glowing neon Global business analyzing concept with trade. Financial figures and charts showing a downward trend, business crash and economic collapse 4k video animation.
00:10
HD
Red bar chart displaying decreasing values on dark green background, abstract motion graphic for data visualization.
00:10
HD
Business professionals in tailored suits analyze financial data, focusing on a digital cost graph that represents market trends and decision-making strategies. Raster
00:15
HD
A bright neon green background with a thin, light blue line graph trending downwards diagonally.
00:08
HD
Eighty Percent Off Super Sale Promotion Graphic Design.
00:15
HD
Finland Oil Prices Decline with Oil Barrels, Gold Coins and Downward Green Arrow, 3D Economic and Financial Market Concept
00:11
HD
Relaxation Behavior Word Cloud
00:11
HD
Dynamic motion of EV charging station progress on a chroma green screen, illustrating battery level increasing.
00:10
HD
Reduction of carbon emissions concept on the transparent background. Net zero greenhouse gas emissions target. Motion graphics for reducing carbon Idea. 4k video animation.
00:06
HD
Two yellow circle icons showing a smartphone with a minus and a plus sign, ideal for adding or removing devices, apps, users and device management
00:10
HD
Belgium Crude Oil Price Drop with Oil Barrels Downward Green Arrow and 3D Financial Data Visualization Graphs for Economy and Business Concept
00:11
HD
Business developing cost effective strategies for project launches, optimizing expenses, attracting investment, and managing financial risks for successful startup growth
00:17
HD
Threat level indicator scale. Low normal & high meter infographic animation on black background. Showing high threat level color gauge indicator for safety and risk monitoring
00:10
HD
decrease icon animation video. dollar rate decrease today.
00:05
HD
Fiery percent symbol glowing in dark space numeric character animation loop.
00:10
HD
Satisfaction rating level indicator scale. Low normal & high meter infographic animation on black background. Showing high satisfaction level color gauge indicator for customer feedback and experience
00:10
HD
Neon Dollar Sign with Downward Arrows in a Circle
00:10
HD
Exclusive digital commerce promotional sale and discount on green screen background
00:10
HD
Customer Retention Strategy and Client Churn Reduction Concept featuring Long Term Loyalty Analytics, Consumer Relationship Icons, Product Value, and Enterprise Growth Motion Graphic
00:12
HD
Business graph chart drop circle with down arrow moving animation on white background. Decreasing business graph and down arrow for business loss falling, bad economy recession concepts
00:10
HD
Neon line Down business graph loss project. 4k Business graph. loss graph direction. damage business graph. down business graph icon. business or finance concept icon animation.
00:10
HD
Pixelated bar graph animation showing downward trend, representing financial decline, recession, or negative growth
00:06
HD
A businessman presents quality and cost metrics using futuristic graphics to showcase trends. The backdrop emphasizes a modern approach to data analysis in business. Qubit
00:14
HD
Animated fire icon with percentage progress bar on dark background.
00:07
HD
Animated star of black dots pulsing on white. Minimalist stipple style star expanding and contracting, motion graphics
00:05
HD
Chad Oil Prices Decline with Oil Barrels, Gold Coins and Downward Green Arrow, 3D Economic and Financial Market Concept
00:11
HD
dollar down icon symbol.Dollar price collapse. Dollar price fall.Money reduction icon, cyan stroke on clean dark white background seamless loop motion design graphic element 4k animation.
00:10
HD
Abstract increase icon on green background. Dollar rate up looped icon. Reduce costs sign and symbol. 4k video animation
00:10
HD
White percentage symbols float and scatter against a dark red background
00:08
HD
Bright white 3D number 2034 text animation floating against a deep black void offering a vibrant and modern visual for the year with a sense of digital energy.
00:10
HD
Czech Republic Oil Price Falling with Oil Barrels Downward Green Arrow and 3D Financial Data Visualization Graphs for Economy and Business Concept
00:11
HD
Financial management concept cost reduction strategies, budgeting, and optimizing financial processes for improved profit and resource allocation
00:17
HD
Portion level indicator scale. Low Normal High meter infographic animation on black background. Showing high portion level color gauge indicator for healthy eating and nutrition monitoring
00:10
HD
Interest rate and dividend. business financial investment, business growth, income, motion graphic of marketing and profit concept.
00:10
HD
Cost cuts business concept motion with red downward arrows and modern typography
00:08
HD
Neon Red and Pink Bar Chart with Percentage Labels on Dark Grid animation Background graph data. Vibrant neon red and pink bar graph animation with percentage indicators on dark grid display.
00:08
HD
winrate level indicator scale. Low normal & high meter infographic animation. Showing high winrate level color gauge indicator. on a white background 4k animation video
00:10
HD
Glowing neon line House under protection icon with up arrow isolated on black background. a glowing light drawing a neon outline of houses decreasing in size. House, home building. 4K
00:10
HD
business graph chart and success arrow indicating profit profit and loss business plan motion graphics.
00:10
HD
Abstract glowing neon swipe arrow. 4k animation. Down to up neon line arrow direction animation. Neon line raising business arrow on black background.on black backgraund .HD video animation.
00:10
HD
Red neon sign financial bar chart falling with downward arrow. Illustrating stock market crash, business loss, economic recession, financial decline, and negative investment trend. 4k motion videos
00:10
HD
Abstract glowing Cost reduction business finance concept on virtual screen. Business, technology concept with blue background.
00:10
HD
This image showcases a sleek AI robot hand interacting with a digital graph illustrating cost analysis trends, set against a modern office backdrop, highlighting innovation in finance. Synapse
00:12
HD
Thermometer Temperature Increase and Decrease Animation Clinic and Weather Alpha Channel 4K Resolution
00:10
HD
Red downward arrow on digital financial graph showing declining market trend and investment data visualization
00:15
HD
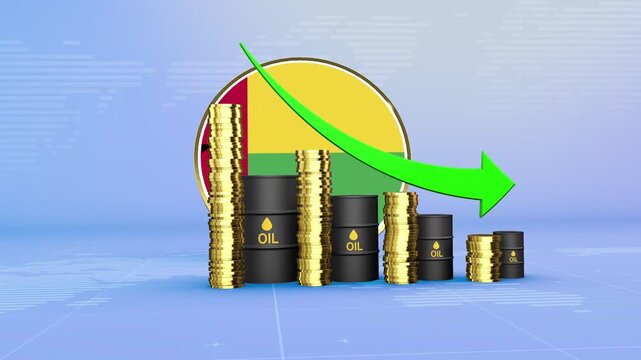
Guinea-Bissau Oil Prices Decline with Oil Barrels, Gold Coins and Downward Green Arrow, 3D Economic and Financial Market Concept
00:11
HD
Vibrant neon glowing arrow animation transition effect dynamic digital motion futuristic u i symbol
00:10
HD
Two curved arrows pointing in opposite directions minimal animation
00:06
HD
Starting helix rotation causing currency values sliding and updating to visualize market shifts
00:10
HD
Speaker volume with sound wave icon animation on transparent background, alpha channel, 4K resolution
00:05
HD
Silhouette of a person overlaid with financial graphs and light trails
00:08
HD
Supporting quiet meditation and wellbeing through stress reduction, positive mental health, mindfulness, and care, represented by a serene mind, a calm heart, and undisturbed time
00:17
HD
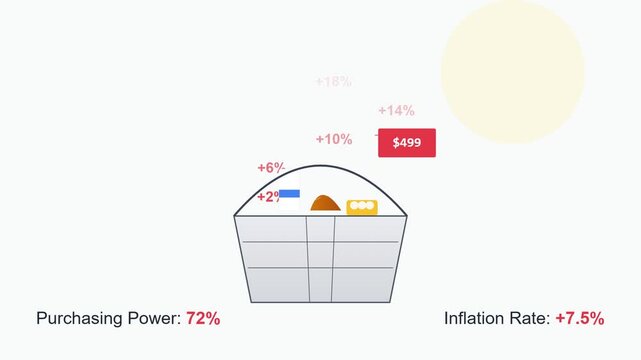
Inflation and Purchasing Power Concept Illustration with Grocery Basket
00:10
HD
Man in suit adjusting productivity slider with finger and holding a phone in his other hand
00:10
HD
Hand Drawn Animated Up and Down Arrow Graph Green Screen Chroma Key
00:10
HD
Business data stock chart animation finance market trend economic crisis 4k seamless loop. Animated stock chart business data graph finance market trend decline recession 4k loop.
00:06
HD
Money loss concepts. Cash down, arrow and dollar stocks graph, market fall. Money, profit, investment, growth business, economy, finance and concept
00:10
HD
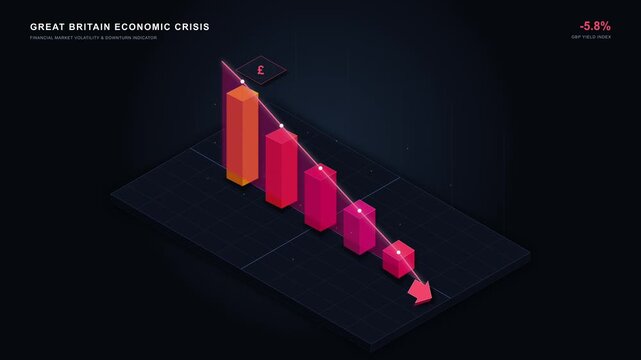
Declining business bar chart with downward arrow representing falling sales, reduced revenue, financial losses, market decline, decreasing performance.financial loss icon.
00:10
HD