Электронное письмо с подтверждением и ссылкой для установки пароля отправлено по адресу Для доступа к покупкам в будущем вам понадобится пароль.
Получите 3 видео или 25 изображений в рамках бесплатной пробной версии
Добавлены новые фильтры
Сортировать по

19 816 результатов по запросу «increase and decrease» в категории «видео»

Montenegro economic bar chart graph showing decreasing downturn with national Flag 3D animation on black background.
00:16
HD
Dynamic animated graph showing rising and falling stock market trends over time, financial data visualization, business growth charted, economic analysis
00:08
HD
3D green Declining Bar Chart with Up Arrow for Representing Falling Sales, in 4K loop animation on White Background
00:09
HD
Superplasticizer Word Cloud
00:11
HD
Lean thinking concept. Cost reduction concept. Business process improvement. Maximising productivity and quality, reducing time and cost. Cost cutting, lean process for surviving the recession.
00:10
HD
Young man finds peace during a beautiful sunset in nature, practicing digital detox for mental well-being. Focus on mindfulness, stress reduction, and personal growth in a serene outdoor landscape.
00:08
HD
Dynamic output level meter gauge animation with glowing blue indicator light moving across color-coded sections from low and normal to performance on a clean isolated black background
00:10
HD
Neon blue color GDP Growth Animation with Rising Arrow Graph   4k video
00:10
HD
Business objects the process of financial planning, cost optimization, and budget analysis for minimizing company expenditures and increasing profit
00:17
HD
Animated Volume Slider Control on Green Screen | 4K UHD
00:05
HD
Response level indicator scale. Low normal & high meter infographic animation on black background. Showing high response level color gauge indicator for customer service and communication analysis.
00:10
HD
Cryptocurrency trading. Bitcoin stock graphic. Bitcoin mining and Finance banking management concept, oil and Money trading, Digital trade platform. Profit and loss graph. Online trading
00:09
HD
Philippine peso currency symbol falling on a decreasing financial graph, recession economic downturn
00:07
HD
Blue down and pink up neon arrows glowing on a black background
00:08
HD
Cost reduction and cost saving through digital transformation, business cost and 2027 optimization, operational cost reduction, financial saving, and resource efficiency 4k video animation.
00:06
HD
Colorful Diagonal Downward Arrow Collection Icon Set Representing Business Decline, Market Loss, Financial Downtrend Data Negative Growth, Sales Decrease and Performance Reduction on black Background
00:13
HD
Samoa Oil Prices Decline with Oil Barrels, Gold Coins and Downward Green Arrow, 3D Economic and Financial Market Concept
00:11
HD
Colorful Bar Graph Animation Representing Financial Data Trends.
00:07
HD
Somalia Oil Price Falling with Oil Barrels Downward Green Arrow and 3D Financial Data Visualization Graphs for Economy and Business Concept
00:11
HD
White fluffy mycelium threads fill a mold around a small object, creating soft packaging that later breaks down into dark soil
00:15
HD
Taiwan economic bar chart graph showing decreasing downturn with national Flag 3D animation on black background.
00:16
HD
Stock Market Chart Animation Showing Buy The Dip Opportunity
00:10
HD
simple green random shape graph rising up down value sliced shape background blue background screen animation stock video footage
00:20
HD
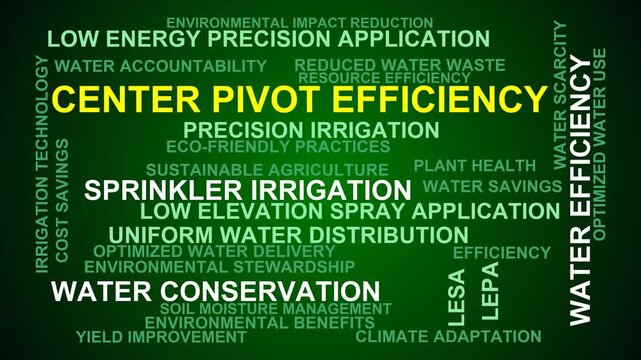
Center Pivot Efficiency Word Cloud
00:11
HD
Animated down graph icon designed in flat icon style. Finance, Business Info graphic animation, Bar down graph Animated down graph icon, business or finance, down graph bar,4k video
00:10
HD
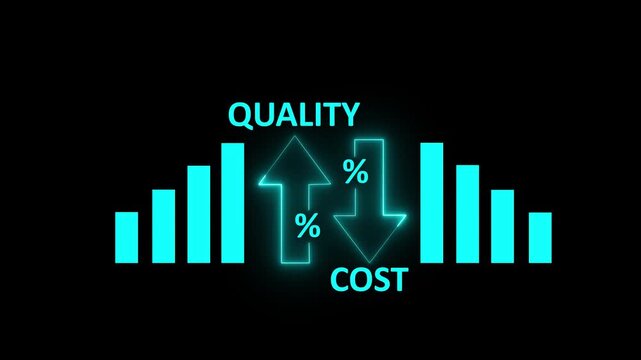
Quality vs Cost Comparison Chart with Business Decision Making and Performance Analysis Concept on Black Background..
00:10
HD
Vivid stacked minus and plus chips press alternately on a dark column with a contacting notch indicator on transparent background.
00:08
HD
This image illustrates the seamless integration of advanced technology and eco-friendly practices, emphasizing the importance of sustainability and innovation for a healthier planet. Xenic
00:10
HD
Dollar Coin with Up and Down Arrows on Green Screen
00:05
HD
Animated green revolution progress bar illustrating carbon dioxide co2 emission reduction targets and climate change mitigation goals from the year 2026 to the future milestone of 2050 sustainability
00:10
HD
Zoom in and out animation the paperclip symbol. Large black symbol in the center and four small symbols around. Seamless looped 4k animation on white background
00:12
HD
Animated Green Up and Down Arrows Direction Icons on Black Background
00:10
HD
Trans fat level indicator scale. Low normal & high meter infographic animation on black background. Showing high trans fat level color gauge indicator for nutrition and heart health monitoring.
00:10
HD
Stock market chart with trend line
00:05
HD
Business chart and line graph over a world map showing global market decline and financial data analysis animation
00:12
HD
Bright white 3D number 2025 text animation floating against a deep black void offering a vibrant and modern visual for the year with a sense of digital energy.
00:10
HD
Dominican Republic Oil Prices Decline with Oil Barrels, Gold Coins and Downward Green Arrow, 3D Economic and Financial Market Concept
00:11
HD
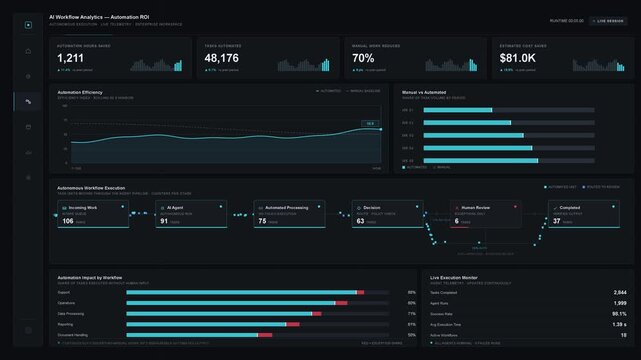
A dark-mode business dashboard illustrating the measurable impact of AI workflows with automation metrics and efficiency charts for business professionals.
00:15
HD
Turkey Oil Price Falling with Oil Barrels Downward Green Arrow and 3D Financial Data Visualization Graphs for Economy and Business Concept
00:11
HD
Line graph showing monthly data spikes. Business line graph for corporate performance analysis. Digital line graph animation for financial reporting.
00:08
HD
Uruguay economic bar chart graph showing decreasing downturn with national Flag 3D animation on black background.
00:16
HD
Gray line graph with jagged mountain peaks and blue circular data point markers. Suitable for financial presentations and analytical reports
00:10
HD
Minimalist bar chart animation showing declining business trends
00:10
HD
Intermodal Door-To-Door Word Cloud
00:11
HD
Abstract decrease icon on black background. Dollar rate down looped icon. Reduce costs sign and symbol. animation. 4k video...
00:08
HD
Illicit trade of Opioids tramadol and oxycodone or oxy is significant public health danger. Supplies contaminated with potent synthetic fentanyl. Counterfeit pills increases risk of fatal overdose.
00:28
HD
Bar chart animation shows a downward falling trend arrow on dark. Financial revenue loss reflects on this bar chart. Negative economic performance marks the chart.
00:12
HD
Growth Chart with Sustainability Goals for Future Generations Illustrating Progress from 2023 to 2050 Featuring Green Energy Initiatives and Net Zero Targets Sigmoid
00:10
HD
Dynamic Promotional Banner Featuring a Fifty Percent Discount Offer for Modern Digital Marketing Campaigns and Online Retail Sales Events
00:10
HD
Strategic financial planning for managing and decreasing expenses, focusing on cost reduction, budget optimization, and efficient business finances with a focus on savings and economic control
00:17
HD
Small red percent symbol button centered on warm gradient
00:05
HD
Adrenaline Level Gauge Increasing and Decreasing Indicating Excitement, Tension, Anxiety, and Emotional Response 2D Motion Graphic
00:19
HD
Business graph chart arrow line down white color animation on black background. growth concept white moving.
00:15
HD
Falling red bar graph showing financial decline on dark digital background, business analytics and data loss visualization
00:06
HD
Abstract dollar sign icon and up arrow animation on a black background. Upward arrow and dollar icon. High pricing icon. profit, investment, growth business, economy, finance and success concept
00:10
HD
Moving digital Business Growth Financial Trading Chart and Stock Market Data Animation looping Seamless Motion Background. Business stock data concept
00:27
HD
Peru Oil Prices Decline with Oil Barrels, Gold Coins and Downward Green Arrow, 3D Economic and Financial Market Concept
00:11
HD
Business graph. loss graph direction. damage business graph. down business graph icon. business or finance concept icon animation.
00:07
HD
Cape Verde Crude Oil Price Drop with Oil Barrels Downward Green Arrow and 3D Financial Data Visualization Graphs for Economy and Business Concept
00:11
HD
Cost reduction business finance concept. Businessman cost reduction icon with down arrow for budget management and cost management.4k video animation.
00:10
HD
Russia economic bar chart graph showing decreasing downturn with national Flag 3D animation on black background.
00:16
HD
Bar chart with red arrow showing rapid economic decline
00:15
HD
Financial Growth Graph Animation Featuring Increasing Business Performance Bars
00:07
HD
Animated histogram with data showing growth over 8 steps percent on black background motion graphic
00:10
HD
Trading screen Asia Pacific, North America index chart up, Europe and Latin America index down, stock market data. Financial market, sector data, prices, trading volume, investment information.
00:10
HD
Eco Friendly Energy Management Concept Animation with Solar House
00:10
HD
Abstract decrease icon on White background. Dollar rate down looped icon. Reduce costs sign and symbol. animation. 4k video...
00:10
HD
Businessman wears virtual reality headset while engaging with cost trend analysis in a modern office, showcasing the intersection of technology and finance. Raster
00:16
HD
Analysis of Real-Time Stock Market Data: Fluctuating Prices and Performance Metrics Displayed on a Digital Trading Platform
00:20
HD
Brand trust evaluation impacting online search ranking and business reputation, demonstrating decrease in internet quality score and website success
00:17
HD
Businessman presenting bar graph on whiteboard business presentation
00:12
HD
Directional neon arrows visualize strategic corporate market trend fluctuations. Dynamic neon arrows guide digital presentation navigation pathways. Motion design utilizing neon arrows.
00:12
HD
Black color arrow rising transparent channel. Abstract arrow growth chart of economy icon black color animated down to up arrow animation, on a white background, direction animation,with video
00:05
HD
Market performance visualization with dashed trend line over white bars, blue and orange theme
00:15
HD
Stock market statistics on screen, economic growth, prices going up and down
00:15
HD
Dynamic 3d Minimalist Volume Slider User Interface Animation
00:10
HD
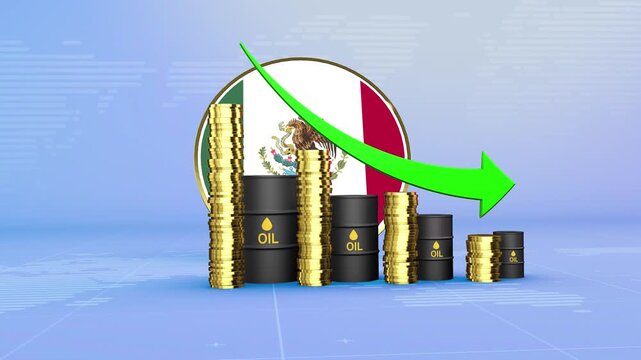
Mexico Oil Prices Decline with Oil Barrels, Gold Coins and Downward Green Arrow, 3D Economic and Financial Market Concept
00:11
HD
Abstract decrease icon on Black background. Dollar rate down looped icon. Reduce costs sign and symbol. Motion graphic 4k animation video.
00:06
HD
Congo Republic Oil Price Falling with Oil Barrels Downward Green Arrow and 3D Financial Data Visualization Graphs for Economy and Business Concept
00:11
HD
cholesterol level indicator scale. Low normal high meter infographic animation on black background. Showing high pressure level color gauge indicator.4k quality animation video
00:10
HD
Bright white 3D number 2004 text animation floating against a deep black void offering a vibrant and modern visual for the year with a sense of digital energy.
00:10
HD
Business graph. loss graph direction. damage business graph. down business graph icon. business or finance concept icon animation.
00:07
HD
Business Graph Crash Down with Red Arrow, Falling Market Motion Graphic.  down business arrow
00:10
HD
Cost cuts business concept motion with red arrows and typography finance savings
00:08
HD
Red line graph against black background
00:05
HD
Red arrow, pointing down, with white outline, motion, graphic, on, Alpha channel, isolated, directional, indicator, downward, trend, decrease, negative, growth, download, icon.
00:07
HD
Money loss. Cash with down arrow stocks graph, concept of financial crisis, market fall. animated of cost symbol dollar increase and decrease icon, money, dollar sign with arrow down . 4k
00:10
HD
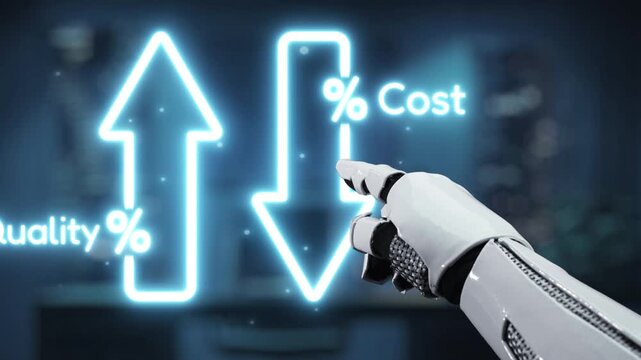
A robotic hand interacts with glowing indicators of cost and quality, symbolizing the impact of technology on business efficiency and decision-making processes. Auvana
00:13
HD
A Man in the Kitchen Opens the Stove Door and Rotates the Gas Button Increasing or Decreasing the Fire and Inside Temperature.
00:11
HD
Minimizing overhead costs concept portraying financial management strategies, optimizing resources, and improving business efficiency to decrease unnecessary expenses and increase profitability
00:17
HD
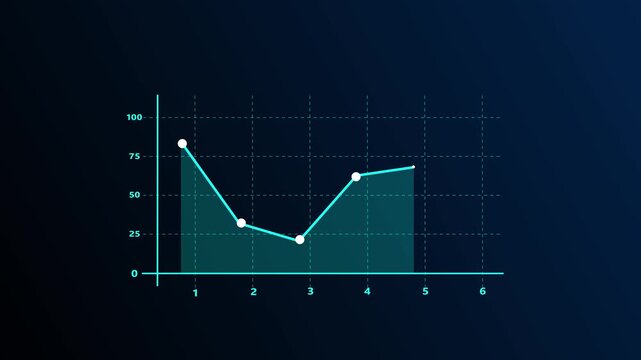
Modern line graph displays falling investment market trends. Technical line graph monitors negative corporate revenue data. Financial crisis concept with digital line graph.
00:10
HD
Financial growth abstract blue neon chart digital technology progress innovation upward trend. Blue neon bar graph animation business economy investment market statistics analytics visualization.
00:09
HD
business team discussion reusable product in office,start up eco-friendly business,environmental protection,sustainable business model,ESG strategy,sustainability,team meeting,ESG Report concept
00:16
HD
black business graph chart growth up down or signal on white background with alpha channel. Business up and down signal concept.
00:07
HD
White dollar sign with green fill and grey 40 percent number on dark background with green abstract lines representing financial growth and economic data analysis
00:06
HD
Animated statistics bar decreasing icon, simple motion graphics with black background
00:04
HD
Maldives Oil Prices Decline with Oil Barrels, Gold Coins and Downward Green Arrow, 3D Economic and Financial Market Concept
00:11
HD
Market Recovery Concept. Successful growth trend blue line graph going Up. Business graph chart with growing business concept. Abstract decreasing business graph chart animation background.
00:10
HD
Mozambique Oil Price Falling with Oil Barrels Downward Green Arrow and 3D Financial Data Visualization Graphs for Economy and Business Concept
00:11
HD
Animation footage of a graph showing a downward trend, a downward bar graph, and an arrow chart
00:11
HD