Электронное письмо с подтверждением и ссылкой для установки пароля отправлено по адресу Для доступа к покупкам в будущем вам понадобится пароль.
Получите 3 видео или 25 изображений в рамках бесплатной пробной версии
Добавлены новые фильтры
Сортировать по

19 768 результатов по запросу «increase and decrease» в категории «видео»

Business growth concept in graph chart showing marketing sales profit increasing and decreasing to future target . growing business concept. Clean Hi-tech style technology chart with a grid Mockup.
00:12
HD
Animated Red Bar Chart Showing a Declining Negative Business Trend
00:09
HD
Reducing unemployment rates leading to job growth, increasing financial stability, and improving social welfare for individuals and families in the economic landscape
00:17
HD
3D Rendered Red Percent Symbol Isolated on a Clean Light Gray Background for Black Friday and Sales Promotions
00:05
HD
Mobile-Optimized Forms Word Cloud
00:11
HD
LGBTQ economic bar chart graph showing decreasing downturn with national Flag 3D animation on black background.
00:16
HD
Down arrow business graph chart animation. Loss business graph icon animation.  on black background. 4k video
00:10
HD
Glowing neon line House under protection icon with up arrow isolated on black background. a glowing light drawing a neon outline of houses decreasing in size. House, home building. 4K
00:10
HD
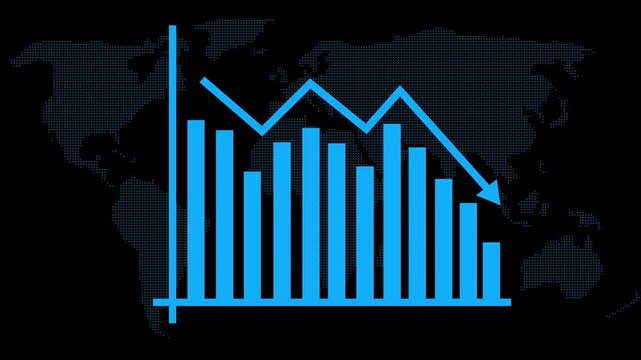
Declining bar chart with downward trend, Blue bar chart with falling line graph decline in business data, finance performance and analytics animation
00:07
HD
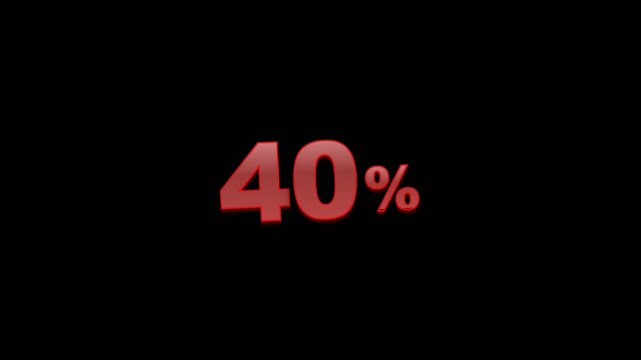
Red 3D forty percent symbol on black background
00:08
HD
A businessman uses a smartphone to review quality and cost metrics while working on a laptop in a dark office. The image illustrates data analysis in a modern environment. Qubit
00:14
HD
glowing neon line business graph growth arrow to down arrow. Financial business Loss down graph chart with red neon line, glowing red neon downward graph with arrow indicating decline, 4k video
00:10
HD
Bar chart for declining business performance by month. the curve shows a downward move .chart graph animation, 4k arrow is making downfall on a grid ...
00:10
HD
Animated bar graph showing monthly data trends with orange bars against a black background
00:15
HD
Minimalist animated bar chart showing negative financial trend with declining revenue growth and economic downturn concept for corporate business presentations and data analysis reports in media
00:10
HD
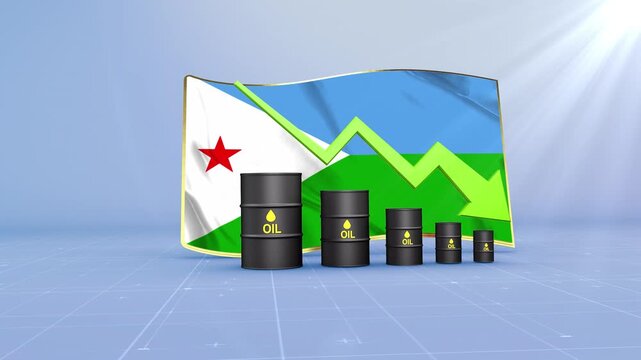
Djibouti Oil Price Falling with Oil Barrels Downward Green Arrow and 3D Financial Data Visualization Graphs for Economy and Business Concept
00:11
HD
Minimalist Bar Chart Animation on a Green Background for Business Data Visualization
00:08
HD
Mobile Network Signal Strength Animation
00:05
HD
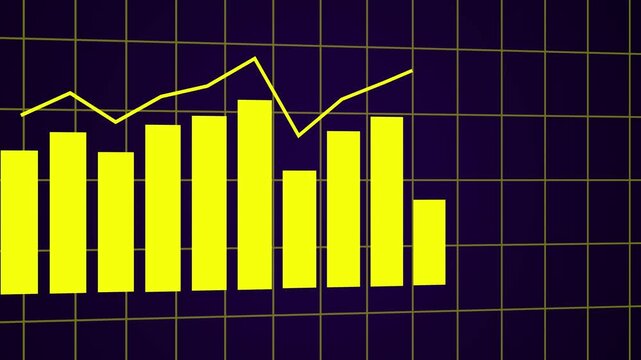
Animated yellow bar chart and line graph showing financial data on grid background
00:10
HD
line graph showing cost reduction and improving quality. Successful business strategy, efficiency, product optimization and management. Business steady growth concept with rising progress bar chart
00:10
HD
Calculator App Icon with Changing Numbers on Green Screen
00:07
HD
Business crisis line chart animation with downward arrow loop on black background...
00:13
HD
Pricing adjustment process involves calculating costs, managing finances, and setting competitive prices to optimize business performance using financial data and strategic analysis
00:17
HD
Abstract dollar sign icon and up arrow animation on a white background. Upward arrow and dollar icon. High pricing icon. profit, investment, growth business, economy, finance and success concept
00:10
HD
Zoom in and out animation the cat symbol. Large black symbol in the center and four small symbols around. Seamless looped 4k animation on white background
00:12
HD
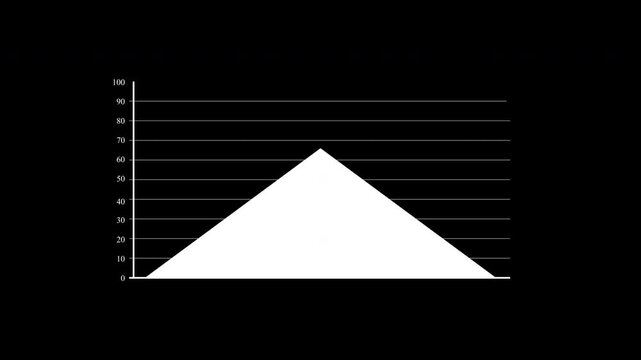
triangular progression representing data growth and decline over a graph, visualized to highlight change across a timeline or value axis with alpha channel
00:07
HD
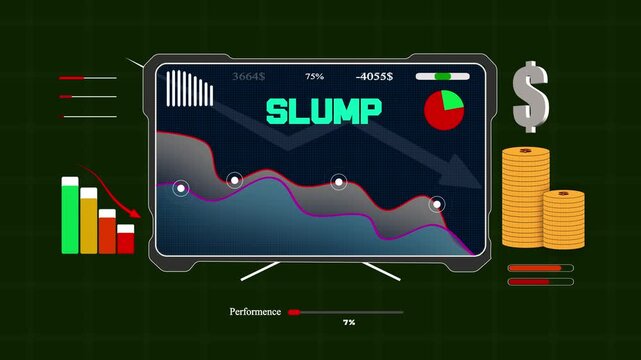
Modern electronic screen displaying successful slump metrics with decreasing charts for investment trading and risk presentations
00:15
HD
Yellow chrysanthemums cluster on the right against a softly blurred autumn garden background as the focal length decreases.
00:15
HD
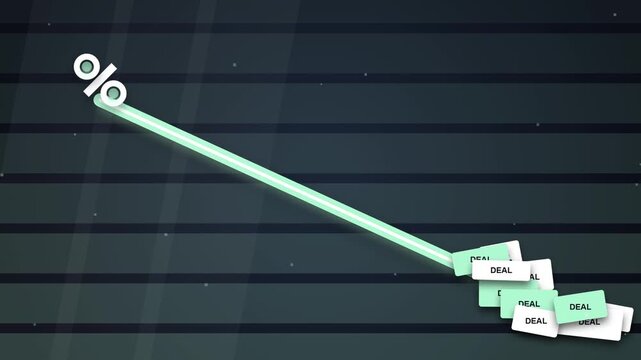
Financial Decline Graph with Percentage Symbol and Falling Data Blocks
00:10
HD
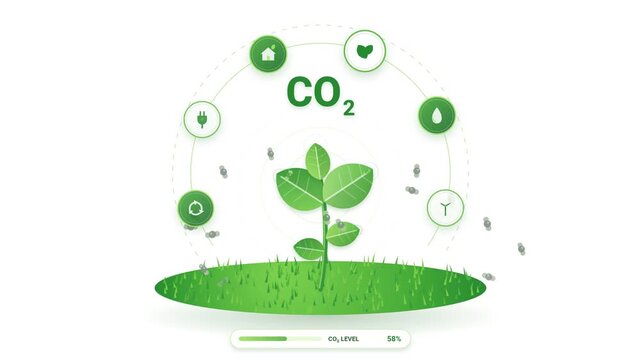
Green energy and carbon neutral concept, plant growing with eco icons and CO2 text, environmental sustainability concept
00:10
HD
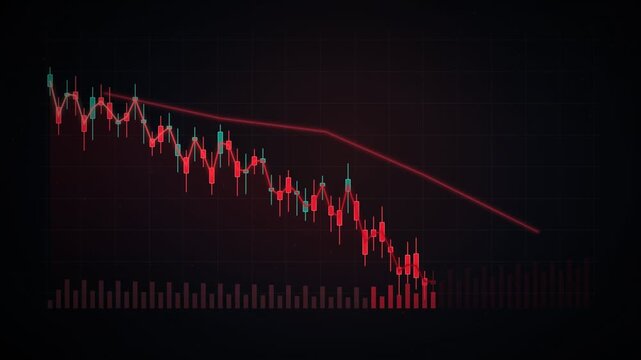
Stock market candles with falling prices of securities. Loss of assets in equities, showing a decreasing trend, poor performance, and financial losses due to economic crisis.
00:17
HD
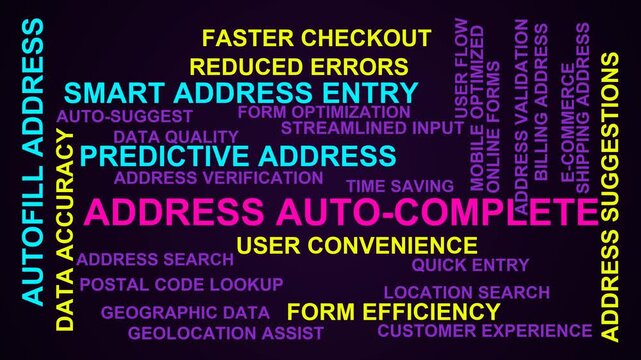
Address Auto-Complete Word Cloud
00:11
HD
A high-fidelity financial chart displays a fluctuating market trend on a computer screen with a total value of $1685.97 showing a 0.04% increase.
00:14
HD
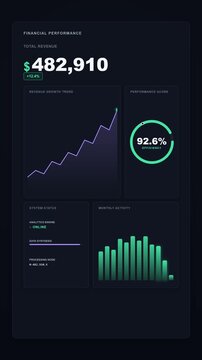
Modern financial dashboard with charts and growth metrics on dark background.
00:08
HD
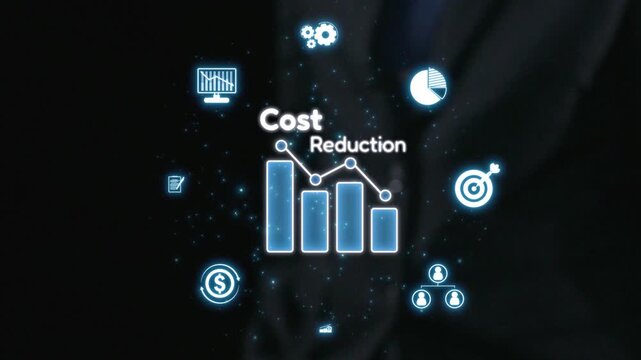
A professional business setting showcasing an abstract visualization of cost reduction concepts. The image features various financial icons and charts, emphasizing strategies for improvement. Qubit
00:14
HD
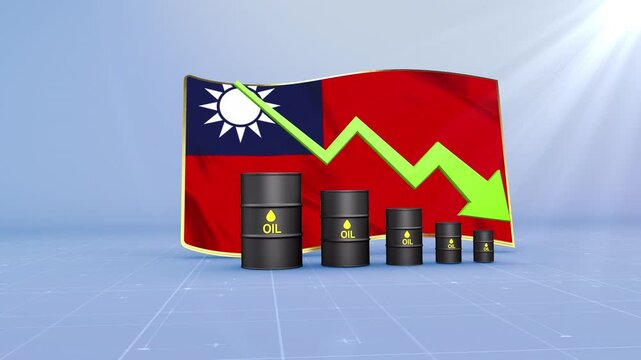
Taiwan Oil Price Falling with Oil Barrels Downward Green Arrow and 3D Financial Data Visualization Graphs for Economy and Business Concept
00:11
HD
Stick figure pushing a large percentage symbol on a textured background finance
00:05
HD
Carbon Footprint Reduction and Tree Growth Cycle Motion Graphics
00:13
HD
Blue Neon Dollar Sign with Downward Arrows in Circle
00:10
HD
POV of a user reviewing their 30 day meditation streak on a mobile app. The interface displays 1,260 minutes meditated and a perfect consistency score. Ideal for illustrating personal growth
00:12
HD
Financial Growth Trend Animation with Positive Revenue Indicators
00:09
HD
Down curve arrow animation, Falling prices concept arrow animation.Motion graphic 4k animation video.
00:06
HD
Percentage allotments concept financial income distribution, tax planning, economy growth, and budget allocation with documents, money stacks, and a calculator
00:17
HD
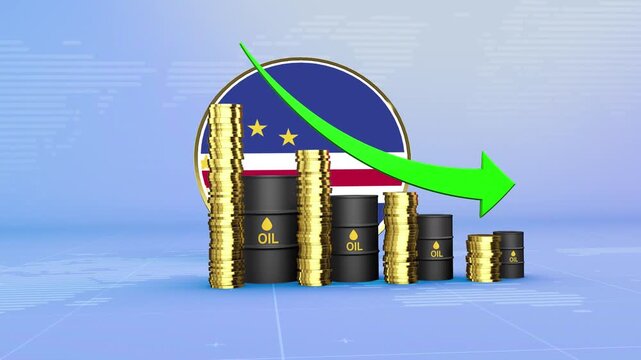
Cape Verde Oil Prices Decline with Oil Barrels, Gold Coins and Downward Green Arrow, 3D Economic and Financial Market Concept
00:11
HD
Chart Time Graph Icon Animation with Glowing Lines on Black Background
00:08
HD
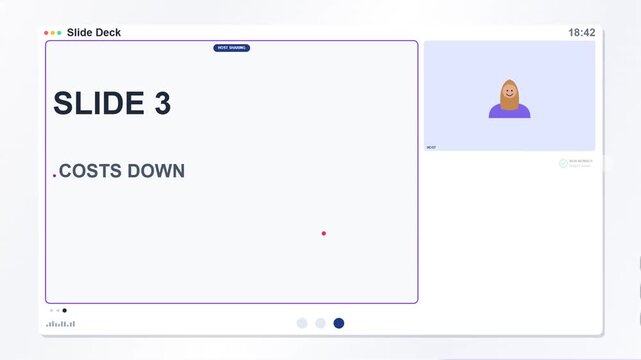
Digital Slide Deck Presentation Animation Showing Revenue Growth User Increase and Cost Reduction Metrics
00:10
HD
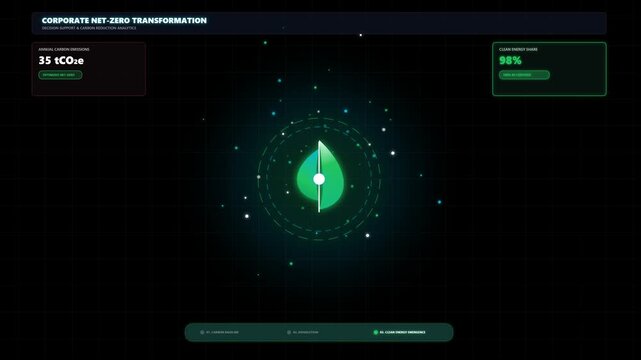
Corporate Net Zero Transformation: Footprint Reduction Animation, CO2 Emission Data Visualization
00:06
HD
Business concept: reducing cost while increasing financial growth and optimization strategy, infographic animation for corporate presentations
00:10
HD
Testosterone Level Gauge Increasing and Decreasing Indicating Hormonal Activity Animation
00:19
HD
3D green Declining Bar Chart with Up Arrow for Representing Falling Sales, in 4K loop animation on White Background
00:09
HD
White geometric arrow shapes pointing up and down on black background
00:16
HD
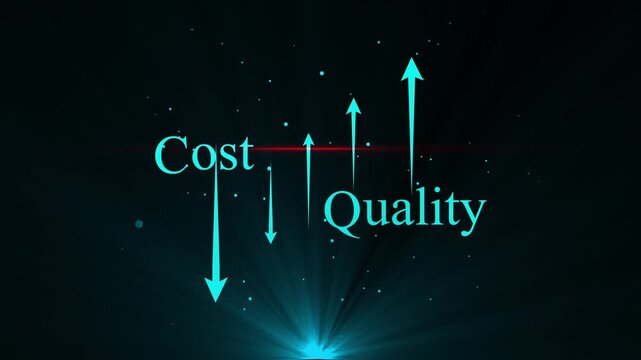
Download free with trialBusiness efficiency concept on black background. how much a company or organization can produce as it relates to time, cost and quality.
00:15
HD
Bar chart animation shows a downward falling trend arrow on dark. Financial revenue loss reflects on this bar chart. Negative economic performance marks the chart.

00:12
HD
Progressive numbers counting down in circles on black background with cinematic motion for business analytics
00:46
HD
Hands Typing on Keyboard with AI Icons Representing Quality and Cost Trends in Modern Technology and Business Strategies for Efficiency and Innovation Gluon.
00:10
HD
Moldova Oil Price Falling with Oil Barrels Downward Green Arrow and 3D Financial Data Visualization Graphs for Economy and Business Concept
00:11
HD
Motion of Bar Graphs Showing Data Trends in a Dynamic Video.
00:10
HD
business graph chart and success ndicating profit profit and loss business plan
00:10
HD
Price drop animation from 1299 to 849 with 35 percent sale discount
00:10
HD
Red Downward Trend Graph on Green Screen Background
00:15
HD
Corporate Revenue Growth Dashboard Animation with Positive Trend Visualization
00:13
HD
Downward Trending Bar Chart with Red Arrow on Black Background graph data
00:07
HD
Business hand holding a financial risk meter while monitoring asset value fluctuations and checking investment portfolio data and analytics for timely market decisions
00:17
HD
Mauritius Oil Prices Decline with Oil Barrels, Gold Coins and Downward Green Arrow, 3D Economic and Financial Market Concept
00:11
HD
Discount percent signs moving on abstract background with dynamic curved lines
00:08
HD
arrow down business graph icon animation. business chart concept. A neon down business graph icon graphic concept. animation
00:10
HD
3D Business Statistics Bar Chart with Downward Arrow Showing Financial Decline, Falling Revenue, Market Loss and Negative Growth Data Visualization on Green Screen
00:05
HD
Digital trend line chart tracks positive corporate growth paths. Technical trend line chart monitors stock market trading performance. Business data analytics with a trend line chart.
00:08
HD
Business growth concept in graph chart showing marketing sales profit increasing to future target . growing business concept. Clean Hi-tech style technology chart
00:10
HD
Business growth concept in graph chart showing marketing sales profit increasing to future target . growing business concept. animation
00:10
HD
glowing neon line business graph growth arrow to down arrow. Financial business Loss down graph chart with red neon line, glowing red neon downward graph with arrow indicating decline, 4k video
00:10
HD
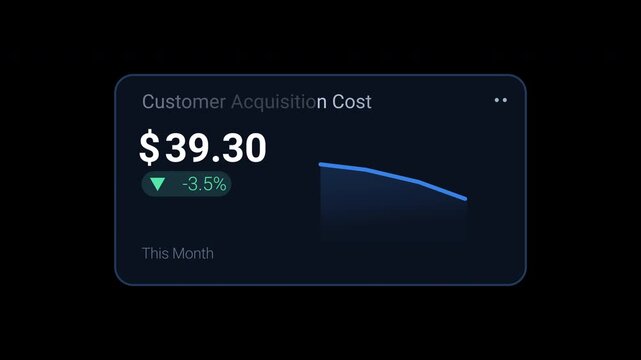
Blue fintech customer acquisition cost KPI dashboard card with currency value, decrease percentage and trend graph. Animated motion graphics component for marketing reports, startup analytics,
00:10
HD
Bar chart glowing in vibrant blue light depicts a decreasing numerical trend with a prominent downward arrow signaling reduced fiscal output or negative profit margins for your professional report.
00:10
HD
Four grey circles animating and scaling on white background with copy space
00:08
HD
A dynamic representation of hands working together with gears, symbolizing collaboration towards achieving net zero CO2 emissions and promoting sustainable practices in various sectors. Raster
00:15
HD
Turkey Oil Price Falling with Oil Barrels Downward Green Arrow and 3D Financial Data Visualization Graphs for Economy and Business Concept
00:11
HD
coin money dollar cash value rise with arrows pointing up represent financial profit economic growth outline
00:05
HD
Norepinephrine Level Gauge Increasing and Decreasing, Alertness and Stress Response 2D Motion Graphic
00:19
HD
Business Bar Chart Showing Financial Loss with Downward Red Arrow on Green Screen Chroma Key Background
00:12
HD
Glowing neon line graph downwards against black background animation. Stock market losses and descending trading graph and downward arrows recession
00:10
HD
Professional Business Growth Chart Animation with KPI Analytics
00:09
HD
Financial market chart shows price movements with multiple trend lines and data points during trading hours.
00:10
HD
Per unit pricing agreements abstract concept outlines managing costs. Calculating expenses. Negotiating terms. Monitoring inventory. Tracking delivery
00:17
HD
Honduras Oil Prices Decline with Oil Barrels, Gold Coins and Downward Green Arrow, 3D Economic and Financial Market Concept
00:11
HD
Businessman analyzing profit and quality management concepts long term cost planning, product quality, budgeting, financial forecasting, and company revenue and expense projections.4k video
00:10
HD
Dynamic teal arrow soaring down with a smooth curve, representing forward momentum, achievement, and positive financial trends. A neon down business graph icon graphic concept. animation
00:06
HD
Green Bar Chart Showing Growth and Decline Over Time.
00:11
HD
Cyan bar chart animation displays fluctuating market trend lines. Trading volatility analytics track on this cyan bar chart. Corporate economic investment revenue drives the bar chart.
00:10
HD
abstract business graph chart icon animation 4k
00:06
HD
Libido Level Text or Word Low and Medium to High Meter Concept Animation on Black Background and Blue Screen
00:58
HD
Zoom in and out animation the wild bear symbol. Large black symbol in the center and four small symbols around. Seamless looped 4k animation on white background
00:12
HD
Market Downturn Coins  Arrow Graph Showing Economic Challenges.
00:10
HD
Plummet Business Growth Infographics With Arrow 2d Animation with Alpha Matte
00:16
HD
Minimalist white circles expanding and contracting on a black background with subtle zoom effect
00:11
HD
A visually striking image featuring hands typing on a keyboard with illuminated indicators for quality and cost, symbolizing digital business analysis and strategic decision-making. Qubit
00:14
HD
Afghanistan Crude Oil Price Drop with Oil Barrels Downward Green Arrow and 3D Financial Data Visualization Graphs for Economy and Business Concept
00:11
HD
Line bar graph illustrating a downward trend with  symbols  sign indicating low expense and financial decrease on a dark background.
00:10
HD
Libido Level Gauge Increasing and Decreasing Indicating Desire and Hormonal Response Animation
00:19
HD
Video with the phrase Live the Moment in Spanish, animated word by word with letter spacing reduction and sharp zoom transitions, delivered in four background and outline versions.
00:12
HD
Sustainable business partners discuss renewable energy models and ESG investment strategies for a greener future
00:13
HD