Электронное письмо с подтверждением и ссылкой для установки пароля отправлено по адресу Для доступа к покупкам в будущем вам понадобится пароль.
Получите 3 видео или 25 изображений в рамках бесплатной пробной версии
Добавлены новые фильтры
Сортировать по

19 700 результатов по запросу «increase and decrease» в категории «видео»

Business concept showing cost reduction and quality increase using Lean, Six Sigma, and Total Quality Management (TQM) to enhance efficiency, value, and customer satisfaction. Muxer
00:12
HD
Bar graph data decreasing over time on a digital display with a green neon glow
00:10
HD
Simple bar and line chart showing business graph data trend and growth animation
00:07
HD
Animated blue bar charts showing financial growth and data statistics on dark background.
00:10
HD
One-Click Checkout Word Cloud
00:11
HD
Modern bar chart tracks positive corporate growth trends. Commercial bar chart displays rising stock market analytics data. Financial success with digital bar chart.
00:12
HD
Awareness level gauge meter animation: measuring low to progress and status indicator
00:10
HD
Diamond Shape Film Matte Overlay increasing and decreasing size Animation. Rhombus element Film Frame. Geometric rhomb design symbol border. 4K Seamless loop.
00:10
HD
Annual tax reduction planning concept. Person typing on keyboard with calculator, tax form deduction and financial savings icons, smart corporate and personal income tax strategy.
00:10
HD
Analysis of Financial Data Display Showcasing Market Fluctuations Represented by Digitally Rendered Numbers on a Screen with Distorted Visual Elements
00:30
HD
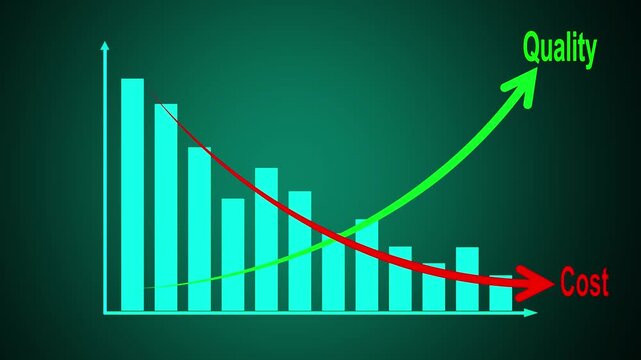
  Quality improvement and cost reduction concept. in allusive graph chart showing marketing sales profit increasing to future target.
00:10
HD
Animated Text "DOWN UP" on Black Background - Stock Video Footage
00:06
HD
Social media engagement metrics showing likes comments saves and shares over time on a black background
00:08
HD
Abstract bar chart graphic design fluctuating data visualization colorful bars modern infographic background white and blue gradient
00:10
HD
Temperature management screen, user drags the slider to change the temperature
00:13
HD
Animated digital cyan bar chart showing a decreasing trend in business performance for financial loss and analysis visuals. Bar chart animation with decreasing trend perfect for financial downturn. 4k
00:10
HD
Financial loss concept: dollar coin with downward arrow animation for economic decline and market recession analysis. Financial Loss, Decrease, Price Drop and Money Reduction Concept.
00:10
HD
Stock Market Chart Animation Showing Buy The Dip Opportunity
00:10
HD
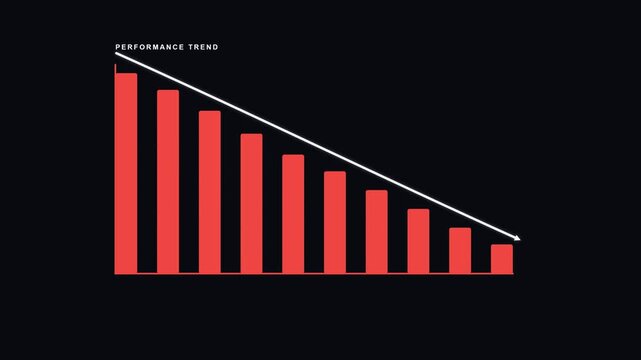
Animated Declining Bar Chart on Dark Background Showing Performance Trend, Negative Financial Growth, and Market Downward Movement for Professional Business and Economic Presentations.
00:06
HD
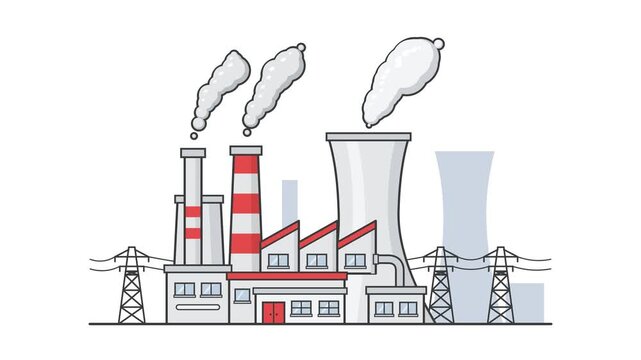
Industrial factory complex with smoking chimneys, cooling tower, and power lines representing manufacturing, energy production, and potential environmental impact
00:15
HD
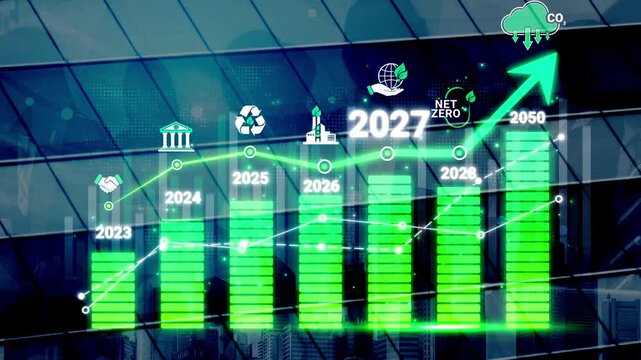
Sustainable Development Goals Progress Chart with Future Projections for Net Zero Emissions and Environmental Awareness by 2050 Sigmoid
00:10
HD
Red glowing bar graph declining on black background representing business and financial data concept
00:05
HD
Glowing Corporate Performance Growth Animation with Modern Business Statistics
00:09
HD
Animated declining bar chart with curved downward arrow showing monthly performance decrease from January to December. Visualizing revenue loss, business downturn, and financial analytics
00:10
HD
Falling bar chart with a downward line and rising arrows animation, Business chart with rising arrows decline
00:09
HD
Financial Bar Chart Showing Growth and Decline from 2021 to 2025 with Upward Arrow. Animated finance chart illustrating yearly growth and decline 2021-2025 with rising arrow.
00:07
HD
Cost reduction concept. Cost wording on decrease money with down arrow. Cost Management, Economy recession, low budget, Effective business, Expense reduce on transparent background 4k video,
00:10
HD
Dashed line with upward and downward arrow icon animation on green background. Single up and down arrow icon representing data trend increase and decrease indicators being shown with alpha channel
00:10
HD
Workload increase. much work pressure.
00:12
HD
Animated curved arrow icons loop via trim paths. White hand drawn line graph on a green background
00:06
HD
Sustainable Energy Infinite Recycling Loop Animation
00:15
HD
Bar Chart, Profit Down, financial decline trend line chart, Economic crisis, recession, inflation, decrease graph. Bar chart Profit down. Concept of economic crisis, recession, inflation.
00:10
HD
Business growth concept in graph chart showing marketing sales profit increasing to future target . growing business concept animation on black background. 4k video
00:10
HD
Neon Percentage Symbol with Glowing Blue and Pink Light on Black Background for Finance, Discount, Business and Digital Marketing Concept.
00:10
HD
Red and white discount sale tags hanging on strings for retail promotion and marketing campaigns
00:08
HD
Business growth concept in graph chart showing marketing sales profit increasing to future target . growing business concept. Clean Hi-tech style technology chart ,Graph animation 4k video..
00:10
HD
Efficiency growth chart animation rises on grids. Corporate efficiency growth chart animation tracks optimization plans. Modern efficiency growth chart animation details assets.
00:10
HD
Up arrow graph decreasing business graph concept motion
00:06
HD
A fracturing dollar sign animation, could stand for falling bank failing money, bills or broke city our country, business going bankrupt , buy an overpriced item, credit card debt, debt increasing, mo
00:09
HD
Looped 3D animation of a fluctuating line graph on a grid, showing rising and falling data trends, financial growth, market volatility, statistics and business analytics.
00:10
HD
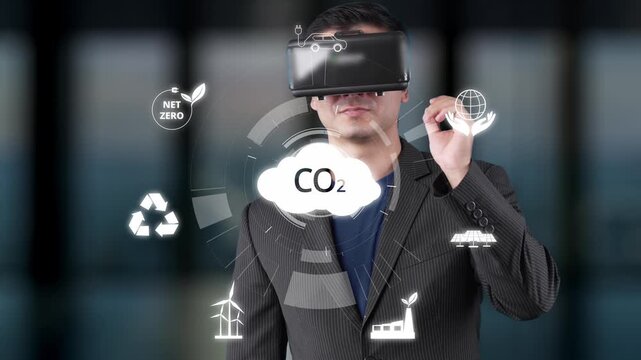
A businessman engages with virtual reality technology in an office setting, highlighting concepts related to carbon emissions and sustainability initiatives, symbolizing innovation. Raster
00:15
HD
Abstract chart with bar graph and line graph showing business data trend animation
00:09
HD
Revenue and Profit Growth Animation for Corporate Business Reports
00:08
HD
Business graph chart arrow line down white color animation on black background. growth concept white moving.
00:15
HD
Modern graphic illustration promoting a limited-time offer, encouraging customers to seize significant financial advantages instantly
00:15
HD
Community Impact Word Cloud
00:11
HD
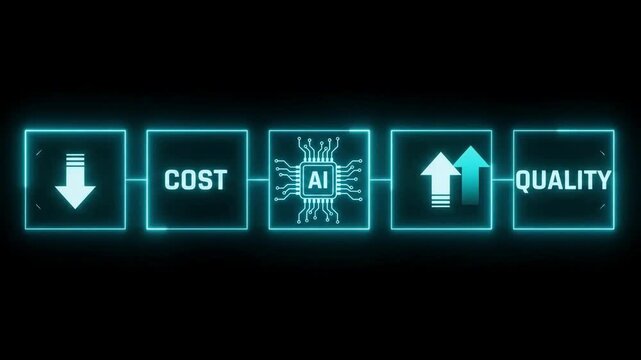
Artificial Intelligence Reducing Cost and Increasing Quality Concept, AI Chip Process Automation, Cost Down Quality Up Neon Glowing Digital Diagram Motion Graphics Animation Video
00:08
HD
Profit and Loss Business Chart Showing Financial Growth and Decline
00:08
HD
Cost reduction concept. Cost wording on decrease money with down arrow. Cost Management, Economy recession, low budget, Effective business, Expense reduce on transparent background 4k video,
00:10
HD
Threat Level Indicator Gauge Animation with Low Normal and High Risk Scale
00:10
HD
Commerce concept digital marketing strategies for driving sales, showing various methods of offering price reductions and special deals to attract customers online and in retail
00:17
HD
Black Friday savings growth represented by rising stacks of gold coins with discount percentages
00:10
HD
Dynamic financial graph motion graphic, animated business chart illustrating growth and decline over time
00:10
HD
Digital E-commerce Promotion Banner Featuring Online Shopping Cart Graphics and Seasonal Discount Savings Offers
00:10
HD
Dynamic Financial Market Data Visualization Showcasing Real-Time Stock Changes with Color-Coded Numerical Trends in a High-Definition Display
00:30
HD
Cost control and quality improvement concept. Teal bar chart with line graph showing cost reduction and improving quality. Successful business strategy, efficiency, product optimization and management
00:10
HD
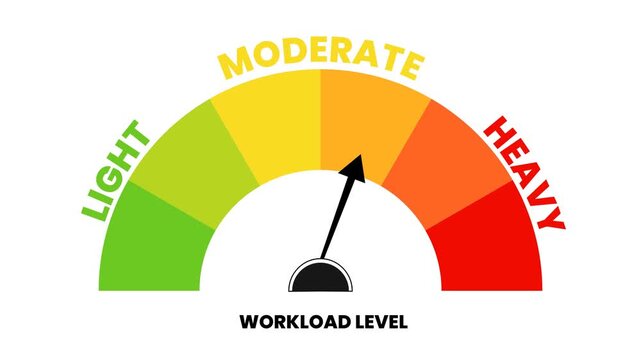
Dynamic Workload Level Indicator Gauge Animation showing Light, Moderate, Heavy Progression
00:07
HD
Rising graph, chart moving up, stock market rally, plus hundred percent, gain, high profit. Bull market, economic moving up, growth, progress, strong business.
00:09
HD
Corporate loss statistic chart animation with down arrow hud screen
00:06
HD
Upward arrow direction One line continuous drawing animation. animated hand- drawn banner lineart illustration design. isolated sign symbol monoline video black outline on white background backdrop
00:10
HD
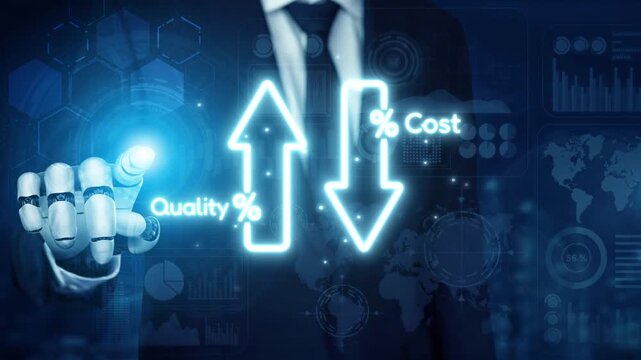
Futuristic Robotic Hand Presenting Data Analytics on Artificial Intelligence Impact on Quality and Cost in Modern Business Environment Gluon.
00:10
HD
Abstract chart with bar graph and line graph showing business data trend animation
00:09
HD
Financial Growth Trend Animation with Positive Revenue Indicators
00:09
HD
Quality Improvement and Cost Reduction Business Strategy Showing Rising Quality and Decreasing Costs for Operational Efficiency and Competitive Performance
00:10
HD
Net Zero 2030 Sustainability Infographic Animation with Rising Green Growth Bar Charts and Eco Friendly Progress Concept
00:10
HD
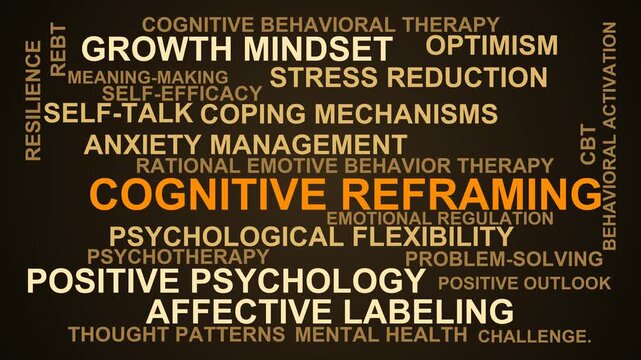
Cognitive Reframing Word Cloud
00:11
HD
Financial Business Chart with Stock Market Down Arrow and Economic Crisis Animation video.
00:08
HD
White 3D Percent Symbol on Black Background for Finance, Discount and Business Concept
00:10
HD
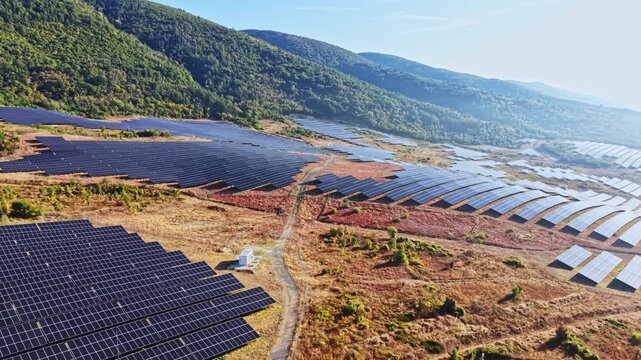
Large fields of solar panels spread across hills under bright daylight. The site is part of a renewable energy project aimed at harnessing solar energy.
00:18
HD
Business graph chart with growing business concept. Abstract decreasing business graph chart animation background. business or finance concept icon animation. 4k video
00:10
HD
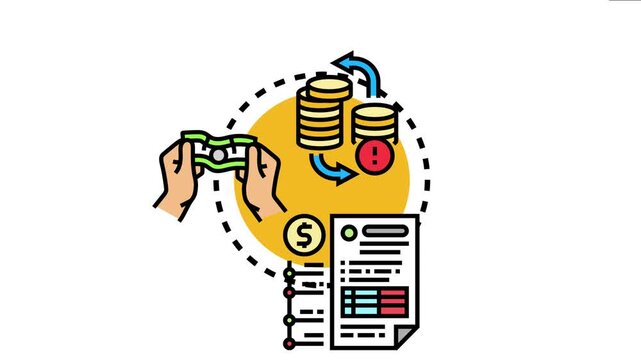
Hands holding currency alongside coins, a financial document, and arrows indicating monetary circulation, concepts of income growth, revenue management, and expense reduction
00:17
HD
Line graph showing fluctuating upward data trend with repeated rises and dips on a dark grid
00:07
HD
Colorful Neon Bar Chart Showing Declining Values for Finance, Business Analytics, Market Trends and Data Visualization
00:10
HD
Business line graph showing green growth trend and red declining data on dark grid background in motion.
00:12
HD
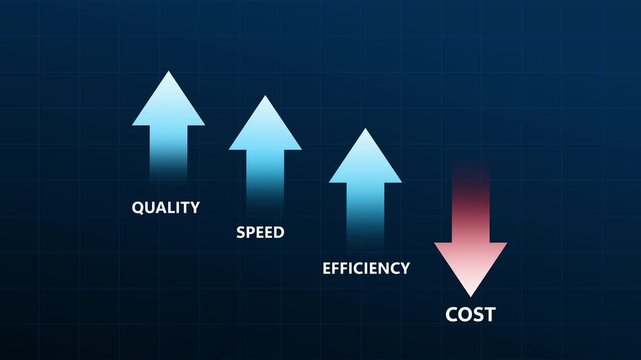
Quality Up Cost Down Bar Chart Animation Business Efficiency Concept
00:10
HD
Simple bar and line chart showing business graph data trend and growth animation
00:07
HD
Up and down arrow icons on black circles with direction movement increase decrease progress navigation interface transfer download feedback on alpha channel.
00:06
HD
Green line graph with multiple upward and downward segments displayed on a black background, showing data progression or trend analysis.
00:08
HD
Animation of speaker volume with alpha channel, Speaker volume animation. sound up down icon
00:10
HD
Downward Arrow Animation Loop for Business Decline, Financial Loss, Decreasing Profits, Negative Growth, Falling Trend, Market Drop and Corporate Motion Graphic..
00:10
HD
Net zero goals and CO2 reduction strategy driving sustainability, green energy integration, net zero emissions policies, and climate-friendly sustainability solutions for business and society. Muxer
00:12
HD
Zigzag line with a downward arrow falling trend loss decline and negative business direction animation
00:06
HD
Business Analytics Dashboard Motion Graphic with Growth Statistics
00:10
HD
Animated Graph Line Drawing And Moving On Dark Green Background With Glowing Particles And Abstract Dots
00:10
HD
Lush forest with digital icons representing sustainability, carbon reduction, and environmental balance. A visual representation of eco-friendly practices and nature conservation
00:10
HD
Declining Bar Chart with Curved Downward Arrow, Business Loss and Market Decrease Concept, Financial Statistics and Performance Reduction Graphic on Dark Gray Background.
00:06
HD
Alertness Level Gauge Increasing and Decreasing Indicating Focus and Awareness 2D Motion Graphic
00:19
HD
Stock Market Crash Illustration with Decreasing Graph and Arrow Going Down.. chart growth achievement digital. business growth currency stock and investment economy. Graph trending downwards.
00:10
HD
Animated financial market analysis with fluctuating crypto trade values, showcasing rising and falling graphs, dynamic bar diagrams, and a vibrant red ticker line.
00:14
HD
Business graph chart with growing business concept. Abstract decreasing business graph chart animation background. business or finance concept icon animation. 4k video
00:10
HD
Neon Celsius thermometer displayed temperature 33 degree. Digital Temperature Meter Display 33°C. That's indicates weather temperature 33 degree increase or decline.4k video.
00:10
HD
Animated Expansion and Contraction of red quarter circle on plain blue color only. Raw animation background for presentation, projects, news. Beautiful, colorful looping motion backdrop.
00:15
HD
Online shopping expenses managed with smart ecommerce saving strategy to stack coins, save money, and boost finance growth through effective money management and cost reduction
00:05
HD
stock market red arrow upward growth graph chart animated continuous single line drawing isolated on white background, line art animation illustration design sign symbol video direction
00:10
HD
Green business net zero eco growth 3000 carbon footprint reduction animation sustainability
00:10
HD
Anxiety level indicator showing increase to high level and decrease after pause. Suitable for mental health, stress response, nervous system and psychological condition visualization.
00:30
HD
Two facing Semicircle Shapes Film Matte Overlay increasing and decreasing size Animation. Orange Segment elements Film Frame. Geometric design symbol border. 4K Seamless loop.
00:08
HD
Cost and quality control concept. Successful organization strategy and management. Quality control and company cost reduction.
00:10
HD
arrow down business graph icon animation. business chart concept. A neon down business graph icon displays a glowing, downward-sloping line or bar chart, symbolizing decline, loss
00:10
HD
Market Analytics Unveiled: An investor's hand navigates a dynamic financial chart, illuminated by vibrant data, providing an intimate portrayal of economic analysis.
00:05
HD