Foi enviada uma ligação para definir a sua palavra-passe para: Irá necessitar de uma palavra-passe para aceder às suas compras futuramente.
Obtenha 3 vídeos ou 25 imagens com uma avaliação gratuita
Novos filtros adicionados
Ordenar por

1 817 resultados para speedometer graph em vídeos

dashboard speedometer gauge hud UI analytics display motion graphic
00:06
HD
Digital Speedometer Gauge Meter Arrow Accelerating Upward with Growth Bar Graph
00:10
HD
Digital dashboard interface showing a drive gauge with a red needle pointing towards levels on a white background with speedometer and bar graph
00:06
HD
Futuristic HUD digital dashboard showing wind speed speedometer and telemetry history graph with neon yellow glowing elements for weather data tracking
00:10
HD
Staggered in and out animated dark glassmorphism dashboard widget cards featuring wireframe UI text, reading stats, precision radial speedometer gauge, and waveform chart on transparent background.
00:10
HD
Digital speedometer gauge illustrating high and low stock value levels in financial markets.
00:06
HD
Business performance dashboard flat vector animation with speedometer gauge and bar chart video concept
00:05
HD
Neon Blue Business Analytics Dashboard Performance Metrics and Data Reporting : analytics UI dashboard, line graph search, performance speedometer gauge, bar chart, target checkmark, document growth f
00:10
HD
Modern Business Intelligence KPI Dashboard with Radial Performance Gauge
00:10
HD
SYSTEM STATUS  High priority speedometer animation, needle pointing to red urgent zone, Level Measuring animation. metabolism a transparent background alpha channel
00:10
HD
Neon gauge speedometer and upward trending graph with arrow symbolizing growth progress icon
00:08
HD
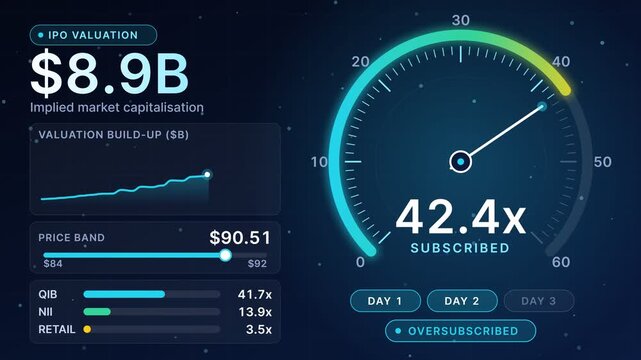
IPO Valuation Dashboard showing Market Capitalization Growth and Oversubscription Status with Animated Gauges and Charts on Digital Interface
00:10
HD
KPI speedometer gauge close angle seamless loop
00:24
HD
White outline speedometer and growing financial arrow graph icon animation on black background, performance growth and speed increase concept element, stock market loop motion graphics.
00:06
HD
Animated white line art speedometer gauge with moving needle isolated on black background Motion graphic performance indicator and speed meter overlay for video editing asset
00:10
HD
Neon glowing dashboard speed indicator and computer screen with data graph abstract digital... icon
00:08
HD
Speedometer dashboard interface with neon glowing gauges and telemetry data display for futuristic vehicle technology
00:10
HD
Digital speedometer gauge with glowing blue highlight, two line graphs below depict fluctuating data over time
00:12
HD
Animated speedometer gauge with a sweeping needle with alpha channel
00:10
HD
Digital speed meter animation, Speedometer Display on Black Background, speedometer HUD UI element animation. The arrow moves realistically.
00:15
HD
dashboard, analytics, chart, graph, gauge, interface, ui, ux, data, motion graphic
00:06
HD
number counter animation 0 to 10,000 on a transparent background, ten thousand Animated counting Numbers from 0 to 10,000 with alpha channel for likes, views,4k video animation.
00:10
HD
Digital dashboard interface showing an accelerate gauge with a red needle pointing towards levels on a white background with speedometer and bar graph
00:06
HD
Animated Modern Data Analytics Dashboard Interface with Line Graph, Bar Chart, and KPI Gauge Representing Business Growth and Statistics on a Dark Background for Technology and Finance Projects
00:10
HD
Colorful digital speedometer gauge graphic animation showing high performance and efficiency levels in modern video clip
00:11
HD
Semi-circular gauge dial needle sweeping from red to green with a soft glow, performance meter concept, no numbers, 4K
00:10
HD
Digital speed meter gauge showing rapid internet connection speed with numerical readout and graph
00:15
HD
risk meter animated bar speedometer measuring low to high with chroma Black screen background.
00:10
HD
Colorful KPI speedometer gauge on a screen room scene coming to life
00:30
HD
A professional business dashboard infographic featuring a circular speedometer gauge showing thirty-eight percent progress with blue accents on a dark black background for data analysis.
00:10
HD
Digital speed meter animation, Speedometer Display on white Background, speedometer HUD UI element animation. The arrow moves realistically
00:15
HD
Business performance neon animation with growth chart and speedometer gauge
00:10
HD
HUD Dashboard 9 futuristic interface on white background with speedometer gauges, sensor indicators, analytics charts, digital controls and modern technology motion graphics
00:10
HD
Black outline speedometer and growing financial arrow graph icon animation on white background, performance growth and speed increase concept element, stock market loop motion graphics.
00:06
HD
Neon gauge speedometer and bar graph rising arrow animation representing growth success... icon
00:08
HD
Angled fear and greed gauge with swinging needle seamless loop
00:25
HD
Speedometer gauge with fluctuating data visualization on a dark background
00:05
HD
Digital speedometer display showing units in a sleek, high-tech interface with a dark background and minimalistic design
00:12
HD
Market volatility gauge graph
00:11
HD
Gauge Dials Indicators
00:10
HD
dashboard speedometer data graph analytics monitor HUD motion graphic
00:06
HD
Animated speedometer gauge and digital bar graph overlay for performance monitoring and data visualization
00:10
HD
Digital dashboard gauge showing potential levels with a red needle pointing towards on a black background with speedometer and bar graph
00:06
HD
Risk speedometer icon or sign of different colors with black arrow. Motion graphic 60 FPS Blue Background Removable
00:10
HD
Animated sentiment analysis dial gauge with needle live text feed, for real-time text intelligence, emotion detection, live market signal monitoring dashboard
00:20
HD
Glowing orange neon speedometer icon with upward trending graph arrow symbolizing speed
00:08
HD
Digital interface featuring a neon purple speedometer surrounded by financial bar charts and data graphs on black background.
00:11
HD
risk meter animated bar speedometer measuring low to high with chroma Black screen background.
00:10
HD
Dashboard animation speedometer gauge with dedicated bottom readout, sharp linear segmented analytics chart drawing.
00:10
HD
Futuristic HUD UI Dashboard with Risk Management Gauge and System Metrics Graph 4K
00:10
HD
Digital speed meter animation, Speedometer Display on Black Background, speedometer HUD UI element animation.
00:15
HD
Smart analytics neon with financial growth graph and speedometer gauge animation business intelligence
00:10
HD
Grid of Six Speed Meters Performance Level Animation
00:08
HD
Gauge needle led illumination digital panel, bar graph battery meter. Led bulb display instrument from red to green. Circular bargraph display
00:08
HD
Glowing blue neon speedometer gauge with upward trending bar graph and arrow symbolizing icon
00:08
HD
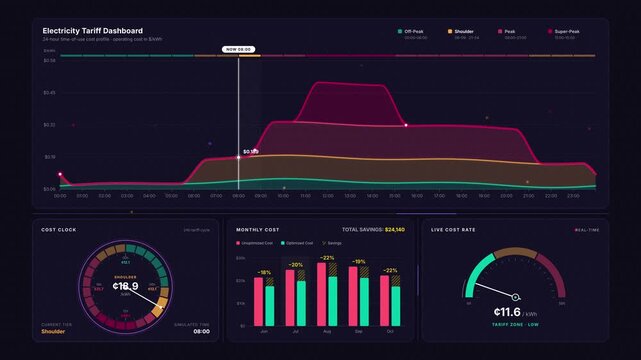
4K animated electricity tariff dashboard showing stacked area charts, cost clock, and bar comparisons on dark purple gradient background for commercial creative technology and business use.
00:15
HD
RELIABILITY High priority speedometer animation, needle pointing to red urgent zone, Level Measuring animation. metabolism a transparent background alpha channel
00:10
HD
Digital speed meter animation, Speedometer Display on Black Background,  speedometer HUD UI element animation. The arrow moves realistically.
00:15
HD
Neon sign Digital speed meter animation. Speed Animation or speed test tachometer, Simple speedometer icon. Risk concept on speedometer.
00:10
HD
Speedometer needle moves from red to green. The needle shows performance levels. Perfect for progress, efficiency, or health indicators. Great for business, tech, or fitness projects
00:08
HD
Speedometer gauge dashboard animation with digital indicators and HUD
00:06
HD
health animated speedometer measuring low to high with chroma black screen background.
00:10
HD
Digital gauge interface showing genius levels with a red needle pointing towards on a white background with speedometer and bar graph
00:06
HD
Performance gauge meter animation showing decreasing efficiency and speed levels with color-coded segments on white background
00:16
HD
Car fuel dashboard moving up. Speed meter animation. Animation of car dashboard speed rpm meter icon concept.Car fuel dashboard moving up. Speed meter animation. 4k video.
00:10
HD
Futuristic green HUD interface with data charts, speedometer, and analytical graphs in dark space
00:10
HD
Symmetrical wide perspective of digital business dashboard floating in a 3D virtual grid space displaying KPI speed indicators.
00:11
HD
risk meter animated bar speedometer measuring low to high with chroma White screen background.
00:10
HD
Opening HUD showing map to 15 km, accelerating mode rotating graph fluctuating showing performance
00:10
HD
speedometer isolated icon on black background. simple speed meter icon animation.
00:12
HD
number counter animation 0 to 5,000,000 on a transparent background, five million Animated counting Numbers from 0 to 5,000,000 with alpha channel for likes, views, amount concepts in 4k.
00:08
HD
Neon sales growth bar chart and speedometer animation for business performance and financial success
00:10
HD
Business growth strategy design infographics animation on white background with screen 4k. Modern graphs with arrows and speedometer, success, reach, target, goal, business
00:08
HD
AI business growth analytics chart with line graph and revenue statistics
00:10
HD
Arrow point scale speed high status speedometer icon performance, pointer rating risk credit levels, meter, tachometer on isolated background. minimal cartoon. 3d rendering. From red to green motion
00:06
HD
Indicator level icon. Risk level animation
00:09
HD
PRESSURE METER High priority speedometer animation, needle pointing to red urgent zone, Level Measuring animation. metabolism a transparent background alpha channel
00:10
HD
AGI words in Techno Sci-Fi
00:10
HD
Speedometer Needle Moves Rapidly Showing Performance and Measurement
00:05
HD
Speedometer gauge needle sweeps from green to red. Visual shows performance levels changing. Ideal for tech, automotive, or efficiency-related projects
00:08
HD
dashboard loop motion graphic with speed gauge and financial chart
00:06
HD
Stress scale level meter test animation
00:06
HD
Digital dashboard gauge showing revolution level with speedometer and bar graph on a black background for automotive or software interface
00:06
HD
Sleek User Interface Dashboard App Animation with Modern Dark Mode Design Elements and Interactive Analytics for Digital Product Presentation
00:10
HD
Futuristic digital dashboard interface showing business data analytics and performance metrics.
00:10
HD
Car fuel dashboard moving up. Speed meter animation. Animation of car dashboard speed rpm meter icon concept.Car fuel dashboard moving up. Speed meter animation. 4k video.
00:10
HD
Abstract digital dashboard with a glowing bar chart and speedometer indicator representing increased performance and efficiency
00:08
HD
Neon glowing speed meter and graph on computer screen abstract digital technology concept icon
00:08
HD
Neon sign Digital speed meter animation. Speed Animation or speed test tachometer, Simple speedometer icon. Risk concept on speedometer.4k animation motion graphics video.
00:10
HD
Animated speedometer sign. Indicator level icon. Risk level. Car speedometer cartoon animation on white. Risk meter. Risk concept on speedometer, vector illustration. Scale low, medium or high risk on
00:15
HD
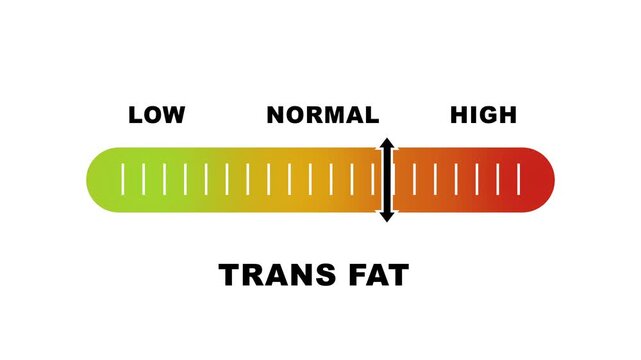
Trans fat level indicator scale. Low normal & high meter infographic animation on white background. Showing high trans fat level color gauge indicator for nutrition and heart health monitoring.
00:10
HD
Neon profit growth chart and speedometer animation for business financial success and performance analysis
00:10
HD
Neon risk meter . icon on speedometer. High risk meter. motion graphic. 4k animation
00:10
HD
Green arrow moving up on a dark grid background, upward trend and progress concept, digital data visualization
00:11
HD
Score meter. Speedometer gauge indicator. Energy efficiency and consumer satisfaction.
00:06
HD
Color gradient motion graphics gauge meter scale showing low to high level indicator dial graphic for risk score presentation on dark background
00:05
HD
POWER LEVEL High priority speedometer animation, needle pointing to red urgent zone, Level Measuring animation. metabolism a transparent background alpha channel
00:10
HD
Gauge meter showing a reading from low to high, normal is in green
00:08
HD
color speedometer customer satisfaction rating animated color speedometer for customer satisfaction score good medium bad red green yellow 4k
00:10
HD
Escalation meter showing big levels. Maximum value, off the charts. Cholesterol meter rising to max.Glowing neon speedometer icon 4k isolated on black background.
00:10
HD