Foi enviada uma ligação para definir a sua palavra-passe para: Irá necessitar de uma palavra-passe para aceder às suas compras futuramente.
Obtenha 3 vídeos ou 25 imagens com uma avaliação gratuita
Novos filtros adicionados
Ordenar por

4 392 resultados para scatter plot em vídeos

Data visualization scatter plot graph showing statistical analysis and research trends
00:10
HD
Digital line graph tracks upward moving corporate revenue. Interactive line graph demonstrates successful financial forecasting. Economic growth concept with corporate line graph.
00:10
HD
Tiny dark grey particles drift in a curved stream as a seamless loop
00:10
HD
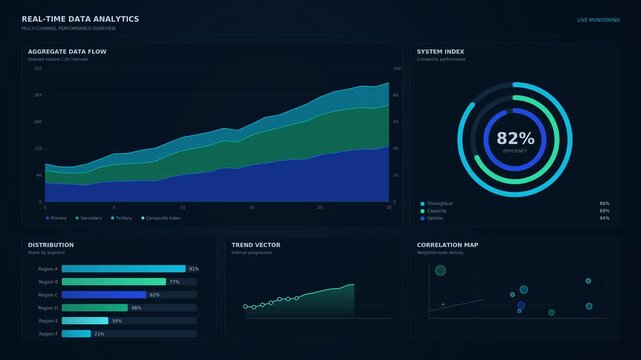
Data analytics dashboard animation, area chart, donut gauge, bar graph and scatter plot building up on dark blue UI screen
00:12
HD
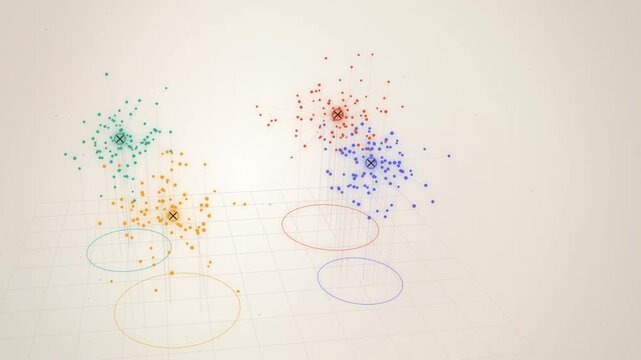
Colored data point clusters with centroids on beige 3D scatter plot
00:30
HD
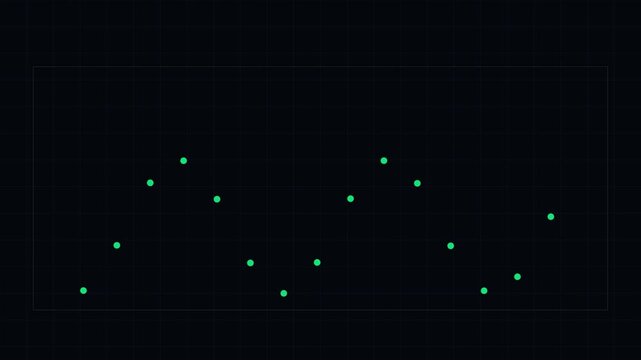
Abstract digital scatter plot with green data points on dark grid
00:24
HD
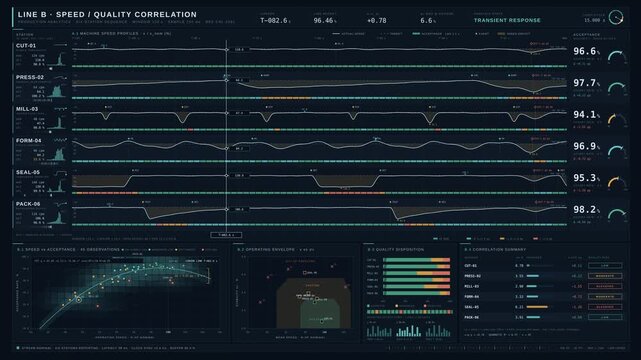
4K production line dashboard comparing machine speeds and quality acceptance rates with waveforms and scatter plots in dark blue interface for commercial creative technology and business use.
00:15
HD
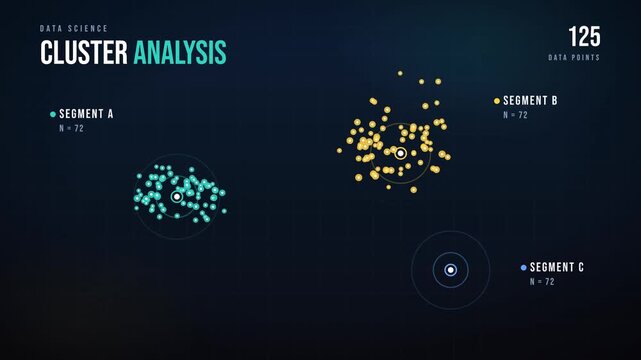
Scatter plot dots clustering into colored groups data visualization infographic
00:12
HD
Cyan Scatter Plot Data Distribution Animation
00:10
HD
Data Analysis: Residual Scatter Plot for Model Evaluation
00:05
HD
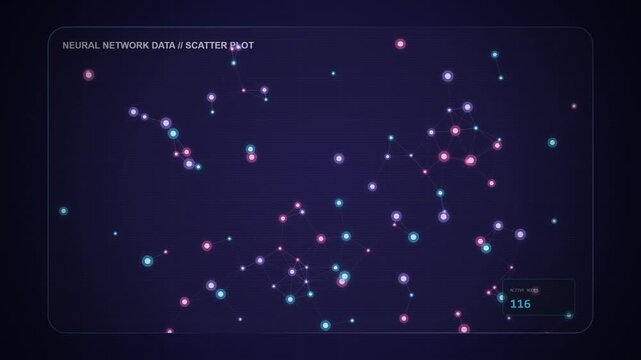
Glowing constellation scatter plot network animation seamless loop, glassmorphism data science and neural network background
00:15
HD
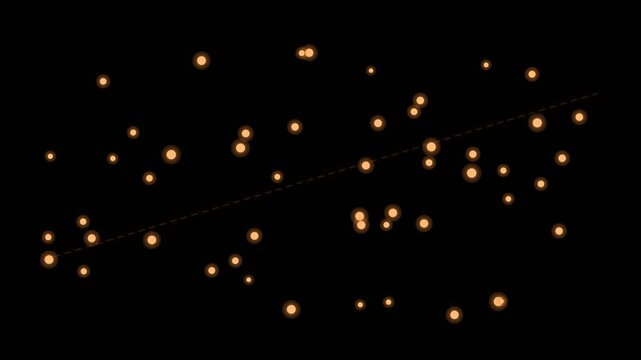
Scatter plot dots converging into trend line on black background
00:05
HD
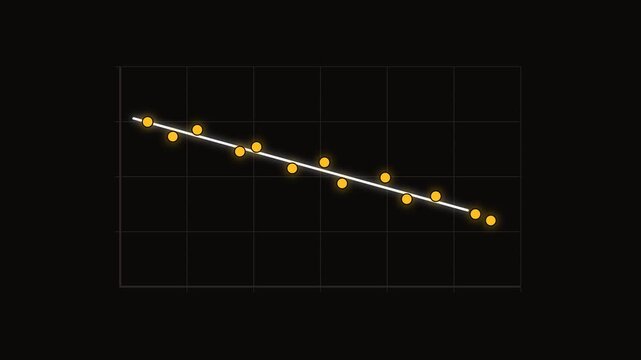
Amber scatter plot falling trend analysis animation dark
00:08
HD
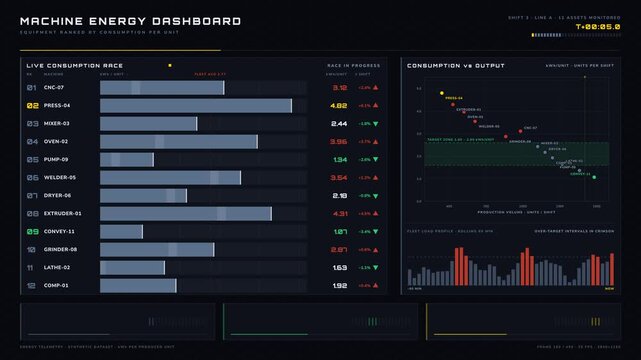
Dynamic machine energy dashboard showcasing equipment ranked by consumption per unit with animated bar chart and scatter plot for performance analysis.
00:15
HD
Data scatter plot chart with linear regression trend line animation for business analytics and financial growth analysis 4k
00:10
HD
Data regression analysis chart showing trend line fitting over scatter plot points for statistical modeling and financial forecasting
00:10
HD
Animated bar chart and scatter plot data visualization for business growth analysis and financial market trends animation 4k
00:10
HD
Abstract digital scatter plot on a dark background with curved lines
00:10
HD
Dot particle infographic morphs scatter plot into histogram, donut chart, funnel and world map dashboard
00:15
HD
A scatter plot showing data points distributed across a white background
00:10
HD
Bubble scatter plot migrating across business quadrants
00:10
HD
Research data analysis motion graphics, scatter plot with regression trend line and magnifying glass scanning data points, heatmap, histogram and progress rings, scientific statistics dashboard, text
00:12
HD
ESG Sustainable Finance Clean Tech Scatter Plot Growth Line Graph Loop L-Shape Copy Space
00:10
HD
scatter plot animated icon
00:06
HD
Minimalist abstract scatter plot graph with floating data points and labels
00:06
HD
Correlation analysis scatter plot chart animation dark ui
00:10
HD
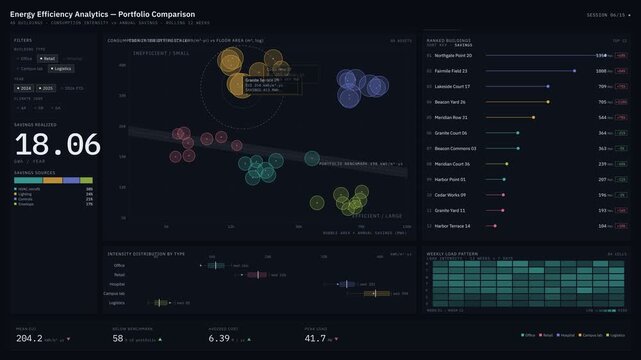
Energy efficiency analytics dashboard features a bubble scatter plot comparing building consumption intensity and savings, with interactive elements and dynamic visualizations.
00:15
HD
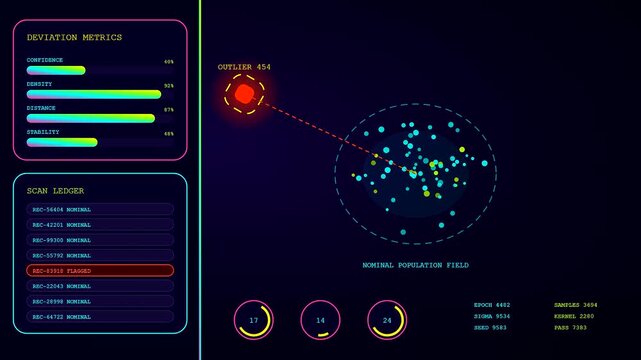
Anomaly detection interface displaying cluster data metrics with multiple graphical panels showing circular scatter plots and digital scan information on a dark glowing monitor screen
00:06
HD
Blue Scatter Plot Appear Animation Loop Background
00:10
HD
Black scatter plot with points forming clusters, data analysis visualization loop, transparent background
00:08
HD
Animated dot scatter plot forming data patterns. Digital particles visualizing big data.
00:10
HD
Abstract scatter plot data visualization with glowing neon dots on dark grid background
00:05
HD
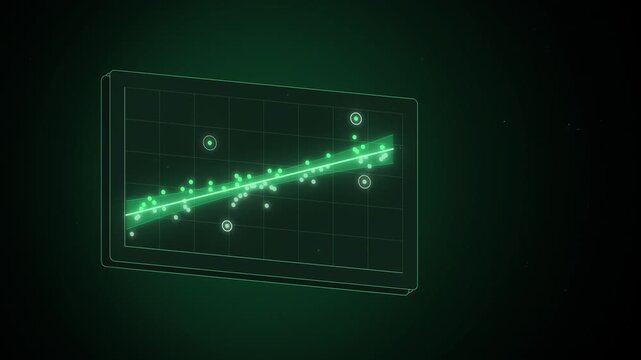
Tilted scatter plot with green data points trending up seamless loop
00:20
HD
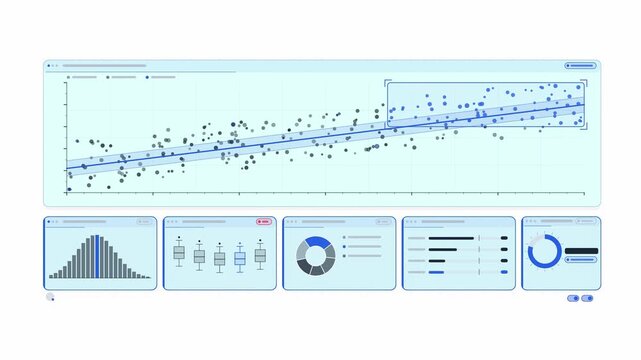
Clean animated scatter plot cloud finding in blue and cyan on a bright white background. Seamless looping 4K dashboard motion graphics with free space for text, ideal for business presentations, produ
00:07
HD
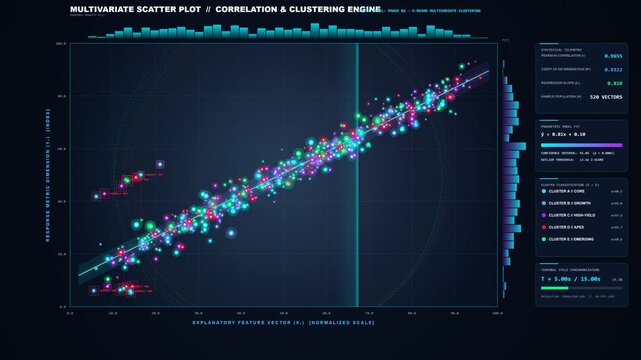
Multivariate scatter plot correlation and clustering engine analytical dashboard seamless loop animation
00:15
HD
Financial Risk Scatter Plot Animation
00:06
HD
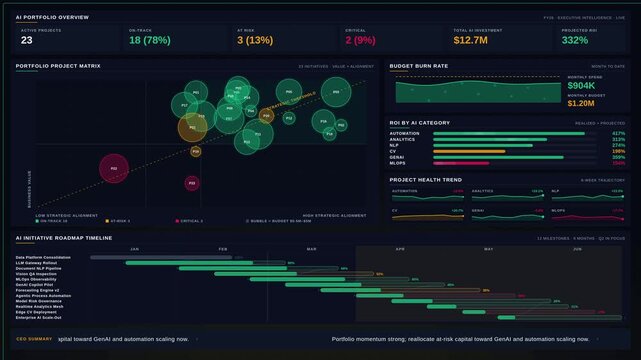
Premium 4K looping AI executive portfolio dashboard animation featuring KPI ticker, project scatter plot, budget burn rate, and roadmap timeline in dark luxury style.
00:15
HD
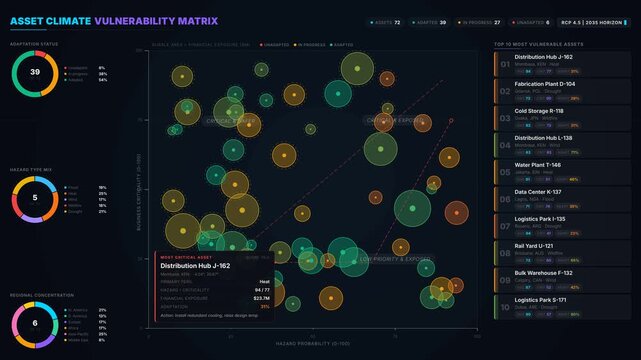
Animated 4K climate vulnerability dashboard featuring a dynamic bubble scatter plot matrix, risk frontier lines, and live data visualization panels on a dark background.
00:15
HD
A minimalist scatter plot showing data points on a dark background curve
00:10
HD
A scatter plot visualization displaying data correlation on a dark background
00:10
HD
Animated Scatter Plot Diagram With Teal Trend Line
00:08
HD
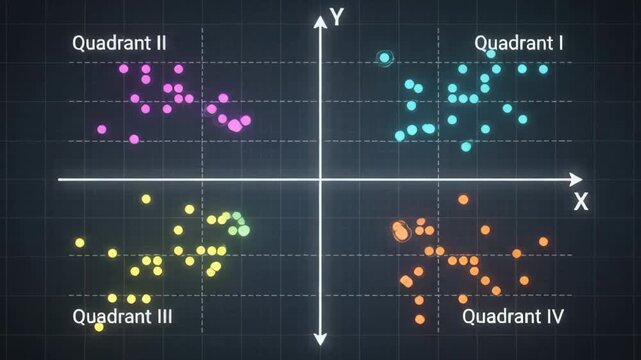
Colorful scatter plot graph illustrating mathematical Cartesian coordinate system with four distinct quadrants on a dark grid
00:09
HD
Digital interface displaying historical data analysis scatter plot
00:10
HD
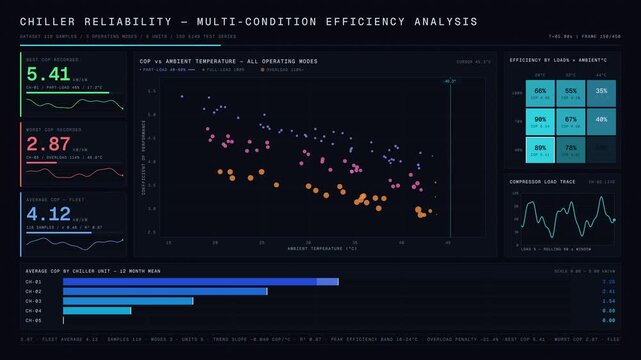
Analyze chiller reliability with an efficiency dashboard showcasing performance across operating conditions featuring interactive scatter plots and heatmaps.
00:15
HD
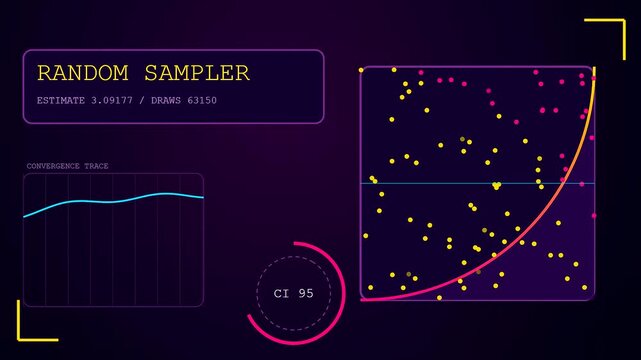
A digital probability modeling process shows growing scatter plot clusters and increasing point density across three distinct interface windows against a deep dark purple background
00:06
HD
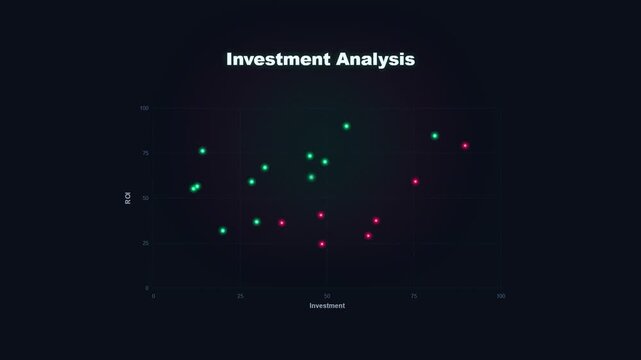
Investment analysis scatter plot chart animation dark ui
00:10
HD
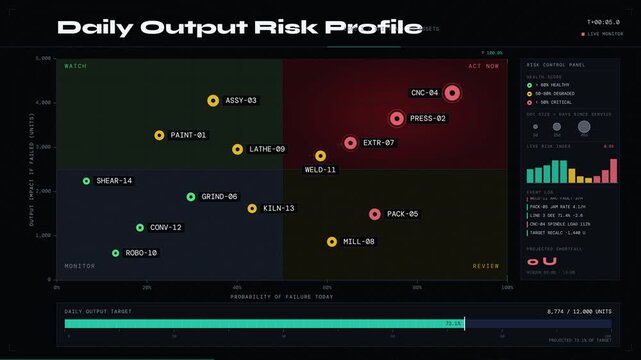
Visualize production risks with a dynamic dashboard showcasing machines threatening daily output targets through an animated scatter plot and color-coded health indicators.
00:15
HD
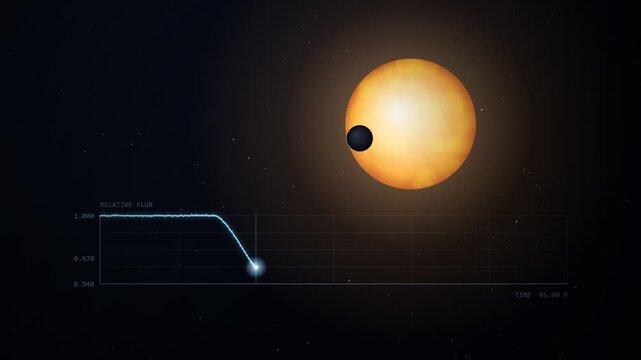
Exoplanet Transit Across Star With Light Curve Plotting Animation
00:15
HD
Purple Scatter Plot Data Distribution Animation
00:10
HD
Abstract digital scatter plot showing linear and vertical data trends
00:10
HD
A sophisticated dark-mode healthcare operations analytics dashboard visualizes comparative performance metrics across hospital departments with clear data visualization and animations.
00:15
HD
Data Science Notebook Code Execution DataFrame Bar Chart KMeans Clustering Model Training Loss Curve Seamless Loop
00:15
HD
Dynamic motion of a scatter plot with a trend line illustrating high correlation in animated data visualization.
00:10
HD
Abstract Scatter Plot Point Cloud Clustering Into Colored Groups Data Visualization Seamless Loop in bright teal tones
00:10
HD
Displaying audience demographics using a digital dashboard that features evolving scatter plot grids and real time vital heart rate metrics across three progressive viewing monitoring screens
00:06
HD
Financial Risk Scatter Plot Wave Cascade Animation
00:06
HD
Global Data Network Analytics Dashboard with Emerald Nodes and Animated Scatter Plot Charts
00:10
HD
Data Clusters Forming in Animated Scatter Plot Visualization
00:05
HD
Minimalist scatter plot graph with white dots on a solid black background
00:10
HD
Premium 4K dark mode cluster capacity dashboard animation visualizing CPU memory requests limits and headroom with animated data charts and KPI counters on indigo background.
00:15
HD
Animated Scatter Plot with Colorful Data Points
00:08
HD
Scattered data point cluster rotating within a 3D wireframe grid space
00:10
HD
Data Correlation Analysis and Multivariable Scatter Plot Clusters
00:10
HD
Scatter plot points converging to trend line animation
00:08
HD
2D Scatter Plot Data Visualization with Sequential Blue and Orange Points and Emerging Linear Trendline
00:05
HD
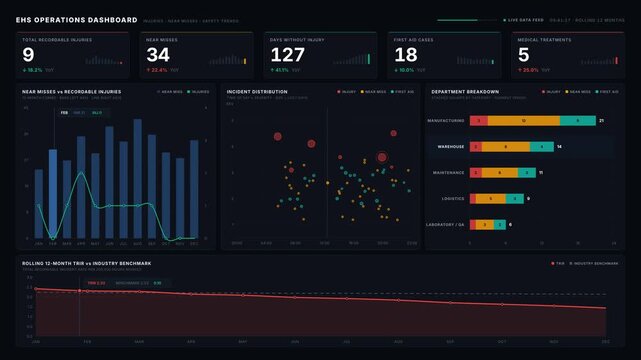
An engaging EHS operations dashboard showcasing injuries, near misses, and safety trends with animated metrics and charts in a dark mode interface for effective data visualization.
00:15
HD
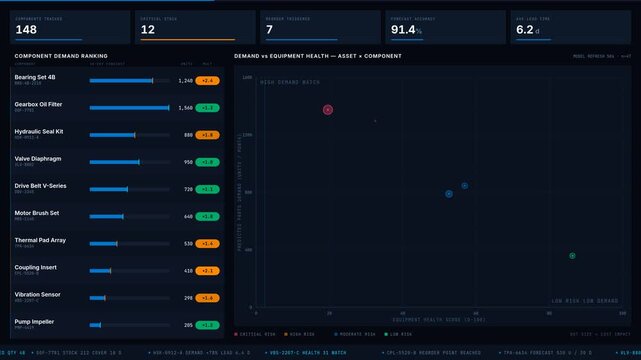
A dark-mode spare parts dashboard showcasing predicted component demand based on equipment health, featuring scatter plots and KPI metrics for effective inventory management.
00:15
HD
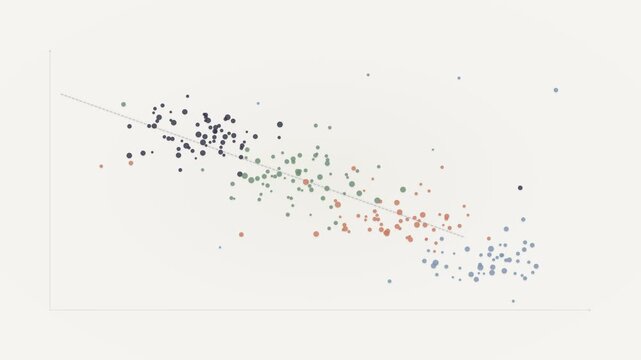
A scatter plot showing a negative correlation between two numerical variables
00:10
HD
Coral Scatter Plot Data Distribution Animation
00:10
HD
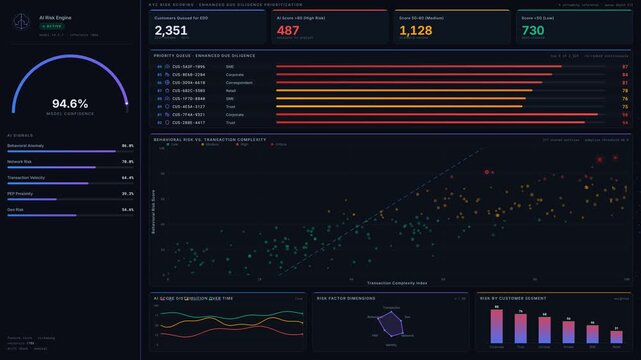
Explore a futuristic AI KYC risk scoring dashboard with enhanced due diligence prioritization, featuring dark mode aesthetics and dynamic data visualizations for financial insights.
00:15
HD
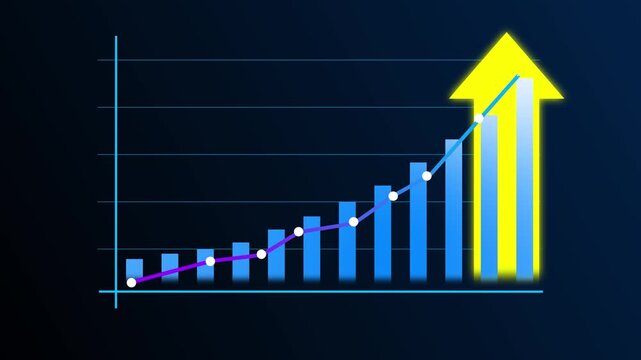
Animated growth bar chart with rising trend line and data points for financial success and business analytics presentations
00:16
HD
Advanced Comprehensive Data Visualization and Interactive Chart Design Framework with AI-Powered Analytics for Modern Enterprise Business Intelligence Reporting Systems Concept 4K video
00:10
HD
Purple point cloud with three centroids seamless loop on dark purple
00:30
HD
Abstract Scatter Plot Point Cloud Clustering Into Colored Groups Data Visualization Seamless Loop in cool slate tones
00:10
HD
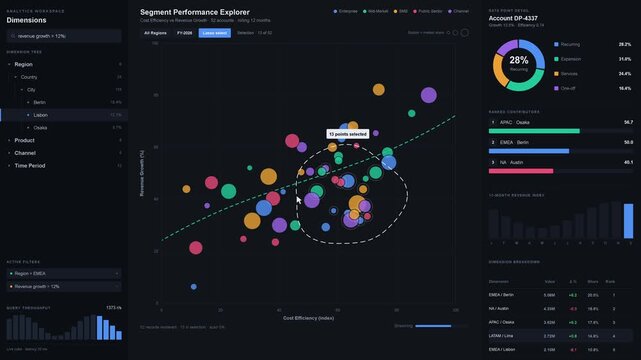
Explore a Business Intelligence Analytical Workspace showcasing a three-panel layout with a scatter plot, collapsible tree menu, and detailed data breakdown on a clean white background.
00:15
HD
Finance Risk Data Scatter Plot with Pulsing Radial Effects
00:06
HD
Abstract Business Data Visualization Animation of a Rising Dot Chart on a Dark Background. Minimalist Motion Graphics Showing Financial Growth, Success, and Statistical Analysis Trends.
00:10
HD
Scattered points collapsing onto a clean trend line, loop
00:10
HD
A scatter plot of blue data points against a dark background with a trend line
00:10
HD
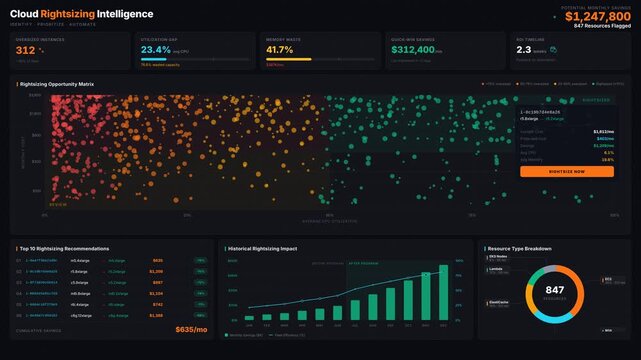
Premium 4K dark mode cloud rightsizing dashboard animation showing oversized resources, utilization gaps, and savings opportunities with dynamic charts and data.
00:15
HD
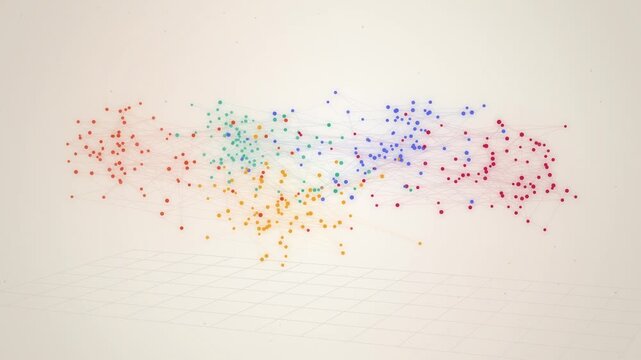
Embedding space scatter of colored data clusters on beige background
00:10
HD
A simple scatter plot illustrating data points with a trend line, labeled as 'Scatter Plot - Consumer Analysis,' signifying statistical correlation.
00:05
HD
Abstract Data Visualization Scatter Plot with Trend Line and Projections
00:08
HD
Dynamic Growth Curve Ascending Graph Animation Showing Data Progression Over Time In A Dark Blue Digital Background
00:20
HD
Holographic analytics platform panel with a heatmap scatter plot and gauges over purple bokeh
00:22
HD
Advanced Data Science Machine Learning Dashboard with Neural Networks and Clustering
00:15
HD
A modern dark-mode repair operations dashboard showcasing technician response metrics and equipment recovery performance with colorful KPI cards and a scatter plot layout.
00:15
HD
Data analytics scatter plot with trend line: financial growth and statistical analysis visualization animation 4k
00:10
HD
Orang Scatter Plot Appear Animation Loop Background
00:10
HD
Animated Scatter Plot Showing Data Points Forming a Downward Curve on a Graph.
00:12
HD
Animated scatter plot with a trend line with alpha channel
00:10
HD
A computer screen displaying a vibrant and lively pattern of colors, creating a visually captivating display, A scatter plot showing risk vs return for various investments
00:10
HD
A dynamic video showcasing a scatter plot of multicolored data points on a white background, with camera zooming out to reveal intricate patterns. Data clusters and disperses, illustrating variability
00:10
HD
Abstract Scatter Plot Point Cloud Clustering Into Colored Groups Data Visualization Seamless Loop in rich blue tones
00:10
HD
Animated data visualization with glowing orange and blue spheres moving in a dynamic scatter plot, symbolizing analytics, research, and technological trends, for digital presentations.
00:08
HD
Financial Risk Scatter Plot Progressive Reveal
00:06
HD
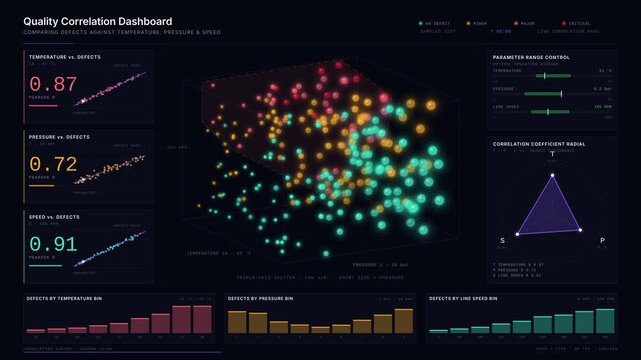
Explore a comprehensive Quality Correlation Dashboard showcasing defects against temperature, pressure, and speed with stunning 3D scatter plots and vibrant color coding.
00:15
HD
scatter plot animated icon
00:06
HD
Minimalist scatter plot graph showing a downward data trend on black background
00:10
HD
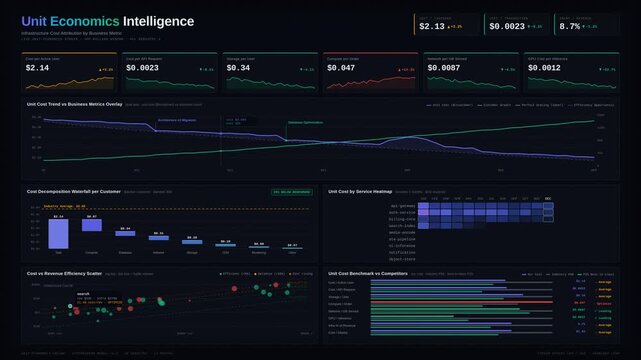
Premium dark mode unit cost analytics dashboard showing infrastructure expenses per customer and transaction with dynamic charts in 4K for commercial creative technology and business use.
00:15
HD