Foi enviada uma ligação para definir a sua palavra-passe para: Irá necessitar de uma palavra-passe para aceder às suas compras futuramente.
Obtenha 3 vídeos ou 25 imagens com uma avaliação gratuita
Novos filtros adicionados
Ordenar por

19 768 resultados para increase and decrease em vídeos

A modern business setting showcasing a smartphone displaying a glowing digital earth, symbolizing commitment to net zero and sustainability through technology and innovation. Qubit
00:12
HD
Laptop Screen Displays Financial Market Data Charts and Graphs
00:10
HD
Warning Symbol with Upward Arrows Representing Growth and Increasing Trend.
00:07
HD
Abstract 3D number 1963 text animation floating against a deep black void offering a vibrant and modern visual for the year with a sense of digital energy. 4k motion video.
00:10
HD
Malta Oil Price Falling with Oil Barrels Downward Green Arrow and 3D Financial Data Visualization Graphs for Economy and Business Concept
00:11
HD
Zoom in and out animation the club symbol. Large black symbol in the center and four small symbols around. Seamless looped 4k animation on white background
00:12
HD
Financial data white icons animation. Animated line growth and decrease diagrams. Financial report. Loop HD video with alpha channel, transparent background. Motion graphic design for night mode
00:18
HD
Gluteus maximus, muscle strength, body fitness. Physical health. Muscles expand during exercise. Fitness regime maintains muscle tone. Healthy lifestyle enhances body performance.
00:10
HD
Taiwan economic bar chart graph showing decreasing downturn with national Flag 3D animation on black background.
00:16
HD
HUD particle and elememt three graph radar pointer with percent text and radar reletion with scale bar on the black screen
00:14
HD
Screen Brightness Increase and Decrease Animation.
00:07
HD
Animated Percentage Symbol Reveal on a Transparent Background for Statistical Presentation
00:06
HD
Stock market data analysis with financial price chart showing trends
00:10
HD
Colleagues tapping tablet and comparing floating financial figures while monitoring market trend
00:13
HD
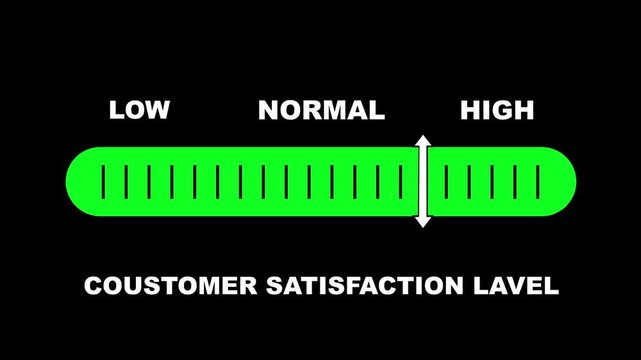
Customer satisfaction level indicator scale. Low normal & high meter infographic animation on black background. Showing high level color gauge indicator for business service quality and experience.
00:10
HD
Business graph growth concept in allusive graph chart showing marketing sales profit decreasing to future target. Downfall financial status of corporate business going down.
00:20
HD
Animated bar graph chart data business finance growth success statistics minimalist black white abstract motion graphics presentation template financial report infographic visualization economic.
00:08
HD
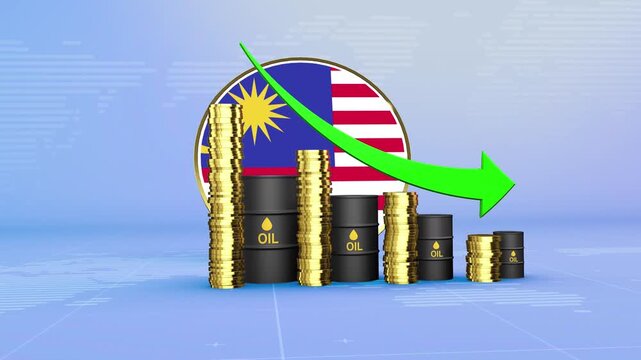
Malaysia Oil Prices Decline with Oil Barrels, Gold Coins and Downward Green Arrow, 3D Economic and Financial Market Concept
00:11
HD
Vitamin E Level Text or Word Low and Medium to High Meter Concept Animation. ideal for concepts related to vitamin E deficiency, nutrition and bone health. 4k video.
00:10
HD
the phrase Business with AI in Spanish, animated word by word with spacing reduction and sharp zoom transitions, available in four background and outline versions.
00:12
HD
AI supports net zero goals via virtual assistant insights, AI-based green strategies, and artificial intelligence for climate-aware business planning. Kernel
00:13
HD
Businessman Touching Virtual Downward Arrow Representing Financial Loss, Economic Crisis and Risk Management in Corporate Strategy, Video
00:05
HD
Animation of Progress Bar With Percentage Increase/Decrease.
00:20
HD
White Vertical Double- Ended Arrow on a Black Background down direction
00:06
HD
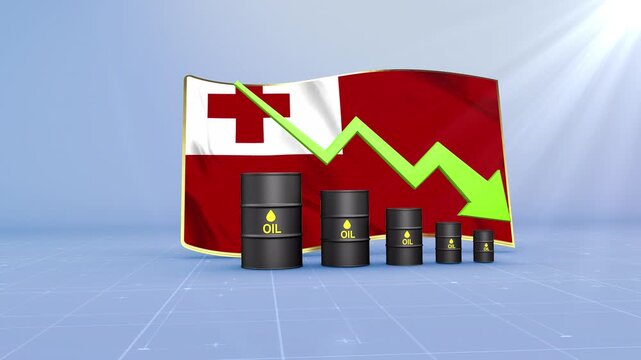
Tonga Oil Price Falling with Oil Barrels Downward Green Arrow and 3D Financial Data Visualization Graphs for Economy and Business Concept
00:11
HD
Man holding smartphone displaying a financial graph with downward trend and percentages shown
00:10
HD
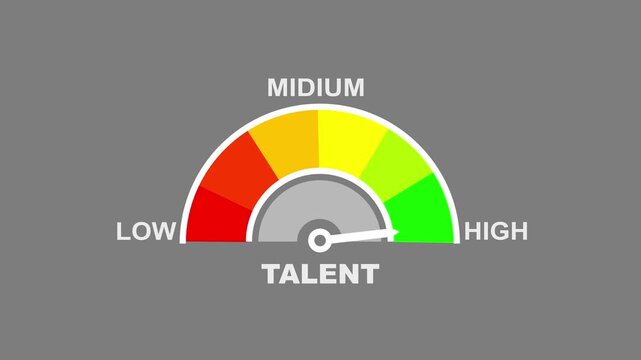
A colorful gauge talent levels from low to with a needle pointing towards medium on a black background. talent level text or word low and medium to high meter concept.
00:10
HD
Golden wheat sways gently in the breeze under a warm sun, with a slow pan across the field, creating a cinematic, serene agricultural scene ideal for nature and farming themes.
00:10
HD
Sales Growth Gauge Meter Indicating Normal Level on White Background indicator measurement
00:10
HD
Hand Drawn Profit Growth Graph Animation with Business Finance Chart and Coin Icons
00:16
HD
Business cost reduction strategy concept. Person typing keyboard with finance and analytics icons, cost optimization, operational efficiency and profit improvement.
00:15
HD
Stock Market Data Abstract Representation With Glowing Blue Red and Green Trends on a Dark Background
00:05
HD
Green pixel block dissolving with particles and red bar declining. Data visualization of asset reduction and value decrease for business.
00:08
HD
male office worker writing on notebook at office desk, overlaying animated financial line charts
00:16
HD
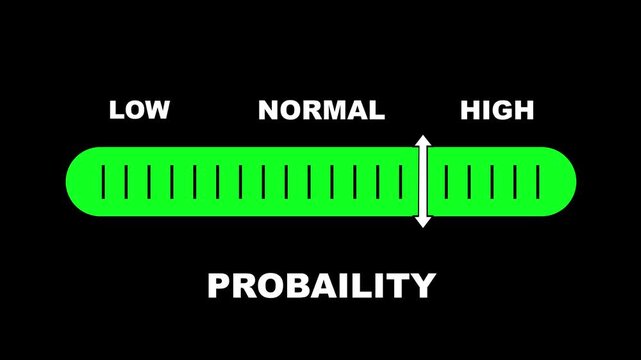
Probability level indicator scale. Low Normal High meter infographic animation on black background. Animation showing high probability level color gauge indicator for statistical analysis and outcome.
00:10
HD
Red neon glowing economic downturn chart. Falling stock market graph. Financial crisis and decline business concept footage.
00:05
HD
Businessman reducing a high-risk graph to a safe level with a gesture
00:10
HD
1Mongolia Oil Prices Decline with Oil Barrels, Gold Coins and Downward Green Arrow, 3D Economic and Financial Market Concept
00:11
HD
Green recycling symbol on fertile soil during sunset in a cultivated field, representing sustainability, waste reduction, environmental care, and agricultural eco-practices with copy space
00:10
HD
Three-word text animation featuring Feel The Power with sequential word reveal, spacing reduction effect, and zoom transition in 3840x2160 format.
00:12
HD
Net zero goals and CO2 reduction strategy driving sustainability, green energy integration, net zero emissions policies, and climate-friendly sustainability solutions for business and society. Muxer
00:15
HD
Abstract 3D number 1945 text animation floating against a deep black void offering a vibrant and modern visual for the year with a sense of digital energy. 4k motion video.
00:10
HD
wood block of percentage change to UP and Down arrow with piggy. Interest rate, GDP, stocks market, financial, deflation and Inflation, ranking, mortgage, debt, Loan and Economic Recession
00:08
HD
Increasing brightness bar animation, Brightness level slider animation for light intensity adjustment.
00:10
HD
Congo Republic Oil Price Falling with Oil Barrels Downward Green Arrow and 3D Financial Data Visualization Graphs for Economy and Business Concept
00:11
HD
CO2 reduce.Net Zero 2050.Green energy zero emission carbon co2 reduction graph charts,business virtual touch screen to show alternative energy growth.4k video.Place for text or logo
00:15
HD
White Percentage Symbol Icon with Horizontal Arrows on Black Background discount sale
00:10
HD
Business executives collaborating on environmental sustainability strategy utilizing renewable energy solutions to achieve net zero targets in corporate meeting.
00:14
HD
A business graph up to a down blue arrow with an animated. Animation of a blue arrow chart graph on a black background with a grid. Video footage
00:10
HD
Neon glowing regression meter showing big risk levels. Dangerously increasing values of regression, critical overload. Too much, off the charts. Abstract meter scale with arrow. Business concept.
00:10
HD
financial team discuss and exchange stock market performance data and charts
00:07
HD
4K Stop motion of close-up stack overload document report paper with paperclip place increase on green background, business and education concept footage paperless used.
00:06
HD
Neon line Percentage icon Quality control growth graph and cost reduction animation. Percentage quality with up arrow, cost with down arrow.
00:10
HD
Arrow continuous line 4K animation video showing downward direction on a minimal background
00:10
HD
Life expectancy level indicator scale. Low Normal High meter infographic animation on black background. Animation showing high life expectancy level color gauge indicator for health and longevity.
00:10
HD
graph chart up down business statistics
00:12
HD
difficulty level indicator scale. Low normal & high meter infographic animation. Showing high difficulty level color gauge indicator. on a white background 4k animation video
00:10
HD
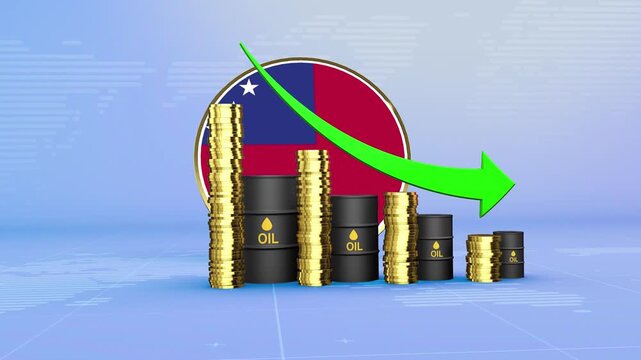
Samoa Oil Prices Decline with Oil Barrels, Gold Coins and Downward Green Arrow, 3D Economic and Financial Market Concept
00:11
HD
Six point one percent 3D sign of glossy little marbles isolated over white background
00:10
HD
Video with the phrase Optimize Your Campaigns in Spanish, animated word by word with letter spacing reduction and sharp zoom transitions, delivered in four background and outline versions.
00:12
HD
A visual representation of hands uniting, symbolizing the collaborative effort needed to achieve carbon neutrality by 2050. The image emphasizes teamwork and environmental responsibility. Raster
00:15
HD
server status level indicator scale. Low normal high meter infographic animation on black background. Showing high pressure level color gauge indicator.4k animation video
00:10
HD
Response level indicator scale. Low normal & high meter infographic animation on black background. Showing high response level color gauge indicator for customer service and communication analysis.
00:10
HD
Falling red bar graph showing financial decline on dark digital background, business analytics and data loss visualization
00:06
HD
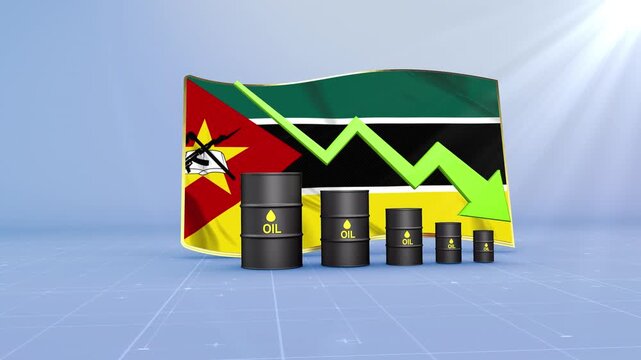
Mozambique Oil Price Falling with Oil Barrels Downward Green Arrow and 3D Financial Data Visualization Graphs for Economy and Business Concept
00:11
HD
Vibrant Data Visualization Stock Market Analysis and Trading Platform Interface
00:10
HD
Abstract dollar sign icon and up arrow animation on a black background. Upward arrow and dollar icon. High pricing icon. profit, investment, growth business, economy, finance and success concept
00:10
HD
Black color arrow rising transparent channel. Abstract arrow growth chart of economy icon black color animated down to up arrow animation, on a white background, direction animation,with video
00:05
HD
Green dollar bill with a downward arrow, symbolizing financial decline. Suitable for finance, economy, recession, and moneysaving concepts.
00:06
HD
Directional neon arrow icon animation.
00:08
HD
A bar graph with red and green bars arranged in a rising and falling pattern on a neutral background
00:08
HD
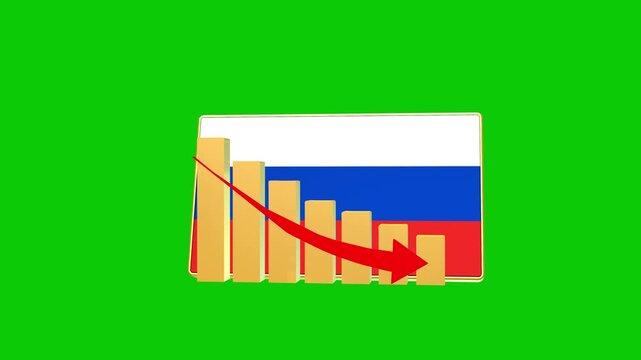
Russia economic bar chart graph showing decreasing downturn with national Flag 3D animation on black background.
00:16
HD
Financial Growth Graph Animation Featuring Increasing Business Performance Bars
00:07
HD
Screen Brightness Increase and Decrease Animation.
00:07
HD
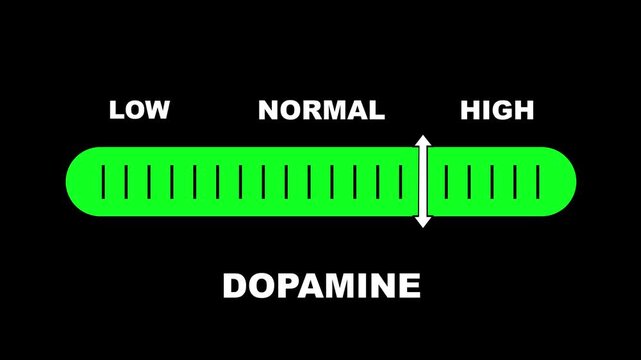
Dopamine level indicator scale. Low normal & high meter infographic animation on black background. Showing high dopamine level color gauge indicator for brain neurotransmitter mental health.
00:10
HD
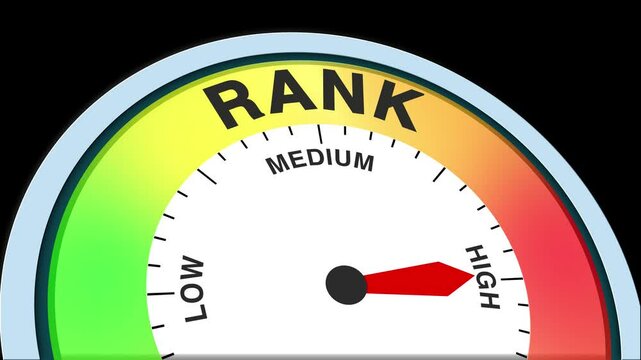
Rank Level Text or Word Low and Medium to High Meter Concept Animation on Black Background and Blue Screen
00:58
HD
A hand-drawn red arrow pointing upwards with a gritty, brush-stroke texture on a black background
00:09
HD
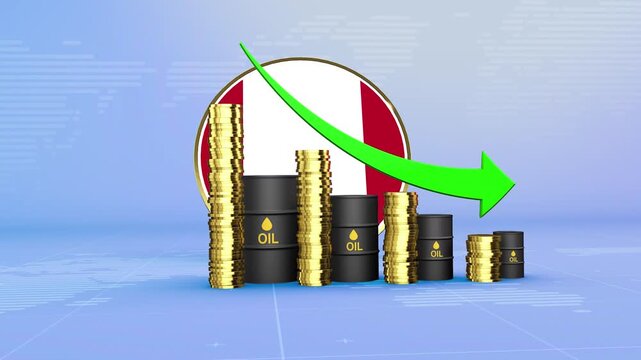
Peru Oil Prices Decline with Oil Barrels, Gold Coins and Downward Green Arrow, 3D Economic and Financial Market Concept
00:11
HD
Bar chart with red arrow showing rapid economic decline
00:15
HD
Zoom in and out animation the server symbol. Large black symbol in the center and four small symbols around. Seamless looped 4k animation on white background
00:12
HD
A business professional engages with a modern keyboard displaying digital graphs and icons. This scene emphasizes cost reduction and strategic financial management in the corporate world. Qubit
00:12
HD
neon direction arrow icon animated video
00:07
HD
Dynamic Financial Growth and Fluctuations
00:26
HD
The man turns the regulator of the thermostatic valve of the radiator to the middle position to set the economical mode of heating the room. Heating of the apartment in the cold season.
00:10
HD
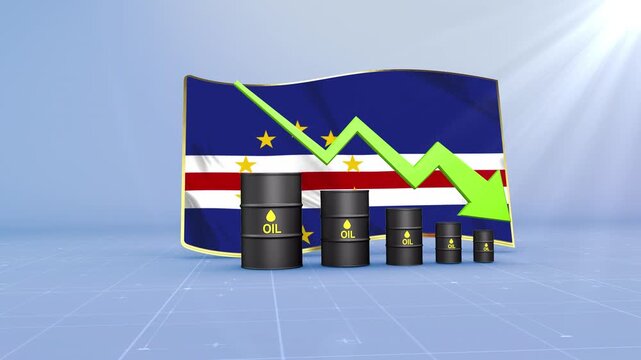
Cape Verde Crude Oil Price Drop with Oil Barrels Downward Green Arrow and 3D Financial Data Visualization Graphs for Economy and Business Concept
00:11
HD
Increase economic graph. 3D circle Bar Chart 1.(included alpha)
00:09
HD
business financial loss percentage chart
00:15
HD
Business executives collaborating on environmental sustainability strategy utilizing renewable energy solutions to achieve net zero targets in corporate meeting.
00:13
HD
Red chart background effect. Candles of the stock market, price falls. Falling prices of securities. Loss of assets in equities stock. Decreasing trend showing unsuccessful performance and losses fail
00:12
HD
Globe Glass with Net zero icons In Green Forest.Circular economy concept for future business growth and environmental sustainability and reduce pollution for future business and environmental growth..
00:12
HD
Time lapse of raising and decreasing stack of coins against white background
00:05
HD
Three word kinetic typography sequence displaying Scale Your Business with sequential letter spacing reduction and sharp zoom transition
00:12
HD
Animated market share meter showing movement from high level to low level, ideal for illustrating declining business dominance, reduced competitive edge, and sales performance drop
00:10
HD
Seven point five percent - the sign made of colorful 3D marbles isolated on white background
00:10
HD
Probability level indicator scale. Low Normal High meter infographic animation on black background. Animation showing high probability level color gauge indicator for statistical analysis and outcome.
00:10
HD
glowing neon Percentage growth and decline icon with up and down arrows. financial, business, and statistical analysis. Up and down percentage arrows icon. Perfect for reports and dashboards 4k.
00:10
HD
Arrow going down tradingtone, animated in neon light
00:10
HD
Mexico Oil Prices Decline with Oil Barrels, Gold Coins and Downward Green Arrow, 3D Economic and Financial Market Concept
00:11
HD
Green Neon Outline of Bar Chart with Upward Trend and Downward Arrow on Black Background graph statistics
00:10
HD
Abstract financial chart with upward trend line and bar graph data background
00:10
HD