Foi enviada uma ligação para definir a sua palavra-passe para: Irá necessitar de uma palavra-passe para aceder às suas compras futuramente.
Obtenha 3 vídeos ou 25 imagens com uma avaliação gratuita
Novos filtros adicionados
Ordenar por

19 768 resultados para increase and decrease em vídeos

Financial Report Presentation Animation with Business Growth Visualization
00:10
HD
Slovenia Oil Prices Decline with Oil Barrels, Gold Coins and Downward Green Arrow, 3D Economic and Financial Market Concept
00:11
HD
Business grow-ting arrow. Rising bar follow the arrow. Abstract neon arrow growth , success concept. Profit growing icon animation.
00:10
HD
Asian business team discussion reusable product in office,start up eco-friendly business,environmental protection,sustainable business model,ESG strategy,team meeting,people work at home concept
00:13
HD
Balance amount decreasing from 10000 to 0 dollars on black background.Decreasing Amount Animation.4k video animated.
00:10
HD
Neon line Percentage icon Quality control growth graph and cost reduction animation. Percentage quality with up arrow, cost with down arrow.
00:10
HD
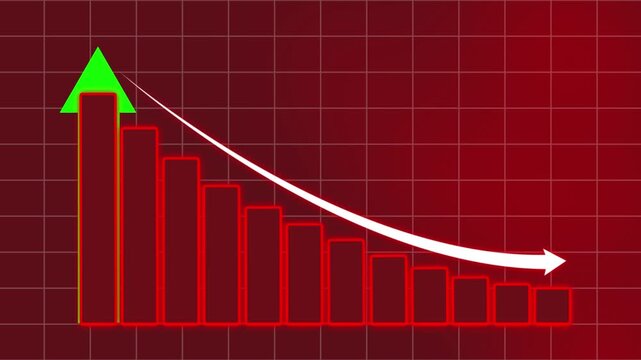
Glowing red bar chart and downward arrow illustrating business decline, financial loss and economic downturn. Concept of recession, falling profits, market crash and negative growth performance
00:12
HD
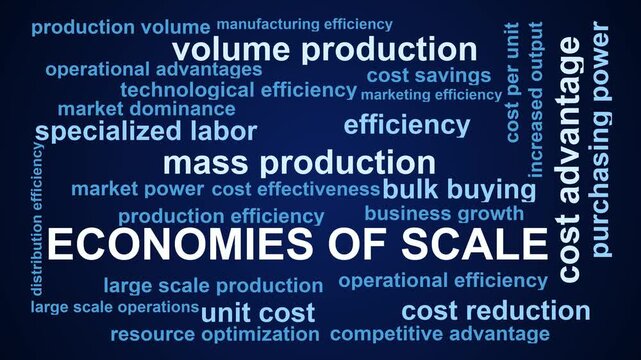
Economies Of Scale Word Cloud
00:11
HD
25% Pie Chart Animation on black screen. percentage pie chart animated.  25% business infographic pie chart icon. infographic donut chart, Infographic Video, loading bar, progress bar, 25% pie char.
00:10
HD
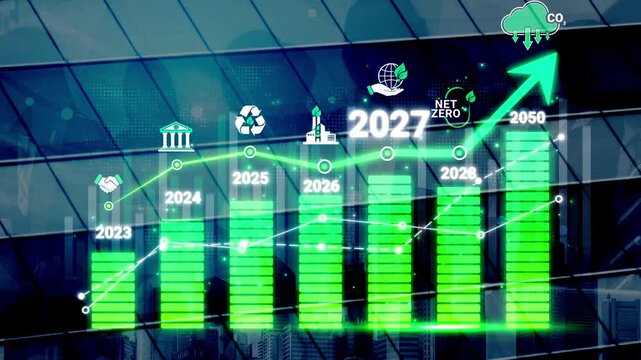
Sustainable Development Goals Progress Chart with Future Projections for Net Zero Emissions and Environmental Awareness by 2050 Sigmoid
00:10
HD
Arrow continuous line 4K animation video showing downward direction on a minimal background
00:10
HD
Mesmerizing animated market trends with dynamic charts and bars showcasing cryptocurrency and finance, highlighting profits and losses, increases and decreases.
00:15
HD
A bar chart representing daily stock price movements for a specific company over the past week, each bar changing color on whether stock price went up or down, 4K High-Quality Animation Video
00:16
HD
Financial overlay appearing triggers percentage values climbing over turbines showing market growth
00:10
HD
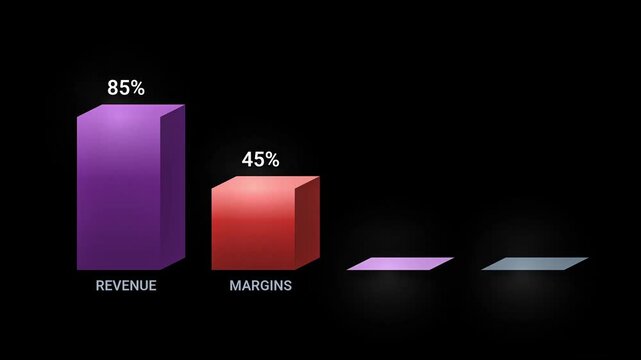
animated bar chart showing changes in revenue, margins, equity and assets
00:15
HD
Stock market data visualization with candle chart and bar graph analytics
00:07
HD
Bright white 3D number 2007 text animation floating against a deep black void offering a vibrant and modern visual for the year with a sense of digital energy.
00:10
HD
Bitcoin and Coin Bar Chart Analysis, Bitcoin and dollar analyst data trending, Simple and minimalist flat 2d Animation
00:10
HD
Abstract digital visualization of data points and audio waveforms, displayed in vibrant pink and red hues
00:10
HD
Abstract Background Illustration Representing the Concept of Bar Graph
00:10
HD
Dynamic sale bubbles with percentage discounts float across a vibrant green background, signaling exciting price reductions and shopping opportunities.
00:05
HD
Serbia Oil Prices Decline with Oil Barrels, Gold Coins and Downward Green Arrow, 3D Economic and Financial Market Concept
00:11
HD
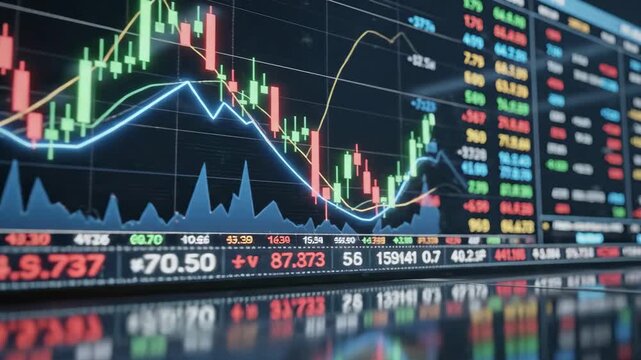
Financial Stock Market Data Display - This video displays financial stock market data with fluctuating figures and trends.
00:08
HD
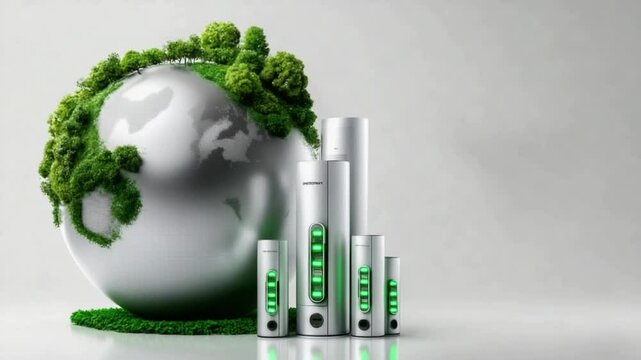
Showcasing innovative technology that promotes sustainability, this display features sleek designs alongside a globe adorned with greenery, highlighting eco-conscious practices and solutions
00:04
HD
Yellow Bar Chart Illustrating a Decreasing Trend on a Grid Background graph data. Abstract digital graph with neon yellow bars decreasing across grid forming dynamic data visualization.
00:09
HD
animated video a graphic of increasing, decreasing, and stable
00:04
HD
Business Growth Graph Going down. Alpha Channel Transparent Background.
00:05
HD
Community Impact Word Cloud
00:11
HD
Global Stock Market Crash Visualization: Animated World Globe with Real-Time Stock Data, Economic Downturn Analysis
00:08
HD
A businessman engages with virtual reality technology in an office setting, highlighting concepts related to carbon emissions and sustainability initiatives, symbolizing innovation. Raster
00:15
HD
ircular economy concept for future business growth and environmental sustainability and reduce pollution for future business and environmental growth .4k corporate video.
00:15
HD
Red and blue financial stock market chart with downward trend, trading data, bokeh lights, investment and economic analysis, finance concept.
00:05
HD
Gold bar price fluctuations on digital graph
00:05
HD
Zoom in and out animation the lotus symbol. Large black symbol in the center and four small symbols around. Seamless looped 4k animation on white background
00:12
HD
A microfinance office word sign displayed on a commercial building under a clear blue sky, symbolizing financial inclusion, small loans, and economic empowerment
00:20
HD
Neon Line Graph Arrow Downwards Against Black .Abstract neon line arrow down business graph.4k video.
00:13
HD
Bright white 3D number 2010 text animation floating against a deep black void offering a vibrant and modern visual for the year with a sense of digital energy.
00:10
HD
Financial Market Data Analysis Showing Declining Trends and Statistics on a Digital Screen with Red Chart Lines Indicating Downward Movement in Economy
00:08
HD
Logistics cost management drives business efficiency by reducing expenses and optimizing operations for maximum cost reduction
00:05
HD
Animated bar chart with falling trend line and downward arrow on clean background, representing financial loss, market decline, negative growth, and business downturn.
00:10
HD
Declining Graph Trends Data Analysis
00:10
HD
Pakistan Oil Prices Decline with Oil Barrels, Gold Coins and Downward Green Arrow, 3D Economic and Financial Market Concept
00:11
HD
Three word kinetic typography sequence displaying Grow Your Audience with sequential letter spacing reduction and sharp zoom transition
00:12
HD
Quality control and company cost reduction. Cost and quality control concept. Successful organization strategy and management.
00:10
HD
Blue and Green Arrows Moving Up and Down Over Grid - Animation Loop. Logistics and Transportation Technology Abstract Background. Animated concept depicting growth and crash mechanics in stock market.
00:08
HD
Kosovo Country Flag and Bar Chart Graph Showing Decreasing Values a Red Arrow Economic Crisis Concept
00:11
HD
Man listening to music on headphones
00:11
HD
Pressure Regulator Word Cloud
00:11
HD
A diverse group discusses data on a screen, with energy impact stats and remote participant feeds
00:08
HD
A robotic hand points towards a digital representation of a cost percentage and a data graph, illustrating the intersection of technology and financial analysis in a corporate environment. Synapse
00:13
HD
A hand holding a stylus interacts with a tablet displaying a line graph with green and red lines on a dark background
00:07
HD
Data Optimization Workflow: Transforming Business Losses to Financial Growth and Profit
00:07
HD
Stock market analysis charts and graphs showing trends in financial data representation visuals
00:05
HD
Zoom in and out animation the four arrows symbol. Large black symbol in the center and four small symbols around. Seamless looped 4k animation on white background
00:12
HD
Stack Coins with Financial Charts Growth Numbers Business Money Market Analysis Display
00:10
HD
Business line arrow improvement business strategy arrow rising up business growth arrow and graph chart, abstract business graph chart business decline trend icon animation black ... See More
00:10
HD
Neon line business graph icon featuring a glowing chart with a downward arrow, symbolizing decline, loss, market drop, risk, or negative growth.
00:10
HD
Upward Trending Stock Market Graph with Green Growth Arrow and $5,000 Profit Gain, Financial Investment Success and Business Revenue Growth Concept 2D Illustration
00:06
HD
Dynamic Growth and Decline Bar Graph Animation
00:22
HD
Bar Chart: A dynamic and eye-catching bar chart with a gradient of vibrant neon colors illustrates data growth and progress on a reflective surface,
00:10
HD
Business graph crash down with red arrow. Motion graphics of down business arrow with transparent background .
00:10
HD
Business crisis line chart animation with downward arrow loop on black background...
00:13
HD
Three word kinetic typography sequence displaying Engage Followers Now with sequential letter spacing reduction and sharp zoom transition
00:12
HD
Alertness Level Gauge Increasing and Decreasing Indicating Focus and Awareness 2D Motion Graphic
00:19
HD
Business leaders discuss implement environmental sustainability strategies net zero carbon goals corporate responsibility using ESG reports data at meeting
00:13
HD
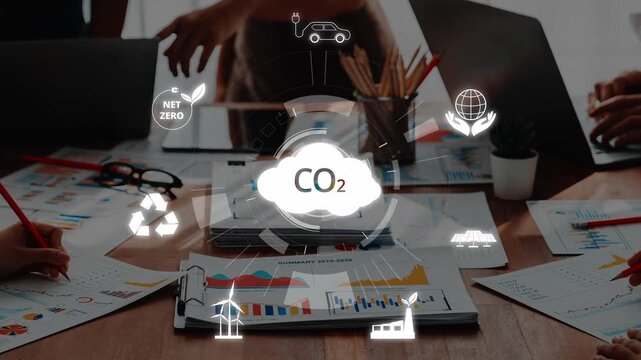
Net zero  2050. Carbon neutral concept. Net zero greenhouse gas emissions target. Climate neutral long term strategy.Growth chart with net zero icons. No toxic gase. 4k video
00:10
HD
A glowing lightbulb with a tree inside symbolizing environmental sustainability and carbon reduction
00:08
HD
Business carbon credit. CO2 symbol green leaf above stack of gold coins representing environmental finance and sustainable investment concept with carbon emission reduction
00:05
HD
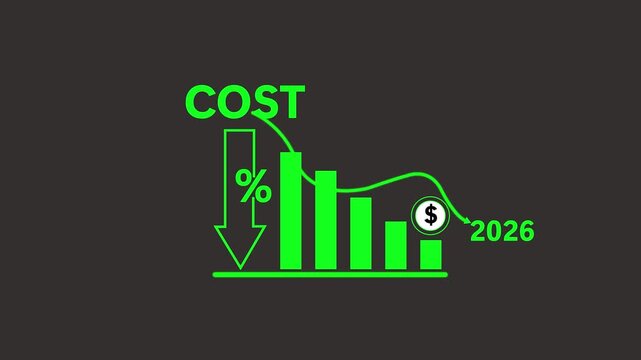
Cost reduction and cost saving through digital transformation, business cost and 2026 optimization, operational cost reduction, financial saving, and resource efficiency 4k video animation.
00:06
HD
A dynamic business meeting showcasing teamwork and analysis focused on sustainable practices and carbon neutrality in a modern office setting. Raster
00:12
HD
Financial management concept cost reduction strategies, budgeting, and optimizing financial processes for improved profit and resource allocation
00:17
HD
Concept of carbon credit for lowering carbon emissions goals for investment in sustainable businesses.
00:10
HD
downward trend chart with tall vertical arrows symbolizing economic loss, financial crisis, market downturn, poor performance, decreasing growth, business decline, unstable conditions.
00:10
HD
Zoom in and out animation the pie chart symbol. Large black symbol in the center and four small symbols around. Seamless looped 4k animation on white background
00:12
HD
Red colorful downward trend arrow graph on black background symbolizing representing financial and market loss, market decline, business decrease, economic crisis, and negative growth concept.
00:06
HD
Close-up of a digital screen displaying a blue linear financial stock market graph with a blurred dark background
00:16
HD
Neon glowing medical thermometer icon animation. That's indicates weather temperature 80 degree increase or decline. Thermometer equipment showing hot or cold weather.
00:10
HD
Digital Volume Control Slider Animation - System Volume Adjusting
00:10
HD
Exploring percentage symbols in various arrangements and movements
00:08
HD
sound volume icon level up down sound control
00:15
HD
Closeup stock market display showing fluctuating numbers and lines representing market trends
00:08
HD
A before and after image of a greenhouse with manual shading versus one with automated shading showcasing the increased crop yield and reduced labor costs with the automated system.
00:07
HD
A hand gently cradles a small, vibrant green sapling emerging from rich, dark soil, symbolizing growth and environmental sustainability
00:10
HD
Location-pin popping over almond, icons growing then fading over nut bowl showing engagement
00:12
HD
Business Growth Chart with Icons Representing Services and Communication graph line
00:10
HD
The Inflation Sign in Sky
00:10
HD
Animated line chart. Line business graph growth concept animate on black background. 4k
00:05
HD
Colorful 3D Bar Chart with Rounded Bars on a Purple Base Against Black Background graph statistic
00:05
HD
The animated golden chart showcases a strong upward trend for market investment and increased sales. The transaction analysis suggests positive growth in financial activities
00:10
HD
A business professional engages with a laptop, exploring innovative green energy solutions and illustrated CO2 emissions concepts in a modern, digital setting. Cipher
00:10
HD
Bitcoin price extreme growth, chart showing fluctuation, value rise and fall. Web interface showing Bitcoin gaining and losing value on market
00:30
HD
Animated Line Graph Showing Fluctuating Growth and Data Trends on Blue Background
00:06
HD
Woman Hands Touching Hologram Display Showing Cost Decrease and Quality Increase on Laptop
00:08
HD
Examining cost reduction strategies and financial efficiency for business growth animation..
00:10
HD
Red colorful downward trend arrow graph on black background symbolizing representing financial and market loss, market decline, business decrease, economic crisis, and negative growth concept.
00:06
HD
Quality control and company cost reduction. Cost and quality control concept. Percentage icon of quality and cost with up and down ,neon line blinking animation. Successful organization strategy .
00:10
HD
Abstract 3D number 1910 text animation floating against a deep black void offering a vibrant and modern visual for the year with a sense of digital energy. 4k motion video.
00:10
HD
Zoom in and out animation the credit card symbol. Large black symbol in the center and four small symbols around. Seamless looped 4k animation on white background
00:12
HD
neon direction arrow icon animated video
00:07
HD
Arrow continuous line 4K animation video showing downward direction on a minimal background
00:10
HD