Foi enviada uma ligação para definir a sua palavra-passe para: Irá necessitar de uma palavra-passe para aceder às suas compras futuramente.
Obtenha 3 vídeos ou 25 imagens com uma avaliação gratuita
Novos filtros adicionados
Ordenar por

13 054 resultados para decrease arrow em vídeos

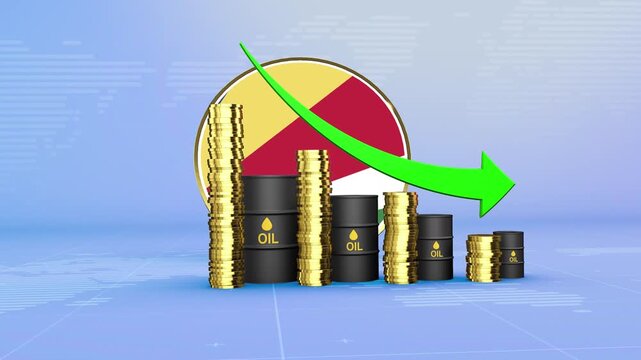
Seychelles Oil Prices Decline with Oil Barrels, Gold Coins and Downward Green Arrow, 3D Economic and Financial Market Concept
00:11
HD
Rising Falling Graph Animation Green Screen
00:06
HD
Laptop screen displays gold bars and a downward arrow indicating a price drop.
00:08
HD
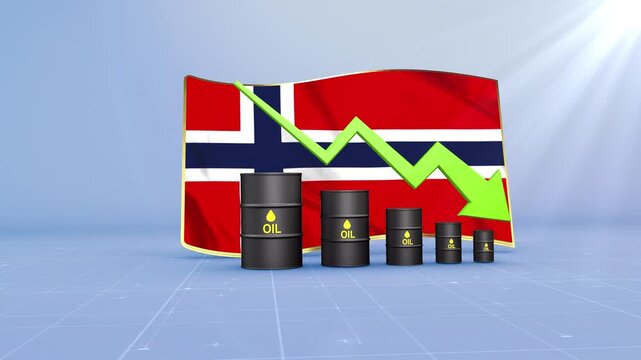
Norway Oil Price Falling with Oil Barrels Downward Green Arrow and 3D Financial Data Visualization Graphs for Economy and Business Concept
00:11
HD
Financial downturn loading and 404 error black and white line animation pack. Investor watering money plant. Discouraged entrepreneur animated outline 4K video set on transparent background
00:42
HD
Pixelated red bar chart showing downward trend on dark background, motion graphic
00:06
HD
calcium level indicator scale. Low normal & high meter infographic animation. Showing high calcium level color gauge indicator. on a white background 4k animation video
00:10
HD
Business financial standing concept featuring a decreasing bar graph, falling coins, and financial reports on a computer screen, signifying risk, analysis, and monetary evaluation
00:17
HD
Teal bar chart decline animation displays downward trend arrows. Bar chart graph column layout indicates financial losses. Decline animation sequence loops well.
00:06
HD
Price Drop $99 to $49 with $50 Savings
00:12
HD
thermometer temperature animation rising and falling
00:10
HD
Rate cut graphic with downward trending green line and percentage symbols on black background interest rate
00:07
HD
Carbon offset growth graph showing increasing CO2 reduction over time on a minimalist grid background
00:10
HD
Customer satisfaction level indicator scale. Low normal & high meter infographic animation on black background. Showing high level color gauge indicator for business service quality and experience.
00:10
HD
3D Business Statistics Bar Chart with Downward Arrow Showing Financial Decline, Falling Revenue, Market Loss and Negative Growth Data Visualization on Green Screen
00:05
HD
CO2 Emission and Reduction Icon Animation. Of carbon emission Arrow icon drawing on and fading out. Features On White Background.
00:08
HD
Fall in business market values on a digital monitor showing professional data management tips for corporate annual report projects
00:15
HD
Business graph. loss graph direction. damage business graph. business or finance concept icon animation.
00:10
HD
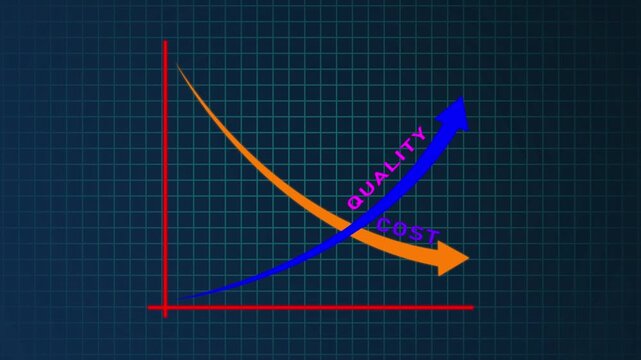
Quality vs Cost Comparison Chart with Business Decision Making and Performance Analysis Concept on Black Background..
00:10
HD
Neon green recycling sign zooming in slowly against black background with glowing digital symbol for eco concept.
00:10
HD
Albania Crude Oil Price Decline with Oil Barrels and Downward Green Arrow
00:11
HD
Black Friday Price Drop Animation with Downward Arrow and Percent Sign on Green Screen Background
00:08
HD
Decreasing Bar Graph Chart With Downward Arrow On Black Background Animation
00:12
HD
Congo Republic Oil Price Falling with Oil Barrels Downward Green Arrow and 3D Financial Data Visualization Graphs for Economy and Business Concept
00:11
HD
Neon cloud emissions animation features glowing CO2 text and arrows. Climate pollution concept animates this cloud emissions animation. Carbon footprint reduction drives the cloud emissions animation.
00:13
HD
Animated red arrows pointing downward on green screen background, for motion direction, motion animation
00:10
HD
water pollution level indicator scale. Low normal & high meter infographic animation. Showing high water pollution level color gauge indicator. on a black background 4k animation video
00:10
HD
radiation level indicator scale. Low normal & high meter infographic animation. Showing high radiation level color gauge indicator. on a black background 4k animation video
00:10
HD
Merchandise loss concept decreasing business profits, inventory value erosion, financial decline, and theft risk impacting store operations and company assets
00:17
HD
priority level indicator scale. Low normal high meter infographic animation on black background. Showing high pressure level color gauge indicator.4k quality animation video
00:10
HD
glowing neon Percentage growth and decline icon with up and down arrows. financial, business, and statistical analysis. Up and down percentage arrows icon.
00:10
HD
Business growth concept in graph chart showing marketing sales profit increasing to future target . growing business concept. Clean Hi-tech style technology chart
00:10
HD
Minimalist gold recycling symbol graphic
00:08
HD
Security level indicator scale. Low normal & high meter infographic animation on black background. Showing high security level color gauge indicator for safety and risk monitoring.
00:10
HD
3D blue earth world map globe combined with a direct descending red line graph arrow showing sudden economic market crash notification icon popping up on green screen.
00:15
HD
Interest Rate Decline With Coins
00:06
HD
Low-margin profit tracking visualized on a high-tech monitor illustrating tight financial limits and business revenue contraction
00:15
HD
Curved Down Arrow Hand Drawn Animation
00:05
HD
Currency exchange icon with two dollar coins and red green arrows in purple outline for money transfer forex finance trading and banking concepts
00:10
HD
Dollar Sign Cutting Corporate Budget Downsizing finance business animation HD 4K
00:10
HD
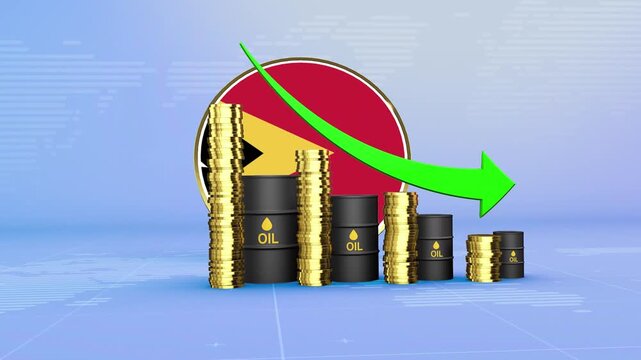
Timor Leste Oil Prices Decline with Oil Barrels, Gold Coins and Downward Green Arrow, 3D Economic and Financial Market Concept
00:11
HD
bat wing arm reduction animation, sagging upper arm skin tightening animated video, plastic surgery procedure motion graphics
00:05
HD
Neon red declining bar chart animation for financial loss and market downturn concepts glowing
00:10
HD
Italy Oil Price Falling with Oil Barrels Downward Green Arrow and 3D Financial Data Visualization Graphs for Economy and Business Concept
00:11
HD
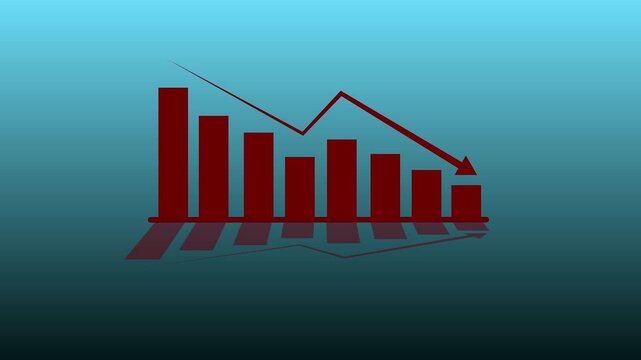
Business decline bar chart animation with falling line graph and shadow effects on transparent background. Indicate revenue decline, financial loss, negative growth
00:06
HD
Green recycling symbol rotates smoothly through a full circular turn and subtly scales, high quality video footage for sustainability, reuse, waste reduction, and environmental awareness
00:08
HD
danger level indicator scale. Low normal & high meter infographic animation. Showing high danger level color gauge indicator. on a white background 4k animation video
00:10
HD
energy level indicator scale. Low normal & high meter infographic animation. Showing high energy level color gauge indicator. on a black background 4k animation video
00:10
HD
4K animation of Falling Dollar Coin With Red Downward Arrows and Alert Icon Representing Financial Loss
00:06
HD
metabolism rate level indicator scale. Low normal high meter infographic animation on black background. Showing high pressure level color gauge indicator.4k quality animation video
00:10
HD
Reuse level indicator scale. Low Normal High meter infographic animation on black background. Showing high reuse level color gauge indicator.
00:10
HD
Black downward trending graph line over green screen grid. Financial loss chart for corporate business economic market crash. Animated graph chart loop.
00:08
HD
Close-up stock market trading screen with market data, trading volume, prices and percentage changes. Investment strategy, analyzing, data spreadsheet, financial figures, trading board, exchange infor
00:10
HD
Probability level indicator scale. Low Normal High meter infographic animation on black background. Animation showing high probability level color gauge indicator for statistical analysis and outcome.
00:10
HD
graph chart up down business statistics
00:08
HD
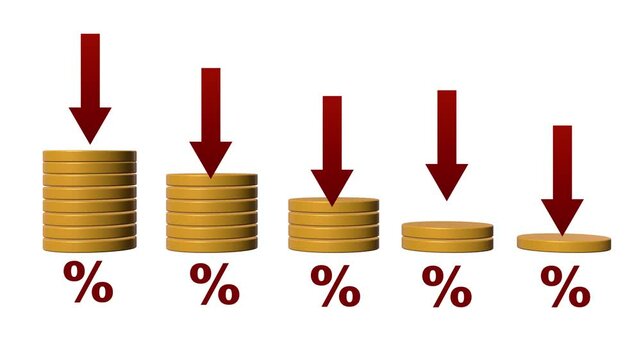
Declining Financial Value Illustrated by Progressively Smaller Coin Stacks, Downward Arrows, and Percentage Symbols, Representing Falling Rates, Reduced Returns, Depreciation, and Economic Decline
00:10
HD
Decrease in profit on a digital monitor showing steady financial decline for maintaining long term corporate budget adjustments
00:15
HD
Neon Dollar Sign with Downward Arrows in a Circle
00:10
HD
Operational expense chart visualizing financial analysis, budgeting, and cost management with rising expenses, risks, and careful monitoring for business strategy and success
00:17
HD
Water Recycling Symbol Animated Icon With Alpha Channel. Sustainable Water Management And Conservation Motion Graphic. Eco-Friendly Practices And Resource. On Transparent Background
00:07
HD
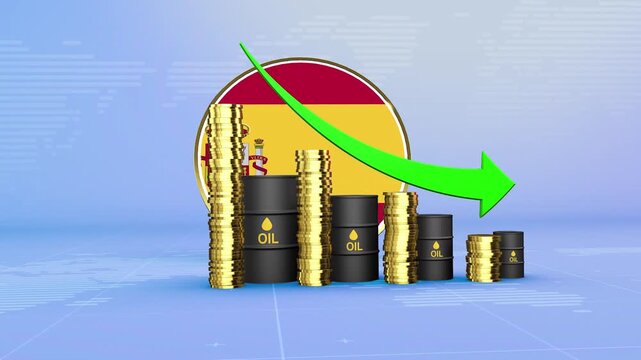
Spain Oil Prices Decline with Oil Barrels, Gold Coins and Downward Green Arrow, 3D Economic and Financial Market Concept
00:11
HD
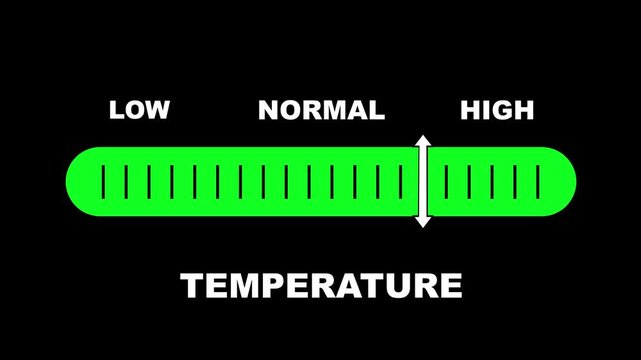
Temperature level indicator scale. Low Normal High meter infographic animation on black background. Animation showing high temperature level color gauge indicator for weather and climate monitoring.
00:10
HD
A repeating pattern of small red arrows pointing downwards on a bright green background.
00:10
HD
Quality improvement and cost reduction concept with blue quality line rising and red cost line falling. Concept of business strategy, management, efficiency and performance optimization
00:12
HD
Business decline bar chart animation with falling line graph and shadow effects on transparent background. Indicate revenue decline, financial loss, negative growth
00:06
HD
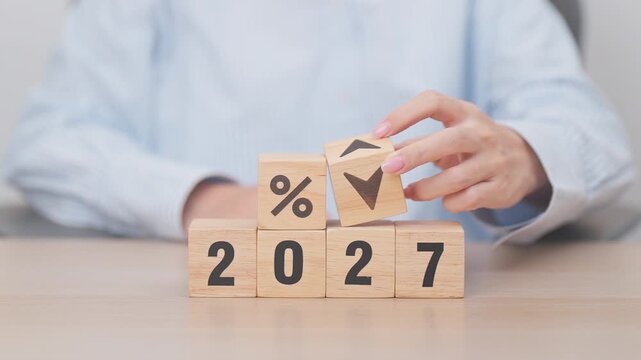
2027 New year with change to UP and Down arrow. Interest rate, GDP, stocks market, financial, deflation and Inflation, mortgage, debt, Loan and Economic Recession
00:09
HD
satureated fat level indicator scale. Low normal & high meter infographic animation. Showing high atureated fat level color gauge indicator. on a black background 4k animation video
00:10
HD
Financial growth animation finance money investment
00:08
HD
Nauru Oil Price Falling with Oil Barrels Downward Green Arrow and 3D Financial Data Visualization Graphs for Economy and Business Concept
00:11
HD
data security level indicator scale. Low normal high meter infographic animation on black background. Showing high pressure level color gauge indicator.4k animation video
00:10
HD
Person Typing on Laptop with House Icon and Percentage Symbol Illustrating Real Estate and Market Trend Analysis Sigmoid
00:10
HD
Stock market candles with falling prices of securities. Loss of assets in equities, showing a decreasing trend, poor performance, and financial losses due to economic crisis.
00:17
HD
Chart candlestick downtrend crisis crash bankruptcy, low lost market stock trading trade loss negative, financial economy decay graph recession business decrease
00:20
HD
Water pollution level indicator scale. Low normal & high meter infographic animation on black background. Showing high water pollution level color gauge indicator for environmental analysis.
00:10
HD
Animated Stress Level Gauge Infographic Illustrating Mental Health Tension and Overwhelm
00:07
HD
Cyan blue segmented downward arrow animation on a black background, ideal for download, navigation, scrolling, decrease, interface, and direction concepts.
00:10
HD
Downside financial exposure highlighted on a modern screen for professional risk management and economic tracking presentations
00:15
HD
Transparent Alpha Channel Falling US Dollar Currency Icon with Red Downward Arrow for Financial Crisis
00:12
HD
Business concept risk mitigation through financial planning, loss prevention, and managing negative impacts on customers or market conditions
00:17
HD
Financial Downturn and Economic Recession Analysis Bar Graph
00:10
HD
Ivory Coast Oil Prices Decline with Oil Barrels, Gold Coins and Downward Green Arrow, 3D Economic and Financial Market Concept
00:11
HD
Immunity level indicator scale. Low Normal High meter infographic animation on black background. Showing high immunity level color gauge indicator for health monitoring and wellness.
00:10
HD
Arrow up business graph icon animation. Increasing business growth chart animation. Going up business graph concept.
00:07
HD
Net zero emissions by 2008 to change climate and net zero greenhouse gas emissions target. Aerial of Net zero environment sustainable development concept. Neon net zero goal achieved.4k video
00:10
HD
Data visualization sequence on black background, animated bar charts declining over time, highlighting downward trends with arrows, financial analysis insights, Copy space.
00:16
HD
Quality increase and cost optimization for products or services to improve customer satisfaction and enhance company performance. Successful corporate strategy and management. Effective business.4k
00:10
HD
trans fat level indicator scale. Low normal & high meter infographic animation. Showing high trans fat level color gauge indicator. on a white background 4k animation video
00:10
HD
Stock market crash, red candlestick chart falling arrow, financial decline concept. Business crisis economy downturn, trading loss graph. Stock market crash risk
00:10
HD
Financial interest rate and market trends concept.
00:10
HD
fitness level level indicator scale. Low normal high meter infographic animation on black background. Showing high pressure level color gauge indicator.4k quality animation video
00:10
HD
Businessman Using Digital Tablet to Analyze Real Estate Market Trends with House Icon and Percentage Decrease Symbol Against Abstract Background Sigmoid
00:10
HD
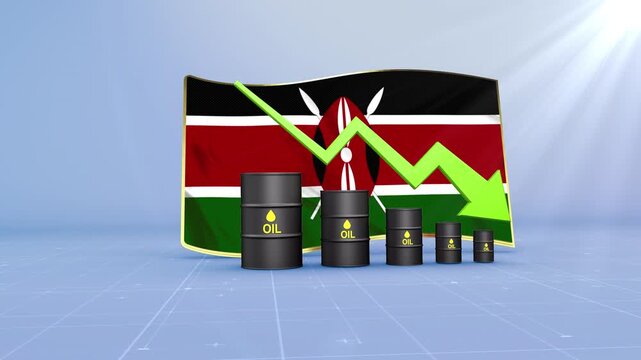
Kenya Oil Price Falling with Oil Barrels Downward Green Arrow and 3D Financial Data Visualization Graphs for Economy and Business Concept
00:11
HD
miniature earth planet with a tree Eco-Sustainable Solar Panel Corporate Environment friendly goal development green business strategy global net zero carbon neutral target emission reduction
00:06
HD
The Infographic Icon Downward Bar Graph.
00:10
HD
Declining Bar Chart with Downward Arrow Representing Financial Loss and Economic Downturn.
00:11
HD
chart animated outline icon. chart rotation appearance 4k video animation for web, mobile and ui design
00:06
HD
Animated searvice Sector Performance Meter – Increasing and Decreasing Gauge from Good to Best Levels, Comparison Indicator for  Data Visualization,  perfomance, and Motion Graphic Reports
00:10
HD
Integrity Level Text or Word Low and Medium to High Meter Concept Animation on Black Background and Blue Screen
00:58
HD
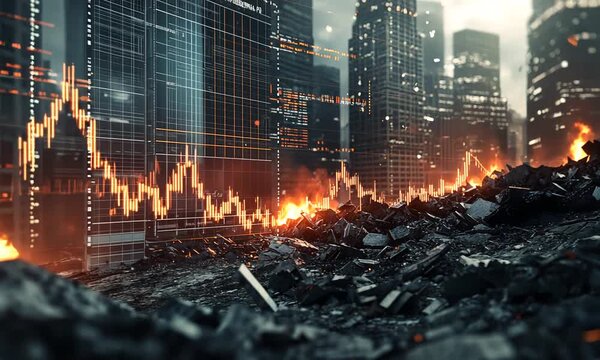
Economic crisis concept and digital indicators overlap with destroyed city background
00:10
HD
Great British pound exchange rate animation. Green arrow pointing upwards and red arrow pointing downwards. Pound sign on the right corner of each arrow. Green screen background.
00:10
HD