Foi enviada uma ligação para definir a sua palavra-passe para: Irá necessitar de uma palavra-passe para aceder às suas compras futuramente.
Obtenha 3 vídeos ou 25 imagens com uma avaliação gratuita
Novos filtros adicionados
Ordenar por

18 426 resultados para data futuristic graph interface statistic em vídeos

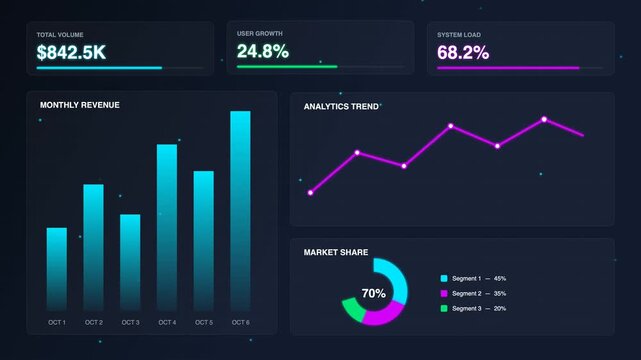
Futuristic digital dashboard displaying analytical data visualizations
00:10
HD
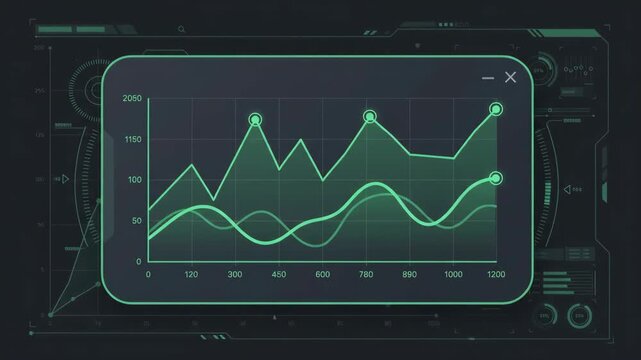
glowing green digital line graph data chart displays fluctuating financial metrics within futuristic technological interface dashboard with advanced system monitoring elements in the background
00:06
HD
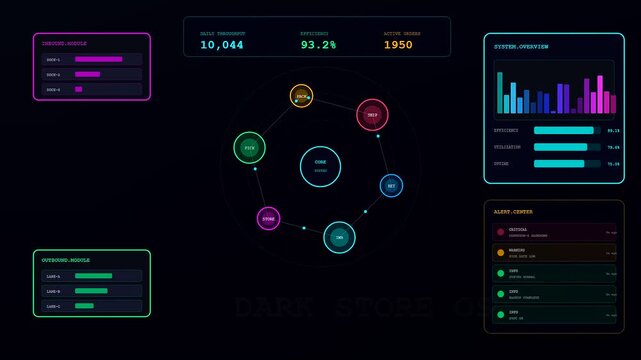
This futuristic digital user interface demonstrates Dark Store Automation with colorful interactive data charts performance statistics and system nodes on a dark background
00:06
HD
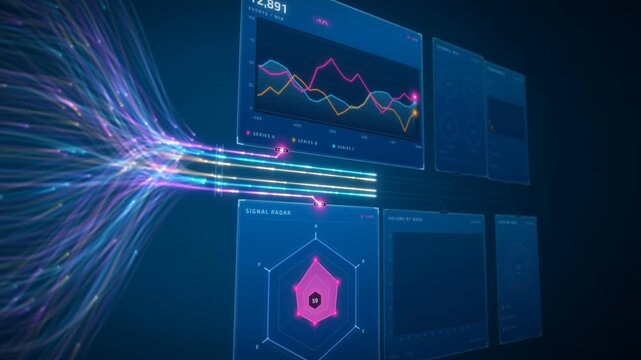
Data flow streams converging into a live analytics dashboard with radar chart, bar graphs and system load
00:16
HD
AI robot pointing at futuristic digital interface screens displaying data charts and graphs within cyberspace network environment for computer innovation engineering concepts.

00:08
HD
Smart city skyline of Chicago showing futuristic financial data, stock market infographics, business analytics, big data visualization over urban landscape
00:06
HD
Futuristic digital dashboard interface with glowing blue data visualization and HUD elements.
00:20
HD
Glowing blue holographic arrows pointing upwards on a digital grid floor representing financial growth business success and stock market rise
00:11
HD
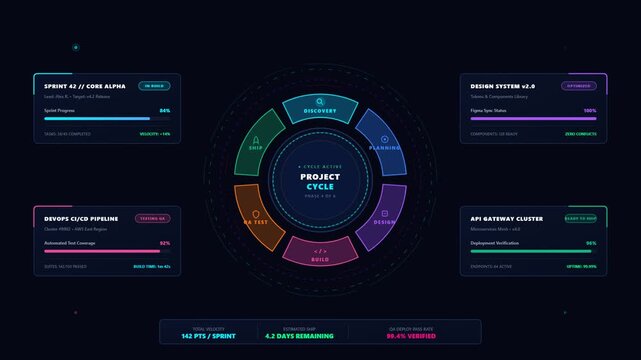
Futuristic cyber security dashboard interface with complex data analytics and project cycle indicators
00:12
HD
Businessman using digital analytics interface with graphs and charts for data analysis and futuristic technology in a vibrant city skyline at night Gluon.
00:10
HD
Businesswoman workspace with Digital Interfaces Showcasing AI Agents , AI Generated and Data Analytics on digital tablet Representing Technology and Innovation in Business Gluon
00:09
HD
Stock market ticker terminal screen showing multiple live trading graphs and financial charts
00:30
HD
Hud interface animation displaying futuristic data charts and graph loop
00:06
HD
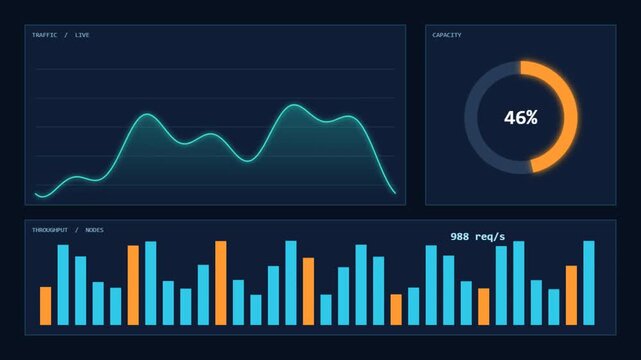
Futuristic dark UI analytics dashboard featuring real-time animated line graphs, bar charts, data tables, and a purple heatmap for business insights.
00:10
HD
A digital diploma system interface displaying layered cross section scan graphs and data grid metrics for futuristic scientific research analysis within a dark blue computer screen
00:06
HD
A sophisticated digital interface displays a dynamic broadcast data overlay showing real time financial market fluctuations with glowing blue line graphs and professional statistical trading metrics
00:06
HD
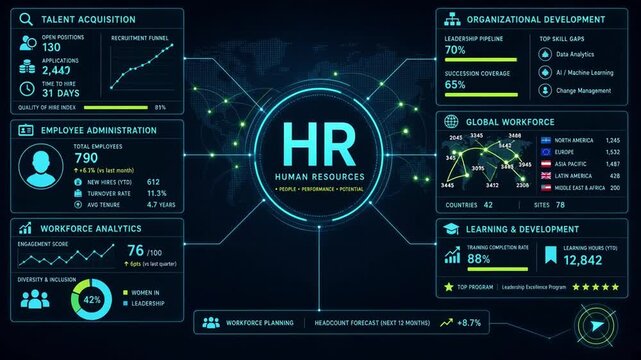
futuristic digital dashboard interface displaying corporate personnel management analytics data visualization on high tech screen
00:10
HD
Digital stock market interface data in a dark futuristic grid with glowing graphs and indicators
00:12
HD
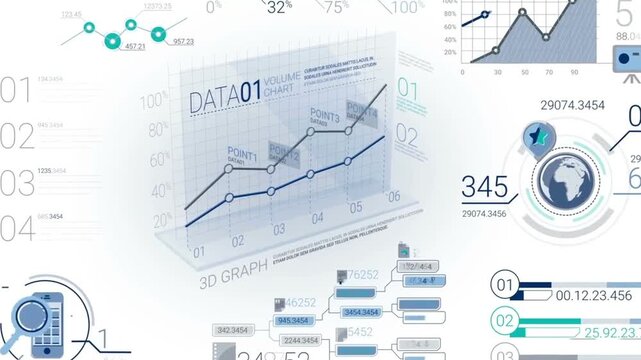
3D business infographic line graph with data animation elements on a white background. Futuristic financial chart HUD interface loop.
00:12
HD
Dynamic futuristic data frame with animated charts and digital interface elements illustrates business performance, market trends, technology development, and innovative data visualization for modern
00:20
HD
A professional man interacts with a high-tech circular data interface on a large digital screen, featuring graphs and data elements in a glowing blue theme.
00:36
HD
Digital cloud server metrics interface displaying latency and ping data on futuristic monitor set against dark abstract background with glowing geometric grid lines and data connections
00:06
HD
Neon graph data dashboard analytics hologram futuristic interface with rising charts, metrics, glowing visualization
00:05
HD
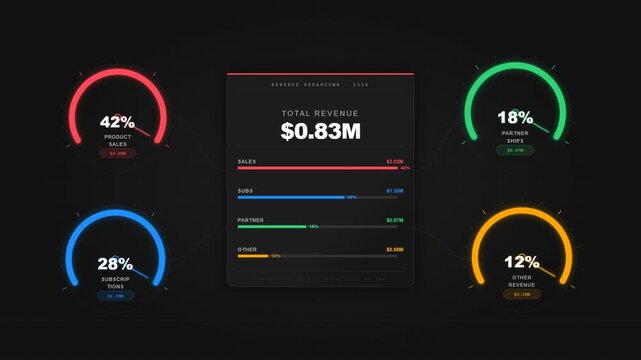
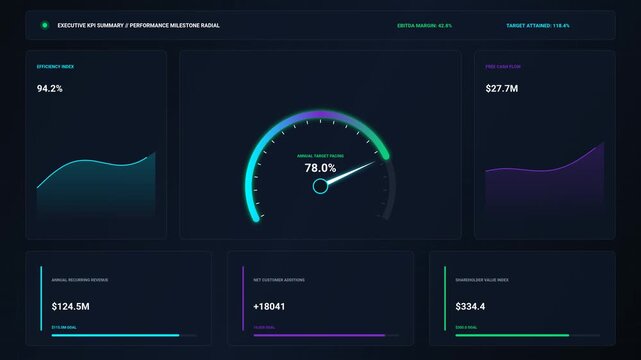
Futuristic dark mode financial dashboard interface with colorful radial gauge chart.
00:10
HD
Glowing futuristic digital interface dashboard displaying real time data charts and dynamic analytics graphs
00:07
HD
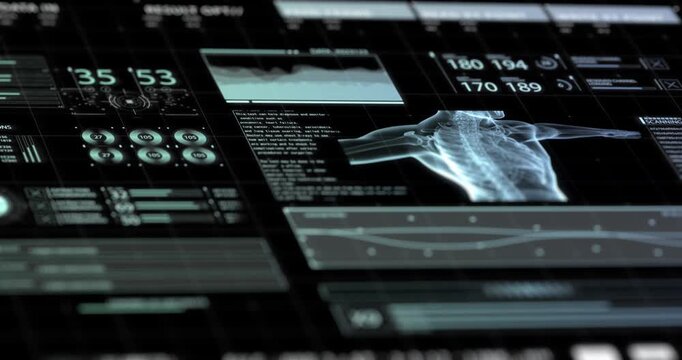
A futuristic medical interface displays a glowing x-ray scan of a human torso alongside charts, counters, and streaming data.
00:20
HD
Digital data stream graph animation in futuristic interface
00:15
HD
Abstract futuristic digital interface display with glowing data visualizations, charts and graphs, motion graphic loop
00:06
HD
Interactive financial dashboard displaying real-time stock market data and analytics. Lockdown shot of digital interface with animated graphs and charts.
00:10
HD
Engage with a futuristic tech interface showcasing data analysis, e-commerce insights, and AI integration, reflecting innovative trends for the year 2026 in digital marketing. Salient
00:15
HD
Visual diagram global stocks statistics and performance data,  dashboard multi-function summarize, line graph upward trend trading volume interface
00:19
HD
Seamless loop of futuristic sci-fi HUD interface with AI core display and data panels, monochrome, icy blue colors, 4K seamless loop
00:10
HD
Customer support technology with digital interface displaying analytics, statistics and communication icons. Businessman touching interactive screen for data management and network solutions in office
00:09
HD
Business growth performance metric bar chart and line graph futuristic cyan neon hud ui interface corporate data visualization finance analytics presentation
00:08
HD
Global finance stock market digital data technology economy trading graph network investment business chart analysis futuristic virtual earth connection currency growth trend background digital globe
00:08
HD
Futuristic business dashboard with data visualization charts
00:10
HD
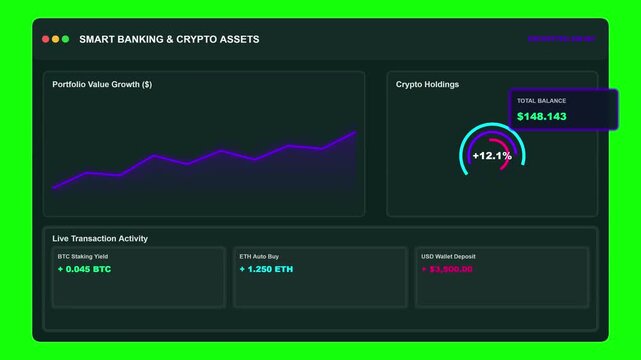
Futuristic smart banking dashboard displaying portfolio value growth curve, crypto holding rings, real time transaction activity, and encrypted digital balance interface for financial technology.
00:10
HD
Futuristic digital interface showcasing data analysis and user insights. Represents the importance of data-driven decision-making in modern business
00:05
HD
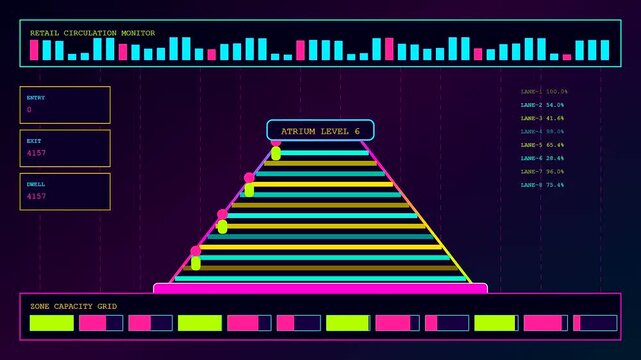
Displaying a virtual showroom interface showing animated data visualization charts in a futuristic digital environment with neon blue and pink lines indicating traffic flow statistics
00:06
HD
Futuristic data dashboard interface with neon glowing charts and graphs
00:20
HD
A professional man interacts with a high-tech circular data interface on a large digital screen, featuring graphs and data elements in a glowing blue theme.
00:15
HD
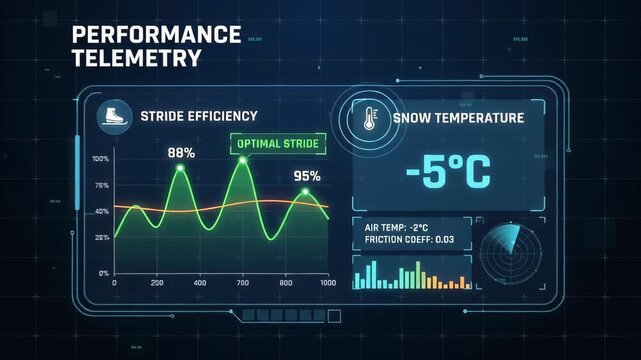
digital performance telemetry dashboard visualizing ice skating stride efficiency and snow temperature data over futuristic glowing grid interface
00:06
HD
Business growth data graph showing financial success and rising statistics over blue digital grid background.
00:30
HD
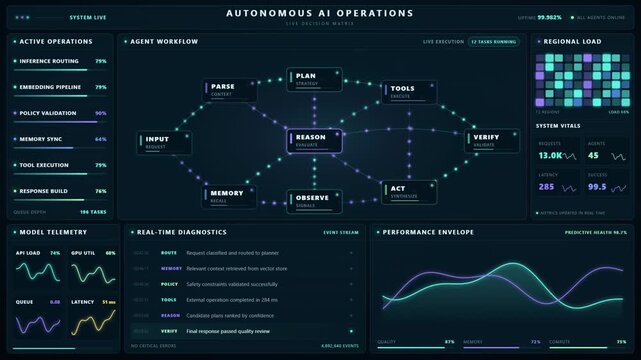
Autonomous AI operations dashboard with agent workflow diagram telemetry charts and diagnostics
00:15
HD
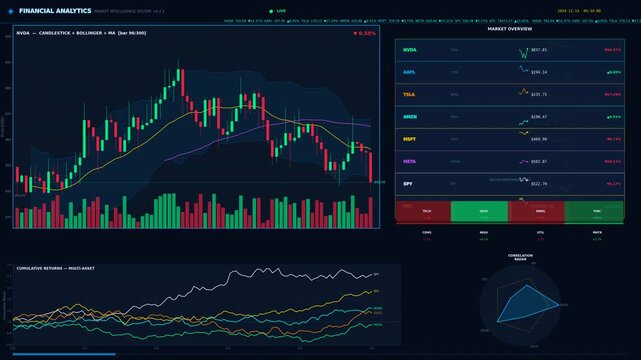
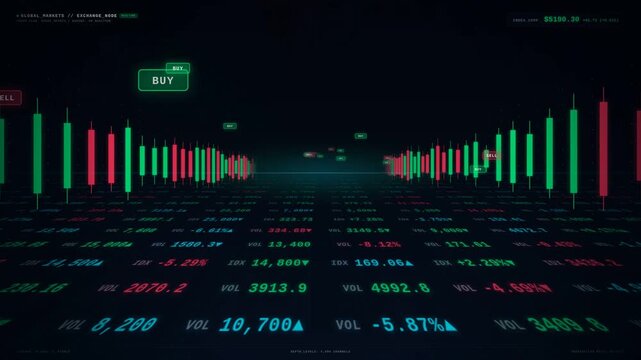
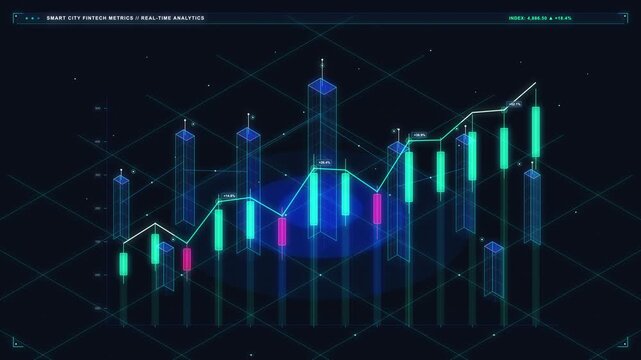
Financial stock market dashboard with candlestick charts. Digital trading data interface. Global economy and crypto exchange background.
00:20
HD
financial analytics, stock market growth, data visualization, business chart, digital dashboard, isometric graph, economic forecast, trading platform, network analysis, technology interface
00:06
HD
Abstract Digital Data Visualization with Floating Numbers and Moving Graphs on White Background
00:20
HD
Dynamic motion of digital blue bar graph visualization in futuristic data analysis video.
00:09
HD
Futuristic hud interface with animated data graphs and digital waveform analysis
00:12
HD
Futuristic Digital Dashboard with Data Analytics and AI Interaction in a Modern Workspace Featuring Hands on a Laptop Gluon.
00:10
HD
Motion graphic of a complex cybersecurity dashboard user interface for cyber defense and threat monitoring, featuring a global world map and data analytics for modern tech presentations.
00:15
HD
Futuristic digital interface with glowing graphs illustrating comprehensive financial market analysis and real-time trading data trends for strategic economic forecasting
00:10
HD
Digital wave data graph visualization displays fluctuating information on dark grid background with futuristic glow effects and animated points.
00:08
HD
Cyberpunk user interface dashboard with neon charts and digital metrics for futuristic software design
00:15
HD
A sophisticated data visualization featuring a futuristic financial dashboard with dynamic widgets. It showcases real-time metrics including total revenue trends.
00:10
HD
AI SEO assistant data, Futuristic dashboard finance analytics chart data technology glowing neon blue digital graph growth financial chart interface ui panel business
00:08
HD
Tech developer presenting artificial general intelligence on a futuristic interactive screen with data and statistics
00:23
HD
Futuristic digital head up display interface showcasing glowing blue financial growth bar charts circular loading metrics and animated wave line graphs designed for corporate data analytics
00:15
HD
Financial trading graph interface with cryptocurrency market data display
00:15
HD
Abstract futuristic data visualization with animated bar charts and donut graph deep teal and purple hues
00:05
HD
Digital dashboard displaying financial analytics with growing charts and data points in a dark blue futuristic setting
00:12
HD
Modern Business Intelligence KPI Dashboard with Radial Performance Gauge
00:10
HD
Digital metric tracker interface displaying live data line graph and loading progress circle against dark abstract particle background showing real-time statistics in futuristic environment
00:06
HD
Business KPI dashboard with floating glass panels charts and gauges looping on dark space
00:15
HD
Digital data visualization technology featuring futuristic hologram interface with glowing blue bar chart, pie chart, line graph, and advanced analytics for digital graph and chart visualization
00:08
HD
A wide futuristic control screen shows a scanned truck, route maps, and glowing violet analytics across multiple panels.
00:25
HD
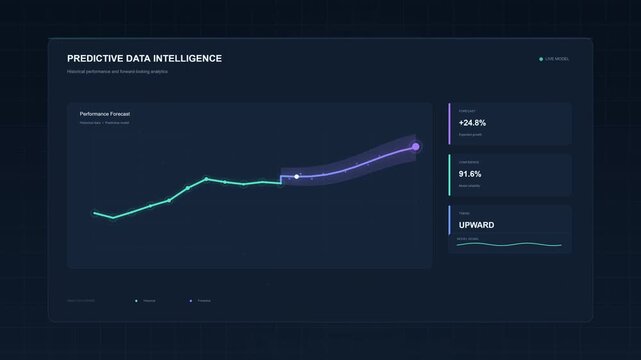
Predictive data intelligence dashboard with growing trend graph
00:05
HD
Visual diagram global stocks statistics and performance data,  dashboard multi-function summarize, line graph upward trend trading volume interface
00:19
HD
Business Statistics, Market Data And Infographics Layout 4k animation design business market data analysis reports, with infographics, bar stats, charts and diagrams
00:18
HD
A futuristic hand reaches out to display a rising graph full of financial data against a digital skyline, symbolizing growth and innovation in business strategy. Copula
00:10
HD
Futuristic digital interface displaying data analysis and financial graphs on a dark background
00:20
HD
Digital blue holographic data graph with glowing line moving across a futuristic grid background
00:10
HD
Futuristic digital globe and data analytics interface rotating in cyberspace loop
00:15
HD
Digital search bar and data dashboard visualization for a futuristic Halloween technology interface with glowing elements and metrics
00:10
HD
Futuristic DNA helix with medical data charts and interface
00:06
HD
A sophisticated user interface featuring an AI Generated Caption displays complex geospatial data analytics and urban foot traffic monitoring across a dark digital dashboard environment
00:06
HD
Business professionals analyzing complex data on a futuristic holographic digital display for strategic planning and innovation
00:24
HD
Futuristic digital data graph with blue bars and glowing elements HUD interface
00:05
HD
Futuristic financial stock market graph trading data interface hud screen
00:15
HD
Glowing digital bar graph with blue light effects showcasing data analysis, technology innovation, and futuristic interaction in virtual interface environment
00:05
HD
UI dashboard interface animation with financial data graphs and charts loading
00:15
HD
Animated cyan bar chart on green grid HUD interface data graph loop
00:11
HD
digital financial dashboard showing colorful circular charts with cryptocurrency market price fluctuations displayed against dark tech-themed interface background with grid lines and data nodes
00:06
HD
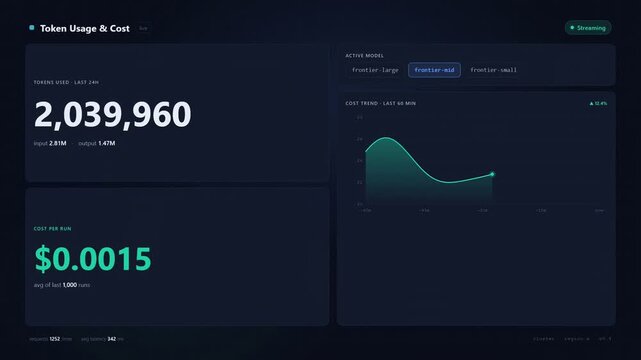
Real-Time AI Token Usage & Cost Dashboard. Monitor LLM API expenses, token consumption, and model performance with animated data visualization.
00:15
HD
Dynamic digital data analysis interface with interconnected graphs and glowing technological elements representing advanced information processing and a futuristic network concept
00:10
HD
abstract smart city technology background with modern office skyscrapers and floating digital analytics charts.
00:20
HD
Cinematic futuristic data visualization where luminous turquoise bars emerge from a reflective black grid, a bright arrow-shaped line graph rises continuously toward the horizon
00:07
HD
Futuristic HUD interface displaying interactive data graph and analytical metrics
00:10
HD
Hud interface digital dashboard motion graphic with futuristic data
00:06
HD
Business professional analyzing data trends and statistics on a futuristic digital interface with charts and graphs depicting growth and performance metrics Gluon.
00:10
HD
AI prompt engineering dashboard interface with token usage and analytics
00:10
HD
Businessman working on laptop computer with holographic graph chart on the virtual screen, Professional businessman analyzing financial data and market trends using futuristic holographic interface
00:10
HD
Animated labor market report showing rising unemployment rate and job cuts in futuristic interface
00:15
HD
Neon analytics dashboard UI interface with data visualization charts and graphs in dark mode
00:15
HD
Futuristic digital monitoring interface showing data graphs
00:15
HD
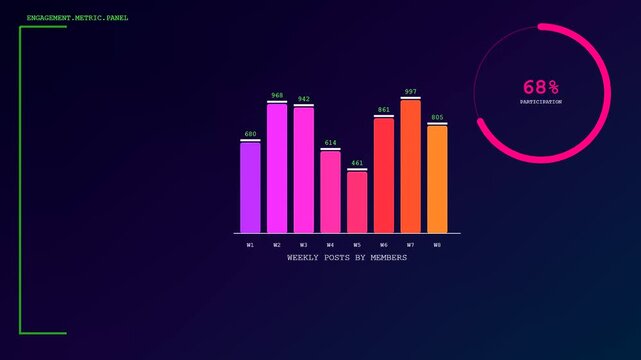
A dynamic digital dashboard displays a Realtime Trend Visualization with fluctuating bar graphs and circular progress meters tracking social media engagement across analytical panels.
00:06
HD
Colorful digital stock market chart with candlestick patterns and data visualization showing financial trends and analysis combined with glowing pink and blue candlestick graph displaying market
00:10
HD
Data pipeline converges raw data streams into glowing lines that feed live analytics dashboard panels
00:16
HD
Professional using laptop with holographic task management checklist and analytics dashboard. Digital workflow interface displays completed tasks and performance charts for business productivity
00:09
HD
Financial report background graph and charts motion. Abstract futuristic stock market interface concept. Crypto currency commerce texture animation. Seamless loop.
00:15
HD