Foi enviada uma ligação para definir a sua palavra-passe para: Irá necessitar de uma palavra-passe para aceder às suas compras futuramente.
Obtenha 3 vídeos ou 25 imagens com uma avaliação gratuita
Novos filtros adicionados
Ordenar por

4 924 resultados para candlestick pattern em vídeos

Stock market candlestick pattern hammer
00:10
HD
Minimalist green candlestick chart pattern on a solid black background
00:10
HD
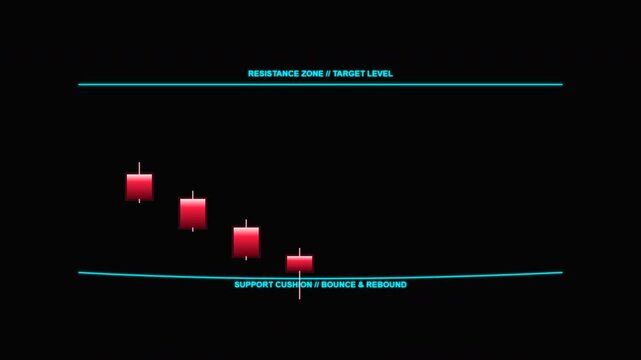
Stock Market Chart Showing Support Bounce and Price Rebound
00:12
HD
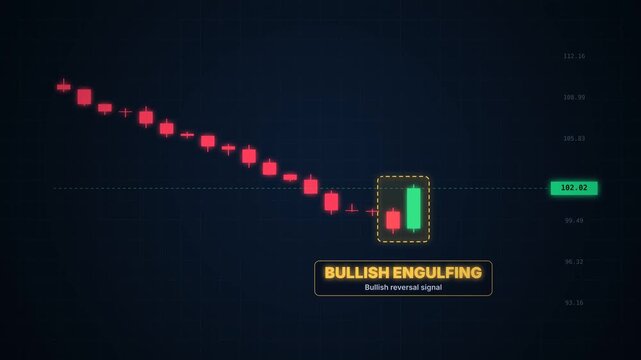
Bullish engulfing candlestick pattern forming after downtrend, bullish reversal signal
00:08
HD
A glowing neon green graphic of a hammer candlestick pattern against a dark background.
00:10
HD
Minimalist financial candlestick chart pattern isolated on a black background
00:10
HD
Financial market chart with candlesticks and line graph, Abstract financial chart with candlestick bars and line graphs market analysis growth and data trends animation
00:10
HD
Candlestick Chart Rising and Falling on Dark Background - Stock Market Trading Animation
00:10
HD
Golden candlestick bar floating with technical line chart, gold trading investment strategy, bullrish commodities market price trend graph, uptrend financial economic growth profit 3d rendering
00:18
HD
Animated Stock Market Candlestick Chart Sequence
00:15
HD
Global Financial Network World Map Candlestick Charts Trading Connections
00:05
HD
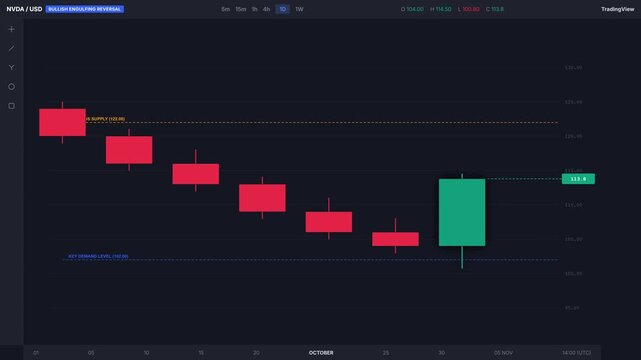
Bullish Engulfing Candlestick Reversal at Support Level 4K Stock Market Animation
00:05
HD
Cryptocurrency candlestick trading chart with positive trend counter overlay
00:07
HD
financial stock market trading chart with candlestick patterns and upward trend analysis for investment data
00:07
HD
Financial stock market chart showing a strong bullish uptrend with green candlestick patterns on a dark digital interface
00:12
HD
Dynamic stock market chart with candlestick patterns and real-time financial data on a digital screen ideal for illustrating investment trading and economic analysis
00:08
HD
Black analyst in a blue vest gestures at an upward candlestick pattern, then writes on a tablet and speaks while a Latina colleague listens and an Asian man looks on
00:19
HD
Abstract minimalist financial candlestick chart pattern forming upward trend on dark textured background, representing growth and investment
00:06
HD
Animated Candlestick Chart Rising Market Trend
00:08
HD
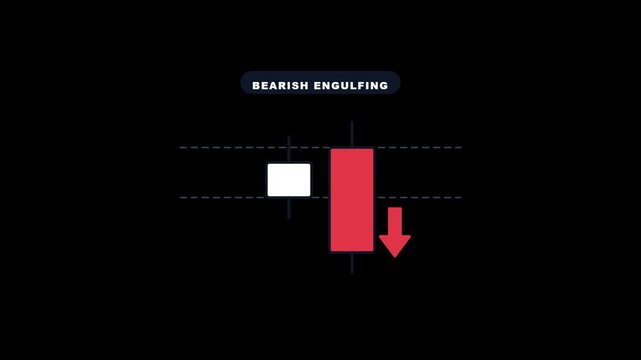
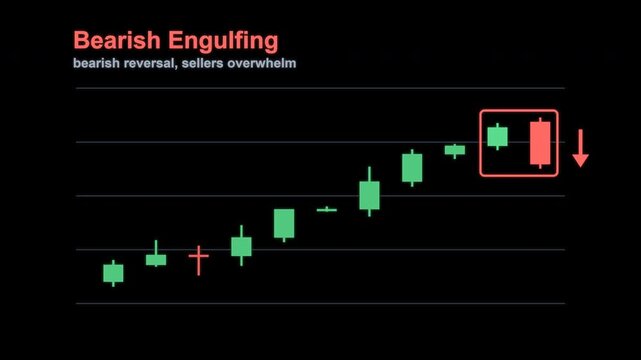
Bearish engulfing candlestick pattern with red down arrow on black chart
00:05
HD
Stock market candlestick pattern hammer
00:10
HD
a digital financial candlestick chart and trendline with cyan and purple and magenta neon bars on a dark background, representing stock market data, price action, or trading volatility
00:05
HD
Candlestick Chart Showing Resistance Zone and False Breakout Rejection
00:12
HD
Morning star three candle pattern forming after downtrend, bullish reversal signal
00:08
HD
Dynamic illustration of a growing stock market, featuring an ascending pattern of red and green candlestick charts symbolizing consistent financial progress
00:15
HD
Bear flag pattern explained on candlestick chart with labeled flagpole, flag, breakdown and target on beige
00:16
HD
Financial market chart with candlesticks and line graph, Abstract financial chart with candlestick bars and line graphs market analysis growth and data trends animation
00:10
HD
Futuristic financial stock chart with glowing blue and red candlestick patterns on dark grid screen, representing market analysis and crypto investment strategies for fintech app designs, trading
00:10
HD
White Japanese candlestick chart on dark blue gradient field. Financial white Japanese candlestick chart for stock trading analysis. Corporate white candlestick chart.
00:10
HD
Financial trading candlestick charts showing price action on black
00:08
HD
Digital financial trading chart with candlestick patterns and data analytics
00:10
HD
Stock Market Candlestick Chart Transition Rising and Wiping with Included Alpha Matte
00:10
HD
 XAUUSD Chart Line Art Animated Icons Pack, Gold Forex Candlestick Bullion Breakout Technical Analysis, 4K Alpha Loopable
00:12
HD
Digital financial candlestick chart displaying market trends, stock trading analysis, investment data and economic forecast
00:07
HD
Colorful candlestick chart with vertical bars in dark background
00:12
HD
Back View of Dark Robotic Figure Monitoring Real Time Stock Exchange Graphs and Financial Market Trends on Computer Screen. Algorithmic Trading, Robo Advisor, Fintech Analytics, Automated Investment.
00:14
HD
Traders monitor the volatile fluctuations of financial markets by observing shifting candlestick patterns displayed on a digital screen to assess global economic performance during active
00:15
HD
A businessman presents a digital growth chart showcasing colorful candlestick patterns and upward trends, symbolizing financial success and technology in business. Copula
00:10
HD
Digital financial trading chart with candlestick patterns and trend lines on a dark blue background
00:10
HD
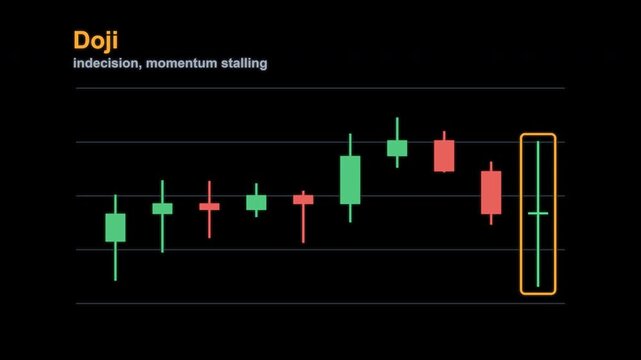
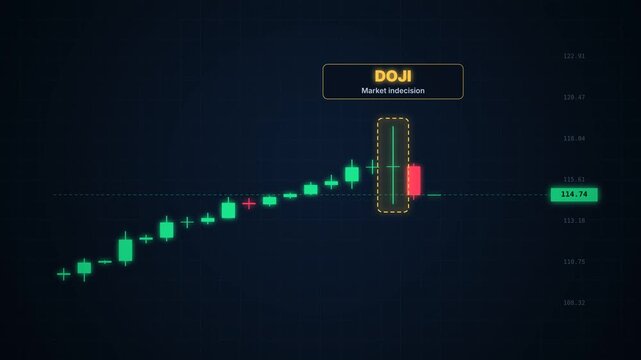
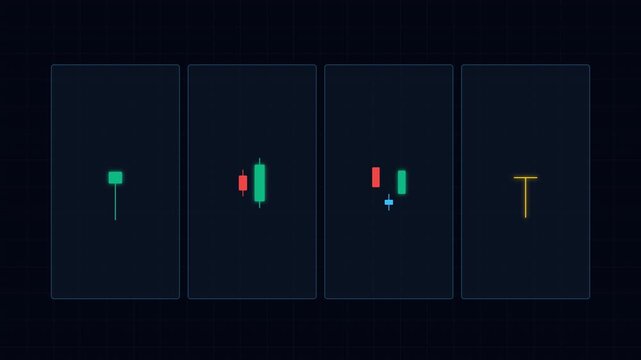
Doji Candlestick Pattern Trading Chart Labeled Animated Overlay Alpha 4K
00:07
HD
Bullish Reversal Candlestick Pattern on Futuristic Digital Trading Interface
00:15
HD
Animated colourful candlestick chart pattern graph with rotating globe infographic dashboard showing word economy modern design business stock market backrground
00:16
HD
Candlestick Trading Pattern Showing Market Liquidity and Breakout
00:12
HD
Close-Up of Hands Analyzing Stock Market Trends on a Smartphone, Candlestick Charts and Mobile Trading Technology
00:14
HD
Abstract digital financial stock market chart with glowing candlestick patterns on a dark blue background.
00:10
HD
Digital candlestick chart showing a bullish engulfing pattern
00:10
HD
Financial market chart with candlesticks and line graph, Abstract financial chart with candlestick bars and line graphs market analysis growth and data trends animation
00:10
HD
Abstract red stock market candlestick patterns moving downwards across a dark digital screen
00:07
HD
4K Ultra HD Financial trading chart with candlestick patterns and data analytics on a digital screen in a modern office environment video
00:10
HD
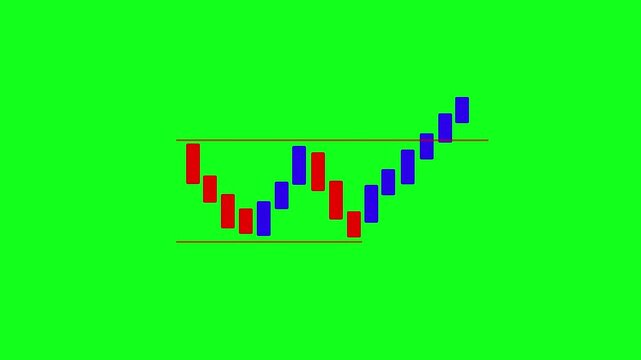
Double bottom trading chart candlestick pattern animation on green background. Candle chart trading goes up animation. Financial market analysis and stock trading motion graphic with alpha channel
00:06
HD
Financial candlestick chart pattern on a dark background
00:10
HD
Neon Yellow Candlestick Pattern Stock Chart with Numbers Loop 4K
00:13
HD
Stock market candlestick pattern gravestone dogi
00:10
HD
Digital candlestick chart pattern featuring green and red bars on a dark background illustrating financial market trends and investment analysis
00:15
HD
Head and shoulders pattern forming on candlestick chart, neckline breakdown and zoom out on white
00:16
HD
Financial stock market chart with glowing trend lines, candlestick patterns, and data analysis elements
00:07
HD
Financial Stock Market Data Chart with Candlestick Pattern and Volatility Analysis Background
00:12
HD
Capture the essence of financial growth with a colorful candlestick graph overlaying a laptop keyboard, representing the dynamic nature of stock markets and investment trends. Copula
00:10
HD
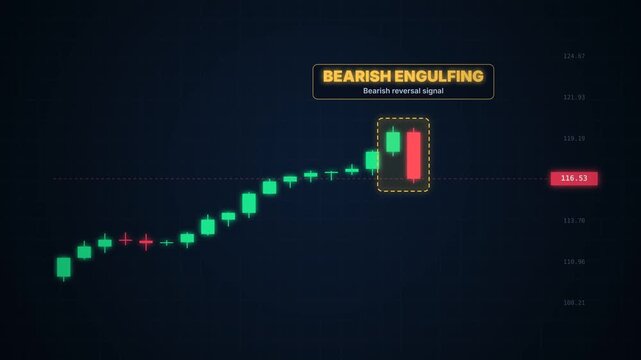
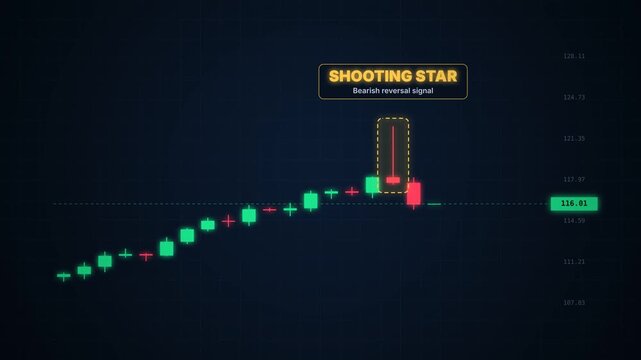
Bearish engulfing candlestick pattern forming after uptrend, bearish reversal signal
00:08
HD
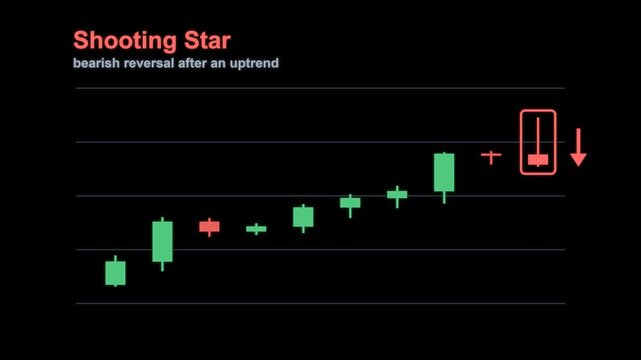
Shooting Star Candlestick Pattern Trading Chart Labeled Animated Overlay Alpha 4K
00:07
HD
3D glass candlestick chart with glowing moving average trend line rising on dark grid floor. Stock market trading, cryptocurrency analysis, Forex exchange, and fintech finance concept.
00:06
HD
colourful candlestick chart pattern graph with rotating globe infographic dashboard showing word economy modern design business stock market backrground
00:16
HD
Stock Trading Chart Showing a Bearish Move With Increasing Volume
00:12
HD
Animated stock trading candlestick chart featuring a classic 'M' pattern or double top reversal that builds exhaustive resistance and finishes with an explosive bearish breakdown, green bullish
00:10
HD
Minimalist financial candlestick chart pattern on a dark background
00:10
HD
Financial trading chart showing bearish candlestick pattern
00:10
HD
Financial market chart with candlesticks and line graph, Abstract financial chart with candlestick bars and line graphs market analysis growth and data trends animation
00:10
HD
Stock market chart with candlestick patterns and trend lines illustration
00:06
HD
Financial stock market chart showing red candlestick patterns with glowing white trend lines moving
00:06
HD
Stock market financial charts displaying candlestick data patterns
00:05
HD
Stock market chart with candlestick pattern and moving average lines showing financial data trends and analysis for investment decisions including blue line orange line green candle red candle graph
00:08
HD
Stylized financial chart with candlesticks animation, bar graphs and line plot on black background
00:12
HD
Financial Stock Market Candlestick Chart Animation
00:15
HD
A dynamic financial chart animation with green and red candlestick bars, moving averages, and market volume data against a dark background with floating bokeh.
00:10
HD
A dynamic stock market chart visualizes financial data with candlestick patterns and glowing orange lights. ..Created with Generative AI, not depicting real subjects.
00:10
HD
Stock market candlestick pattern hammer
00:10
HD
Financial Stock Market Candlestick Chart Animating Upward Trend Line Digital Dashboard Data Visualization
00:08
HD
Colorful candlestick chart showing upward trend in financial market analysis
00:10
HD
Doji candlestick pattern forming after uptrend, market indecision and trend reversal
00:08
HD
Bearish Engulfing Candlestick Pattern Trading Chart Labeled Animated Overlay Alpha 4K
00:07
HD
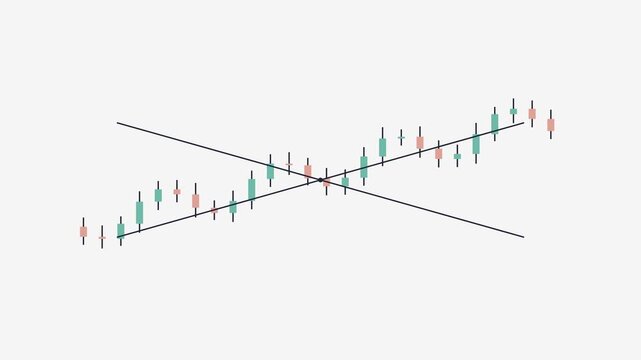
Animated Candlestick Chart With Crossing Trend Lines
00:08
HD
colourful candlestick chart pattern graph with rotating globe infographic dashboard showing word economy modern design business stock market backrground
00:16
HD
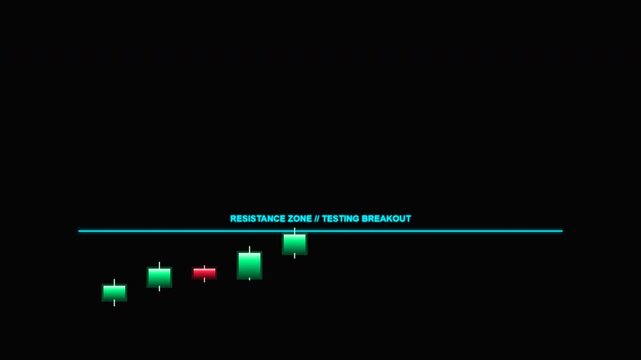
Financial Market Chart Showing a Successful Resistance Breakout
00:12
HD
Showcasing green and red candlestick market patterns for finance data, technical trading, and investment symbols. Suitable for financial presentations.
00:10
HD
Financial stock chart displaying candlestick patterns with upward trendline and volume indicators on a dark-themed background.
00:05
HD
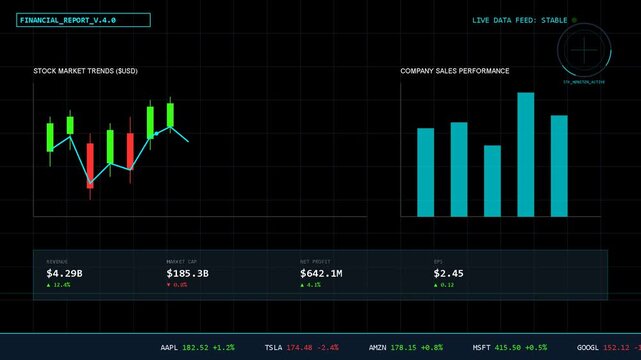
digital financial dashboard with stock market charts, candlestick graphs, data analytics and trading metrics
00:07
HD
Abstract financial chart with bullish candlestick patterns on white digital background.
00:15
HD
Stock market trading chart with candlestick patterns and trend lines on dark background. 4K. 2D Animation. Flat Animation. Seamless Loop.
00:10
HD
Financial stock market chart with rising blue bar graphs
00:06
HD
Candlesticks patterns, day trading
00:08
HD
Colorful financial candlestick chart with blue, orange, and red bars showing market trends, data analysis, dynamic trading activity, investment insights, and trend lines for comprehensive market
00:10
HD
financial trading chart displaying candlestick patterns and moving averages on screen
00:10
HD
Dynamic candlestick stock chart with red blue bars trend line overlay on glowing dark grid background
00:10
HD
Closeup of hand writing letter on paper scroll, ancient scroll and clay oil lamp
00:07
HD
Graph with red and blue lines that are all over the screen. The graph is showing a stock market and the lines are showing the highs and lows of the stock
00:10
HD
Dynamic video concept of a stock market graph, shot at a close-up angle, showcasing fluctuating data lines and candlestick patterns. Live desktop wallpaper.
00:09
HD
Dynamic green financial chart with rising candlesticks glowing grid, and fluctuating lines climbing
00:08
HD
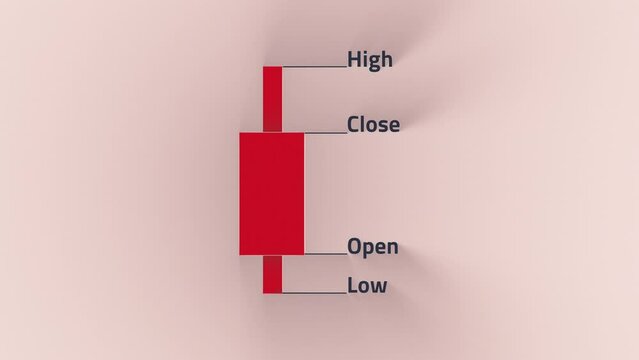
Candlestick Patterns for Traders. Candlestick chart for cryptocurrency, stock, forex. Cryptocurrency Trading chart learning. open and close chart. High and Low. 3D Animation Render.
00:07
HD
Shooting star candlestick pattern forming at top of uptrend, bearish reversal signal
00:08
HD
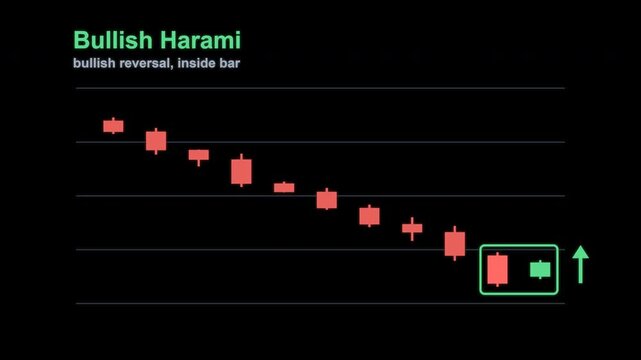
Bullish Harami Candlestick Pattern Trading Chart Labeled Animated Overlay Alpha 4K
00:07
HD