En e-post med en kobling for å angi passordet har blitt sendt til: Du trenger et passord for å få tilgang til kjøpene dine i fremtiden.
Få 10 Stock-bilder med en gratis prøveversjon
Nye filtre er lagt til
Sorter etter

200 792 treff for increase and decrease i alle

19 473 resultater i video
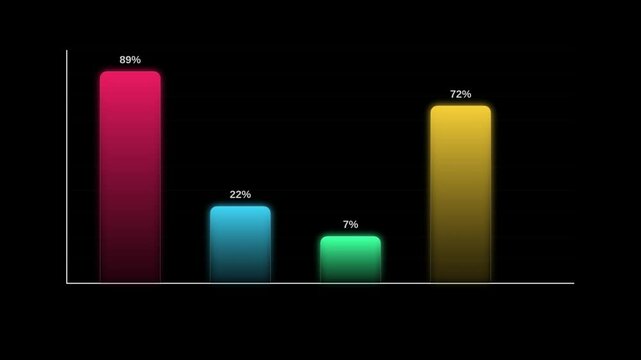
Animated Bar Chart Showing Data Changes Over Time Business Growth and Analysis
00:08
HD
Corporate Earnings Growth Graph Animation with Financial Data Visualization
00:09
HD
Currency exchange icon with two dollar coins and red green arrows in purple outline for money transfer forex finance trading and banking concepts
00:10
HD
Business growth arrow and graph chart, Business line arrow, improvement, business strategy, arrow rising up. Arrows animation on transparent background, Set of animated arrows on alpha channel, 4k.
00:08
HD
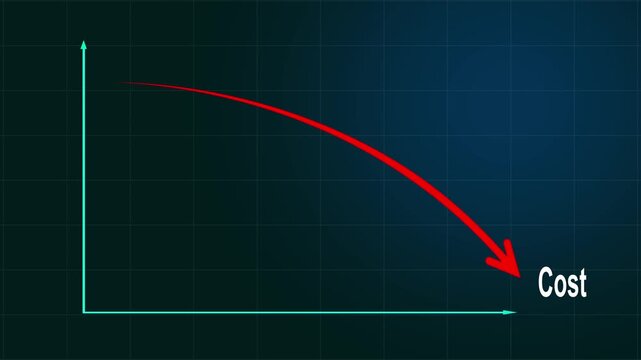
Abstract increase icon on green background. Dollar rate up looped icon. Reduce costs sign and symbol. 4k video animation
00:06
HD
Line graph animation displays fluctuating financial market waves on grid. Corporate economic trading data tracks across this line graph. Analytics update on the line graph.
00:08
HD
Bar chart columns animation shows currency dollar marks. Business revenue analytics track on bar chart columns animation. Profitable economic investment growth drives columns.
00:06
HD
Abstract increase icon on green background. Dollar rate up looped icon. Reduce costs sign and symbol. 4k video animation
00:06
HD
Climate Change Bar Chart: Rising Temperatures and Global Warming Trends
00:10
HD
Animated Red Bar Chart with Percentage Symbols Business Growth and Data Analysis Concept
00:05
HD
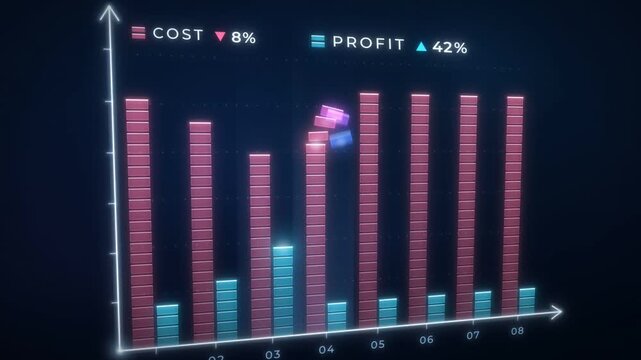
Cost and profit bar chart, cost bars shrink as profit bars grow until trend lines cross at break even point
00:16
HD
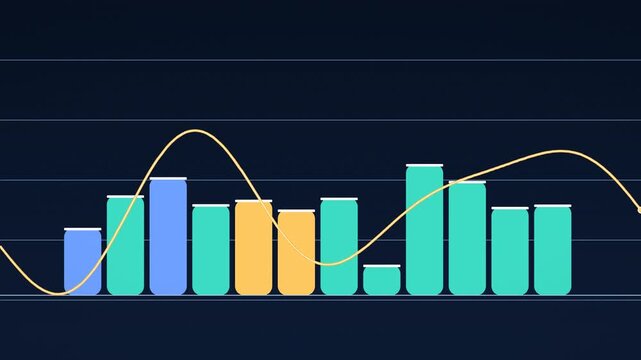
Financial bar chart with rising and falling line graph, colorful business data visualization on dark background, modern corporate infographic animation
00:08
HD
Line graphs animation displays fluctuating financial market data on dark. Corporate business revenue performance metrics update on line graphs. Investment drives graphs.
00:06
HD
Falling Bar Chart Icon with Downward Arrow on Green Screen
00:10
HD
Financial decline concept with falling red arrow.Representing business loss, economic downturn, falling profits, reduced savings and recession
00:10
HD
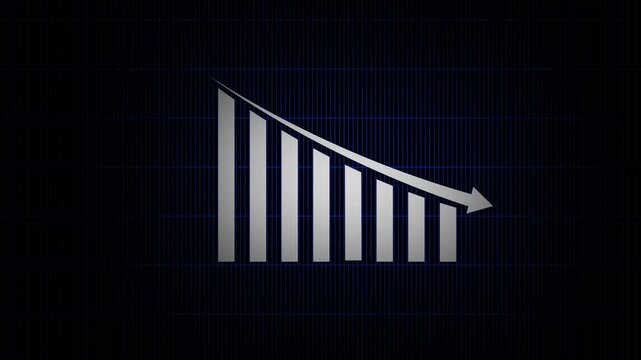
Bar Chart Decline Animation
00:06
HD
Revenue and Profit Growth Animation for Corporate Business Reports
00:08
HD
Animated bar chart icons showing decline, stability, and growth over time
00:06
HD
Abstract Motion Graphics of red glowing bar chart data on a dark brick wall background loop.
00:10
HD
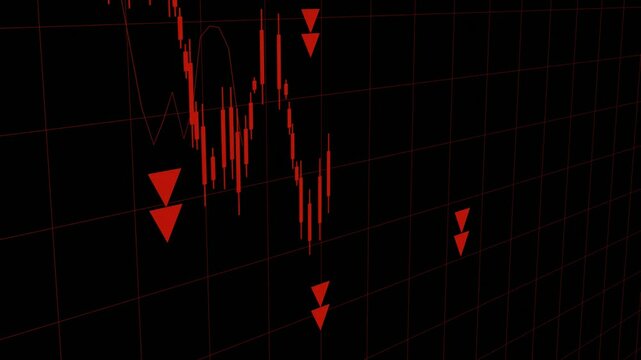
Red price falling drop candlestick down trend new low chart decreasing trend showing unsuccessful performance and losses failure due to economic crisis loss of assets in equities stock
00:24
HD
Business Analytics Dashboard Motion Graphic with Growth Statistics
00:10
HD
Businessman holding tablet with increasing arrow and carbon reduction for decrease .upload arrow inside a black cloud icon on a white background.
00:10
HD
Business arrow and graph chart, Business line arrow business strategy, arrow down animation.
00:08
HD
green energy zero emission carbon co2 reduction graph charts,business man at laptop computer using virtual touch screen to show alternative energy growth
00:08
HD
Business Analytics Dashboard Motion Graphic with Growth Statistics
00:10
HD