En e-post med en kobling for å angi passordet har blitt sendt til: Du trenger et passord for å få tilgang til kjøpene dine i fremtiden.
Få 3 videoer eller 25 bilder med en Prøv gratis
Nye filtre er lagt til
Sorter etter

43 674 treff for vector graphs i videoer

Line graph. Linear chart growth, business diagram graphs and colorful histogram graph isolated vector set
00:05
HD
Speedometer needle moves from red to green. The needle shows performance levels. Perfect for progress, efficiency, or health indicators. Great for business, tech, or fitness projects
00:08
HD
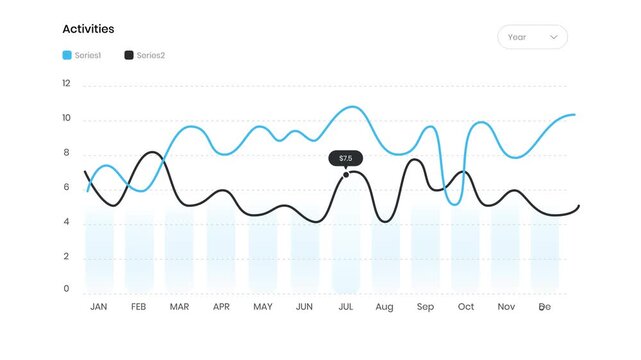
User Analytics Hub Marketing Social Performance Dashboard with Moving Line Graph Trend and Engagement Feed Activity Stream Notification Animation
00:08
HD
black and white abstract background vector with Animated Charts
00:10
HD
Digital financial analysis charts and graphs viewed through a magnifying glass creating an insightful financial concept
00:10
HD
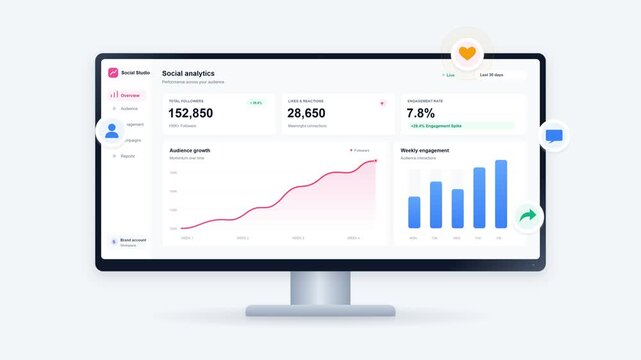
A premium 4K flat vector motion graphic illustrating a modern social media analytics dashboard on a sleek desktop monitor. Features dynamic upward engagement growth charts, staggered bar graphs
00:10
HD
Stats dollar vector icon.Vector icons set of a graph of rising and falling dollar currency. The graph shows up and down arrows .
00:05
HD
Automated warehouse optimization tracking system showing moving packages on conveyor belts with neon interface graphs and digital readouts displayed across a dark gradient studio lighting setup
00:06
HD
Flat vector illustration of a robot assistant beside a cloud protection dashboard with database, shield, folder, and key icons, representing secure cloud management, access control, and automation.
00:10
HD
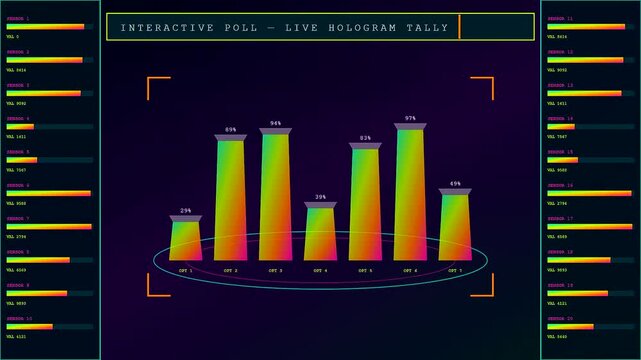
a colorful digital interactive poll shows changing bar graphs and live statistics on a dark computer screen interface used for analyzing user opinion data
00:06
HD
Flat design tablet dashboard with animated charts and metrics
00:05
HD
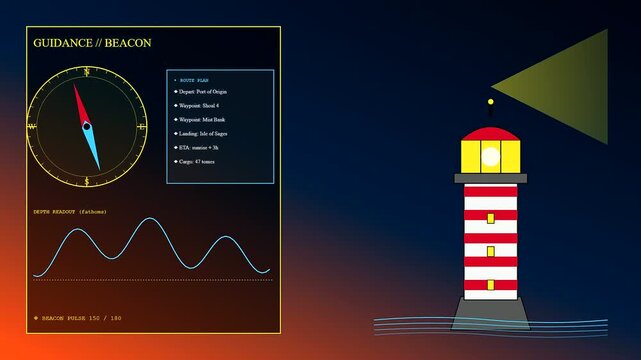
A knowledge retrieval interface displays navigation metrics for a lighthouse beacon while tracking maritime positions through circular compass data and oscillating wave line graphs in motion
00:06
HD
Statistic graph icon set in thin line style. Business data analysis, finance growth, and market trend motion grapic animation
00:10
HD
A glowing digital diploma icon appears in a sequence of neon user interfaces showcasing data metrics and animated graphs against a dark moody gradient field
00:06
HD
Glowing neon line market Recovery Concept. Successful growth trend red line graph going Up. Abstract neon line arrow. animation
00:10
HD
Downward trend graph animation video on a white background
00:06
HD
Animated chat bot interface showing customer support dashboard with data graphs and messaging flow.
00:15
HD
Colorful neon financial reporting dashboard with donut pie chart, audio bars, and line graphs
00:15
HD
Digital fingerprint biometric validate sequences displayed as circular scan gauges with glowing neon purple and cyan line graphs within a dark virtual computer interface environment monitor
00:06
HD
Financial stock market green line graph rising steadily in a digital animation video showing positive growth and high trading volume
00:10
HD
Dark mode vector UI dashboard with financial data graphs and HUD elements
00:10
HD
Retro Futuristic Weather Forecast Interface and Analytics Loop
00:15
HD
Glowing neon line market Recovery Concept. Successful growth trend red line graph going Up. Abstract neon line arrow business graph on dark black background.
00:10
HD
sleek modern infographic element vector motion graphic background
00:30
HD
vector illustration of a pencil
00:12
HD
Dynamic business dashboard UI interface design vector illustration showing financial analytics charts and modern motion render graphics
00:10
HD
vector illustration of a graph
00:08
HD
Modern Tech Interface Featuring Vibrant Neon Bar Graphs and Fluctuating Curve Lines for High-Tech Data Visualization and Real-Time Business Performance Monitoring.
00:06
HD
Animated illustration of a social media analytics dashboard with charts and engagement icons on desktop monitor, suitable for marketing and business concepts.
00:10
HD
Dynamic motion of colorful bar graphs illustrating data analysis and digital visualization.
00:10
HD
vector illustration of an abstract background with graphs
00:10
HD
A vibrant digital audio console interface displays evolving sound spectrum graphs and illuminated geometric speaker diagrams across three sequential glowing monitors in a modern neon dark environment
00:06
HD
3D business infographic line graph with data animation elements on a white background. Futuristic financial chart HUD interface loop.
00:12
HD
High inflation up red arrow. Increase profit, growth arrow and inflation graph neon animation on black background .
00:10
HD
A gesture programming interface displays dynamic sine wave data movements alongside shifting impulse vector bar graphs within a vibrant blue digital motion graphics software control panel environment
00:06
HD
Flat vector browser window showing data analytics dashboard with pie chart and mountain graphs
00:10
HD
Smartphone interface displays analytical data dashboard with colorful animated graphs and modern user elements in this digital motion graphics video
00:10
HD
Futuristic digital dashboard hud display with glowing business analytics charts and data graphs
00:15
HD
A digital vulnerability scan interface shows glowing charts and circular nodes inside a dark environment featuring shifting pyramid graphs and changing data points with illuminated neon colors
00:06
HD
Glowing neon Success stairs sign with flag icon animation  Neon glowing Person Climbing Stairs Towards Success flag, Glowing neon business graph chart concept. on black background ,4k video
00:10
HD
heart beat on ecg vector. Red heartbeat line icon. vector illustration,on alpha transparent background
00:10
HD
A collection of colorful digital data visualization dashboard elements featuring various charts graphs and analytical components on a dark background
00:10
HD
Dynamic pricing interfaces display complex stock data with financial lists and digital graphs appearing in a colorful neon UI design for modern e commerce analytical software
00:06
HD
Business growth arrow animation. Up arrow animation on black background. Arrow rising growth chart of economy icon black color animated.
00:10
HD
Sound signal. Graphic animation White on black background sound waves. 2D rendering.
00:10
HD
Dashboard UI panels with financial charts and analytics graphs
00:06
HD
Arrow line graph mountain logo figure style design gesture depth layers emotion frame backgrounds motion isolated on green screen background
00:06
HD
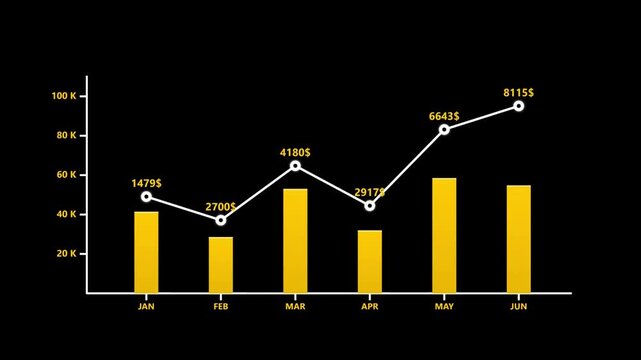
Financial chart and bar graph vector illustration. Features yellow bars and white line graph with data points on a black background. Clean design for business analytics and corporate reports.
00:08
HD
Flat vector animation of a desktop analytics dashboard with charts, notification bell, chat bubbles, and email icons. Concept of alerts, communication, and real time business updates.
00:10
HD
Up arrow animation on green background. direction arrow icon motion. Up arrow isolated. swipe up pointing video footage-4k green background icon animation
00:10
HD
vector illustration of a business graph with Chart Data Interaction Effects
00:10
HD
Digital displays showing an interactive poll with vibrant glowing graphs and fluctuating sine wave animations across three separate screens in a dark room setting for analysis
00:06
HD
A clean, dynamic 2D vector animation of a financial growth chart. Watch as corporate blue bar graphs cascade upwards, culminating in the satisfying pop-up payoff of a golden dollar coin. Designed with
00:05
HD
Twin monitors on a shared desk glow with an AI agent pipeline builder and a coloured node graph as blurred teammates move behind them inside a dark AI startup office.
00:11
HD
Futuristic digital head up display interface showcasing glowing blue financial growth bar charts circular loading metrics and animated wave line graphs designed for corporate data analytics
00:15
HD
Vector Space Elegance: Knowledge Graph Embeddings Visualized
00:05
HD
Futuristic technology user interface displaying glowing vector data graphs
00:10
HD
Abstract white glowing down arrow icon animation.Animated arrow pointing down on black background.4k video.
00:10
HD
Complex digital biometric validate interface showing moving wavy neon lines and segmented graphs on a dark screen panel for advanced data monitoring and system analysis
00:06
HD
A clean, modern 2D vector animation featuring banking, finance, security shields, credit cards, coins, and data graphs looping seamlessly for corporate videos and financial presentations.
00:10
HD
Animated network nodes form glowing lattice in motion.
00:15
HD
Electronic music equalizer display panel vector illustration
00:15
HD
loading circle vector. symbol, sign.Loop animation circle ring digital elements.download and streaming video buffering round progress bar.
00:10
HD
Sales performance graph animation cartoon style
00:10
HD
Minimalist Business Analytics Dashboard on Laptop Screen Silhouette Motion Graphic Element
00:08
HD
Animated horizontal timeline with pointers by year. Company development steps concept, Animated timeline. 4K animation
00:08
HD
Colorful business data charts and financial graphs moving dynamically in digital animation video clip
00:08
HD
abstract background vector illustration
00:15
HD
Flat vector animation of a desktop analytics dashboard with charts and graphs. Concept of business performance tracking, data analysis, and digital reporting interface.
00:10
HD
Financial growth graph animation showing percentage increase with stack of coins in blue motion footage
00:08
HD
Epidemiology monitoring dashboard mapping infectious disease outbreaks and public health transmission data.
00:14
HD
Arrow up business graph icon animation. Increasing business growth chart animation. Going up business graph concept. By Motion expert.4k video
00:10
HD
vector abstract background
00:10
HD
Line graph. Linear chart growth, business diagram graphs and colorful histogram graph isolated vector set
00:05
HD
Autumn fog blanket displays geometric forest silhouettes in a vibrant synthwave aesthetic with digital interface line graphs tracking environmental data across changing seasonal landscape visuals
00:06
HD
A digital stress assessment interface displays flickering bar graphs and glowing neon numeric data values in a dark environment with shifting red thermometer gauge UI elements
00:06
HD
Financial growth chart with rising statistics and animated bar graphs displaying business analytics inside a clean dashboard
00:11
HD
vector illustration of business graph
00:15
HD
A digital vulnerability scan interface shows animated glowing insect icons with colorful bar graphs and oscillating waveform displays on a dark monitor during software diagnostic analysis
00:06
HD
Abstract business graph icon animation background. An illustrative chart showing marketing, sales, and profit growth toward future targets, suitable for business development concepts.
00:10
HD
medical dashboard UI interface, clean minimalist flat vector design, advanced healthcare data analytics and patient monitoring, featuring heart rate graphs and vital
00:10
HD
Stock market or forex trading graph. Chart in financial market vector illustration Abstract finance background. concept as Stock market or forex trading graph in financial market vector illustration w
00:10
HD
Animated infographics displaying dynamic financial analytics charts and statistics in vector motion footage loop
00:11
HD
Dynamic financial dashboard with animated charts and graphs on white grid background.
00:10
HD
musical sound wave beat abstract background
00:10
HD
line audio wave visualization on a transparent background,Audio Sound waves moving motion animation. Sound wave audio spectrum, audio waveform spectrum animation.
00:10
HD
Data infographic presentation screen demonstrating corporate statistics with animated percentage charts and graphs
00:15
HD
Set of glowing blue neon data charts and digital info graphs with futuristic interface elements
00:10
HD
Modern flat vector animation featuring a laptop dashboard with social media, engagement, and analytics icons. Ideal for digital marketing, audience growth, performance tracking, and business insights
00:10
HD
An evolving geometric chart mapping math vectors and numeric intersections along coordinate lines. Tailored for software developer backgrounds and sci-fi movies.
00:20
HD
Dark mode tactical HUD interface featuring rotating radar data graphs
00:10
HD
A detailed hydrogen electrolysis process displayed with luminous neon graphs and wave patterns across three screens showing fluctuating chemical reactions in a dark laboratory setting
00:06
HD
Flat vector business collaboration animation with hands assembling a colorful line graph chart
00:14
HD
A digital virtual showroom display features neon cycle line graphs and glowing waveform monitor patterns across a dark gradient interface in this complex motion graphics sequence
00:06
HD
Digital screen glows with complex financial data
00:34
HD
Catastrophe mapping display shows multiple spinning storm vortex simulations with numerical pressure data and rotating circular graphs isolated on a dark digital interface during scientific analysis
00:06
HD
scientific conference like DNA, microscope, and data charts Flat 2D vector outline illustration animation
00:11
HD
Market Recovery Concept. Successful growth trend Green line graph going Up. Abstract Neon Arrow, Business Chart, and Successful Trend Visualization on Black Background. 4K video.
00:10
HD
Digital sentiment analytics dashboard displays complex neural network nodes and colorful bar graphs showing changing data trends in a dark virtual interface environment simulation loop
00:06
HD
Flat vector a creative design team is collaborating on a project, using computers and online tools for data analysis, chart presentations, and strategic planning in a modern office workspace
00:07
HD