En e-post med en kobling for å angi passordet har blitt sendt til: Du trenger et passord for å få tilgang til kjøpene dine i fremtiden.
Få 3 videoer eller 25 bilder med en Prøv gratis
Nye filtre er lagt til
Sorter etter

13 153 treff for utilization i videoer

Freshly cut tree stump on forest floor for deforestation concept
00:11
HD
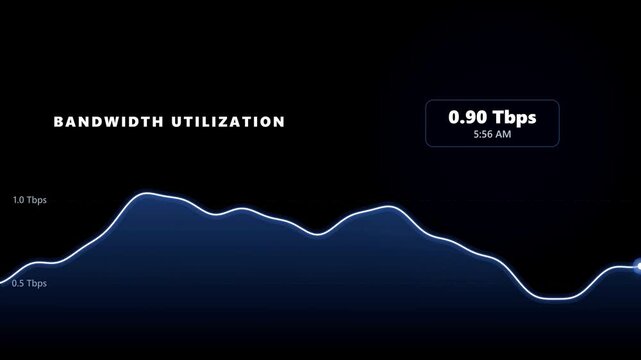
Dynamic area chart displaying network bandwidth utilization
00:10
HD
Road capacity indicator updates 68 percent utilization
00:09
HD
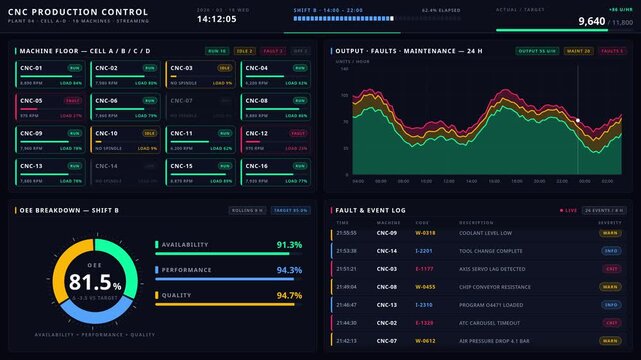
CNC factory dashboard showcasing a comprehensive command center view with utilization tracking, fault monitoring, maintenance schedules, and output metrics in a detailed 4-quadrant layout.
00:15
HD
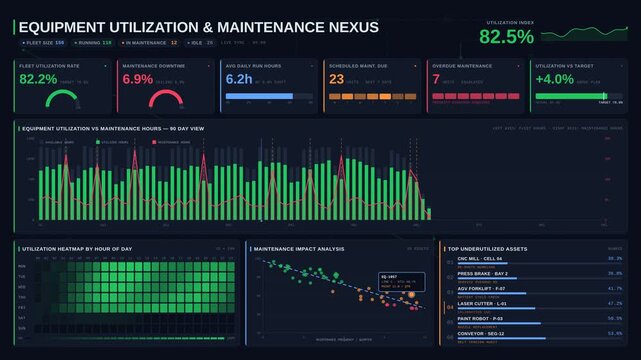
A detailed equipment utilization and maintenance dashboard featuring real-time analytics in a dual-theme design with vibrant colors and dynamic visual elements.
00:15
HD
Database storage index and disk utilization HUD on green screen 4k
00:06
HD
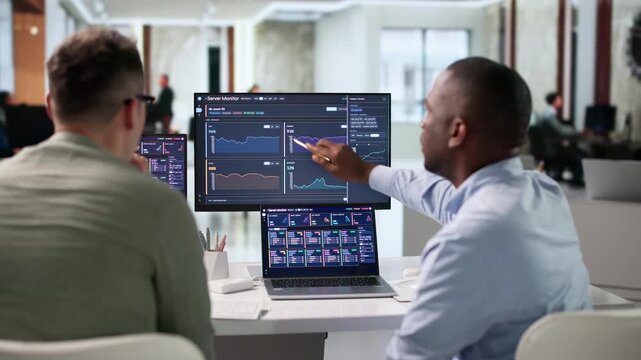
IT Specialists Monitoring Server Performance Using Real-time Analytics
00:22
HD
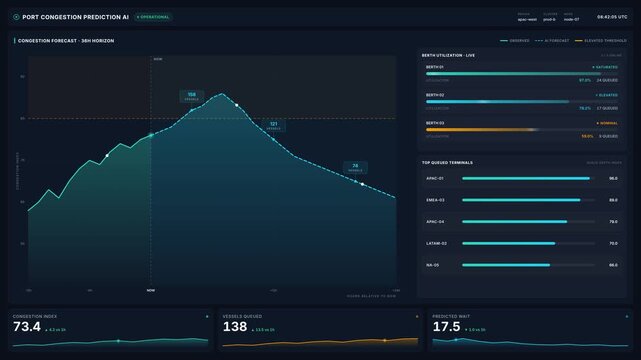
Port congestion prediction ai dashboard for vessel queue forecast berth utilization charts, for smart logistics, supply chain analytics, maritime data insights
00:20
HD
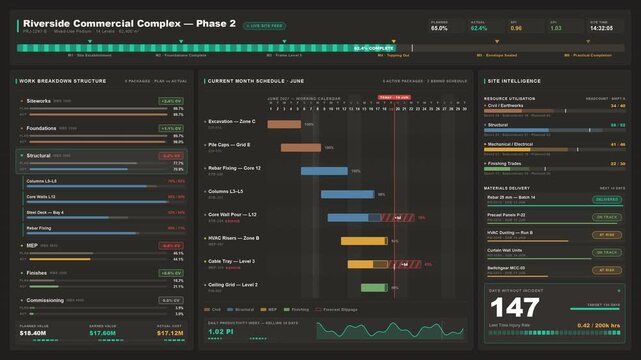
A detailed view of construction management software displaying project progress, site intelligence, and resource utilization for Riverside Commercial Complex Phase 2.
00:15
HD
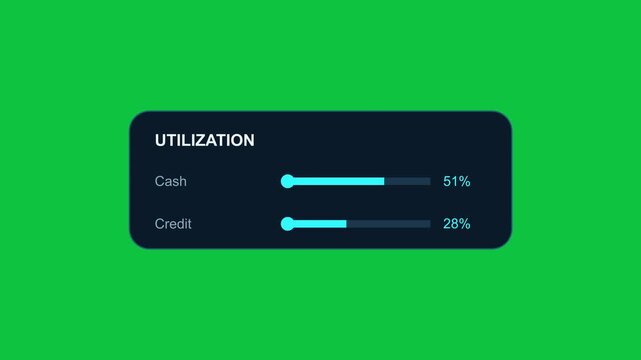
Utilization Chroma key green finance dashboard user interface with resource usage percentage, capacity levels, performance gauges and futuristic fintech motion graphics
00:10
HD
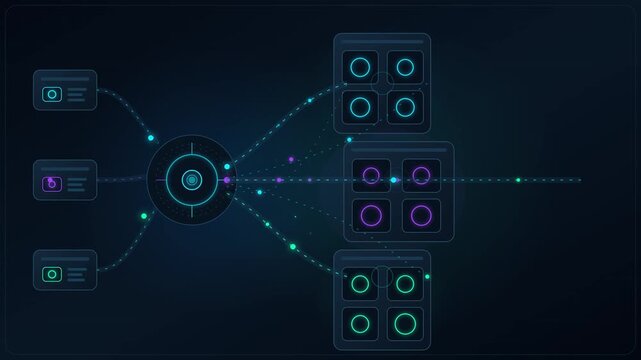
AI GPU resource orchestration system dynamically assigning computing workloads across distributed accelerator clusters and optimizing processing capacity
00:11
HD
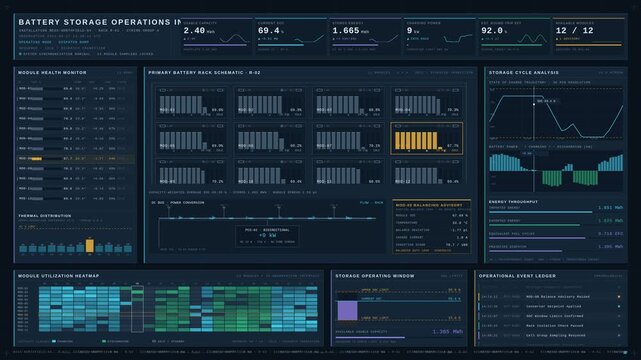
Explore an advanced battery energy storage operations dashboard featuring charging cycles, storage utilization trends, and real-time module health monitoring for industrial applications.
00:15
HD
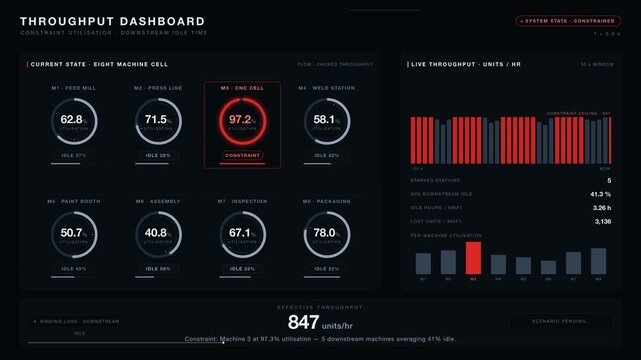
A high-tech throughput dashboard visually highlighting constraint utilization and downstream idle time with animated metrics and vibrant color contrasts in dark mode.
00:15
HD
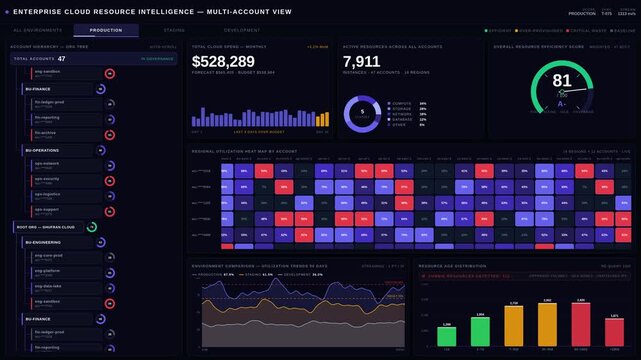
Enterprise cloud resource dashboard with multi-account views, regional heat maps, and utilization trends in a dark mode 4K interface for commercial creative technology and business use.
00:15
HD
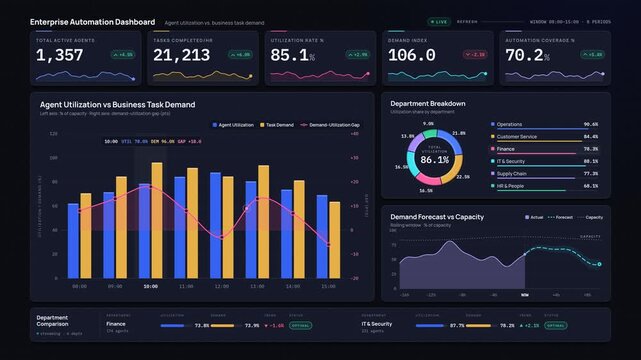
4K enterprise automation dashboard comparing agent utilization and business task demand with animated KPI tiles, dual-axis charts, donut graphs, and dark violet premium interface design.
00:15
HD
National Biodiesel Day for better utilization of alternative energy
00:11
HD
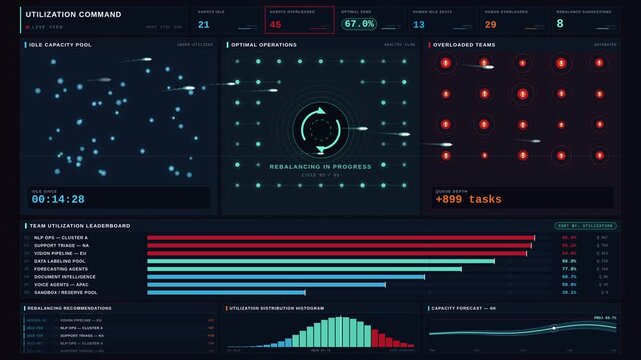
Dark mode AI workforce utilization dashboard with heat map zones showing idle blue and overloaded red team capacity metrics for commercial creative technology and business use.
00:15
HD
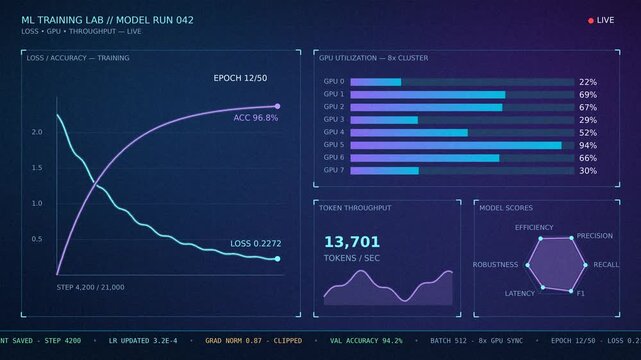
Machine learning training dashboard with loss and accuracy curves, GPU utilization bars and model performance metrics, animated data visualization
00:10
HD
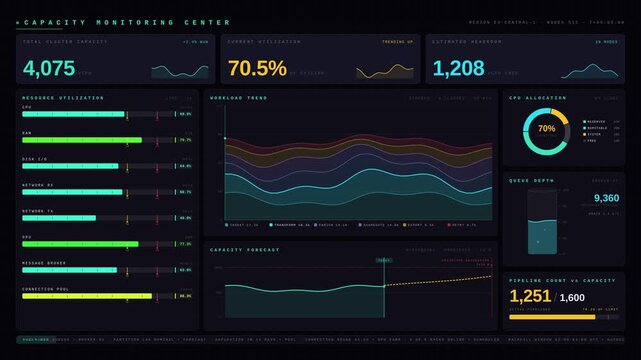
Dark mode infrastructure dashboard showing pipeline capacity, workload trends, and resource utilization with animated gauges and data visualization charts.
00:15
HD
Asset management system showing investment planning, financial goal tracking, ROI analysis, and performance monitoring for efficient resource utilization Marrow
00:10
HD
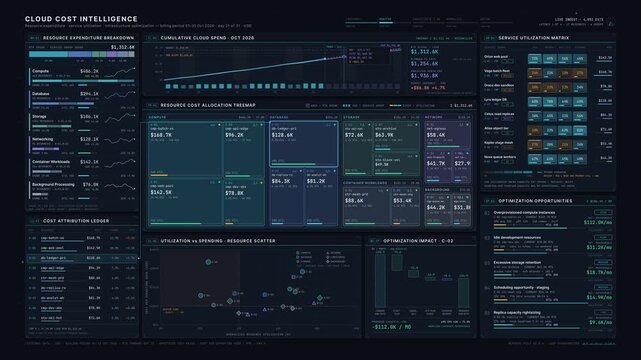
Premium dark mode cloud cost dashboard animation tracking resource spending, service utilization patterns, and infrastructure optimization opportunities in enterprise financial operations.
00:15
HD
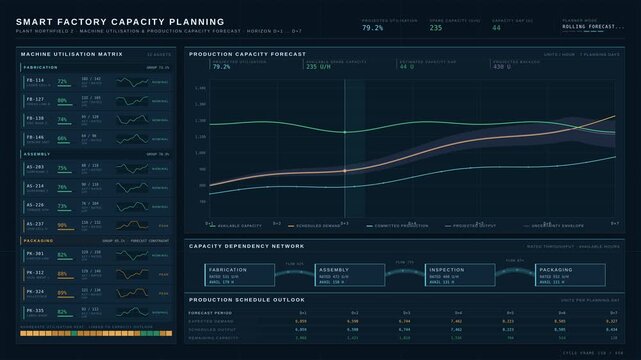
Smart factory dashboard showing machine utilization and production capacity forecasts with dark industrial analytics interface and animated data visualization.
00:15
HD
Rail capacity indicator updates 72 percent utilization
00:09
HD
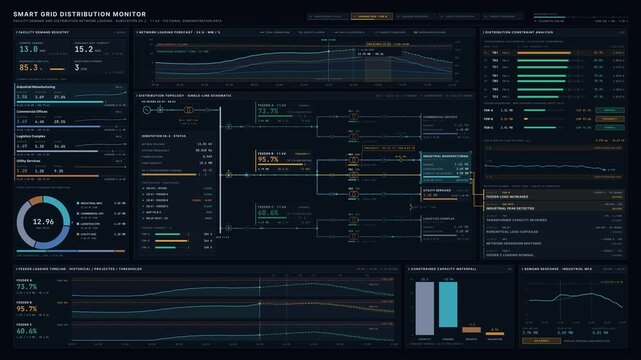
Smart grid dashboard visualizing facility demand, distribution network loading, and transformer utilization with dynamic data analytics for commercial creative technology and business use.
00:15
HD
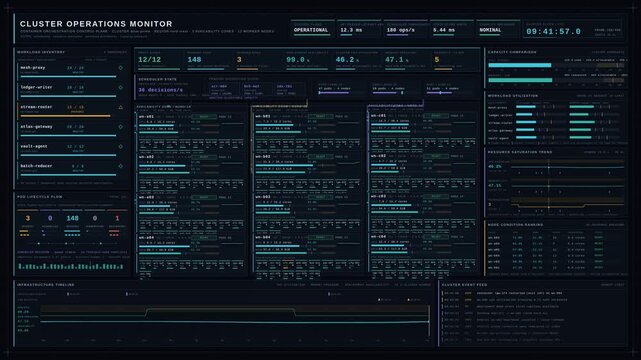
Sophisticated Kubernetes monitoring dashboard visualizing cluster health, resource utilization metrics, and workload distribution in a fictional container orchestration environment.
00:15
HD
GPU utilization meter reaches 100 percent capacity
00:14
HD
IT Engineer Carefully Monitors Network Performance Using Multiple Tools
00:22
HD
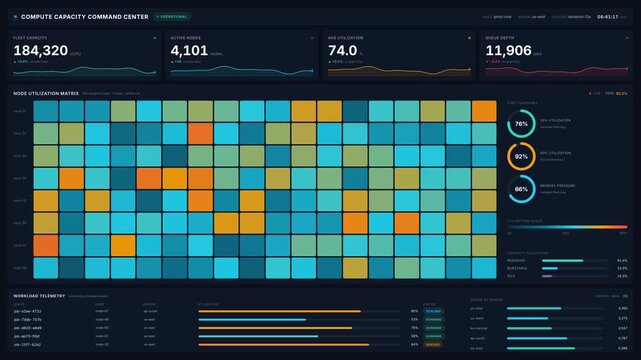
Compute capacity command center dashboard for live server utilization matrix telemetry, for cloud infrastructure monitoring, data analytics, network management
00:20
HD
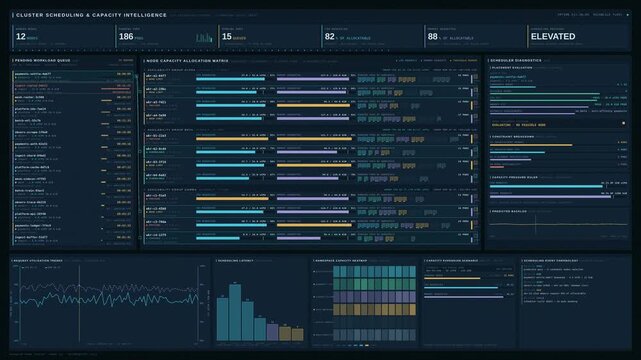
Premium 4K Kubernetes operations dashboard visualizing pending pods, scheduler placement, and cluster capacity pressure with detailed node utilization metrics.
00:15
HD
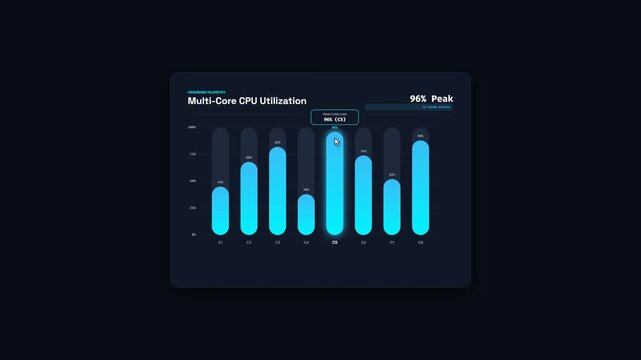
Multi Core CPU Utilization Animated Bar Chart UI Dashboard Monitor Analytics Motion Graphics 4K
00:08
HD
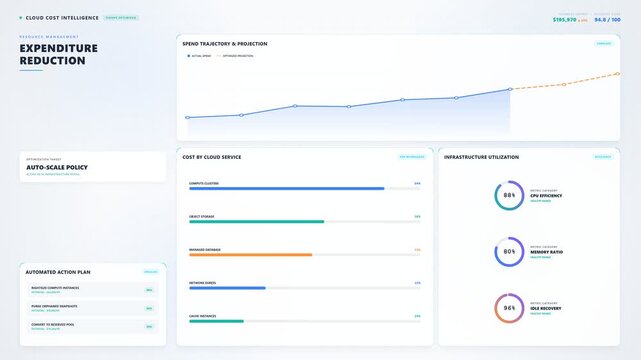
Cloud cost optimization dashboard in light theme with spend trend, savings counter, utilization rings and cost bars, loop
00:14
HD
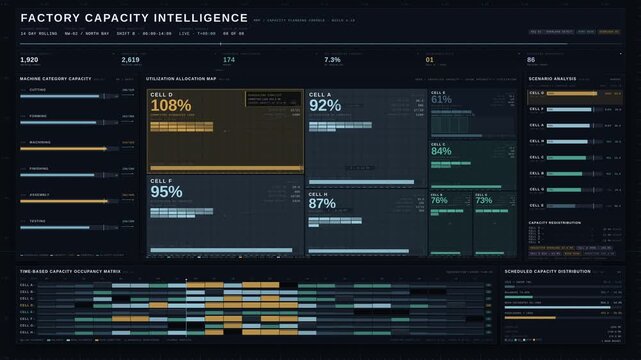
Cinematic factory capacity dashboard visualizing machine utilization across production cells with dark industrial palette and animated balancing scenarios.
00:15
HD
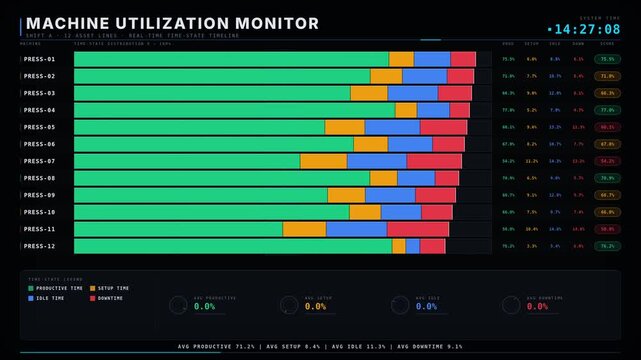
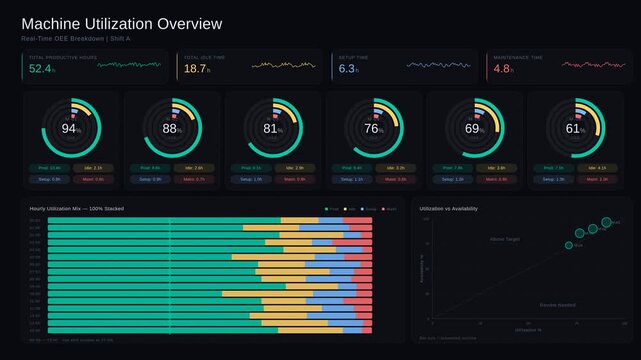
Dynamic machine utilization dashboard displaying productive, idle, setup, and downtime metrics with animated bar charts and real-time clock on a dark space background.
00:15
HD
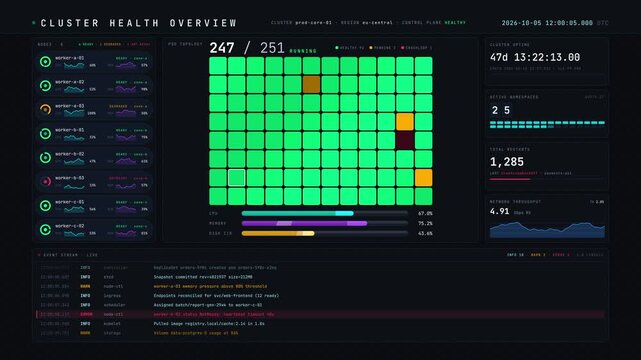
Cinematic 4K dark-mode Kubernetes cluster health dashboard showing nodes, pods, and resource utilization with real-time animated metrics and status indicators.
00:15
HD
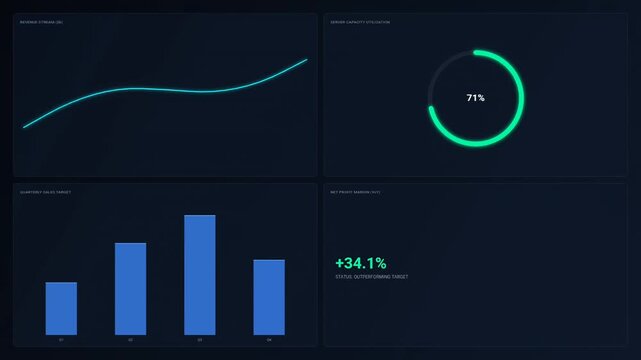
Executive Business Dashboard Grid Looping Animation With Revenue Line Chart Radial Gauge Quarterly Bar Chart And Profit Margin Indicator On Dark Glassmorphism Background For Corporate Analytics
00:05
HD
Premium factory capacity planning dashboard comparing theoretical production limits, scheduled capacity, and actual equipment utilization with detailed industrial data visualization.
00:15
HD
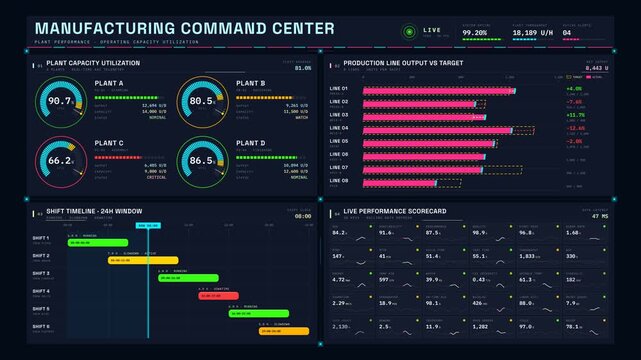
Manufacturing command center dashboard tracking plant performance and capacity utilization with animated gauges, 3D bar charts, shift timelines, and live data matrices in dark industrial UI style.
00:15
HD
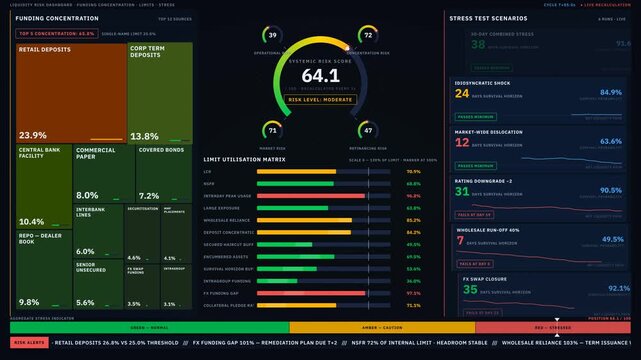
4K dark mode liquidity risk dashboard interface with funding concentration heatmap, limit utilization bars, and stress test scenario indicators for financial analysis.
00:15
HD
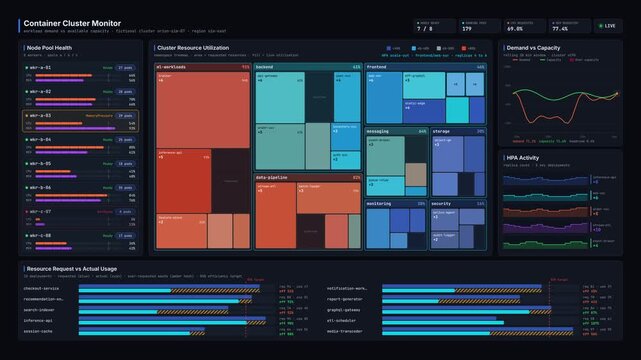
Kubernetes monitoring dashboard animation showing cluster resource utilization treemap, node health, and workload demand charts in dark mode for commercial creative technology and business use.
00:15
HD
Asset management system showing investment planning, financial goal tracking, ROI analysis, and performance monitoring for efficient resource utilization Marrow
00:10
HD
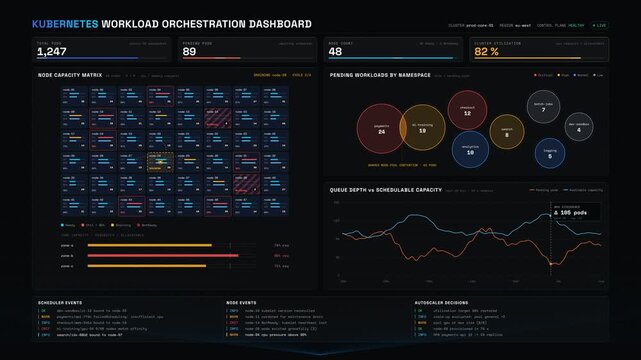
Kubernetes operations dashboard showing pending workloads and node capacity with animated charts, KPI counters, and cluster utilization metrics in a dark 4K interface.
00:15
HD
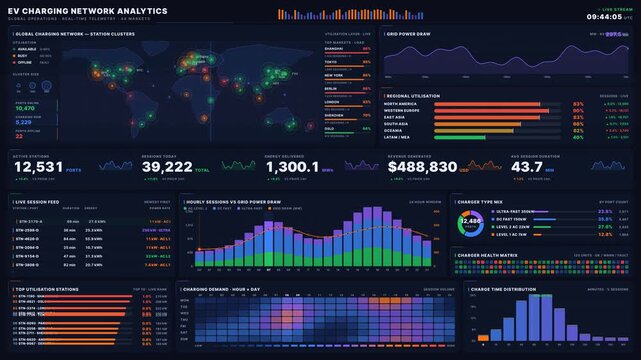
Explore the advanced analytics dashboard for an EV charging network featuring vibrant visualizations, key metrics, and real-time data on station utilization and performance.
00:15
HD
Sea capacity indicator updates 86 percent utilization
00:11
HD
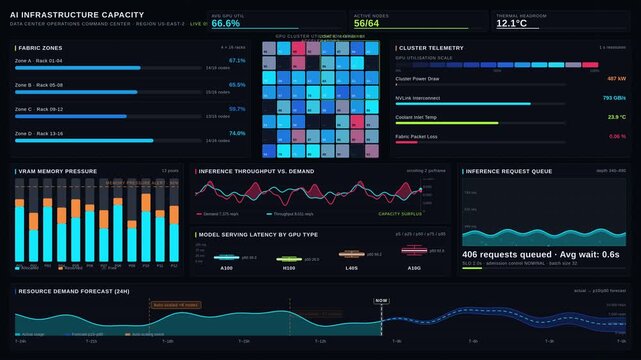
4K animated AI infrastructure dashboard showing GPU cluster utilization grid, VRAM memory pressure, inference queue, throughput chart, and 24-hour demand forecast with neon cyan and dark tech.
00:15
HD
National Biodiesel Day for better utilization of alternative energy
00:11
HD
european server utilization map cycles through regional percentages
00:14
HD
Woman suffering from depression and crying alone, representing mental health struggles, family problems, emotional abuse, stress, trauma, loneliness, and recovery.
00:23
HD
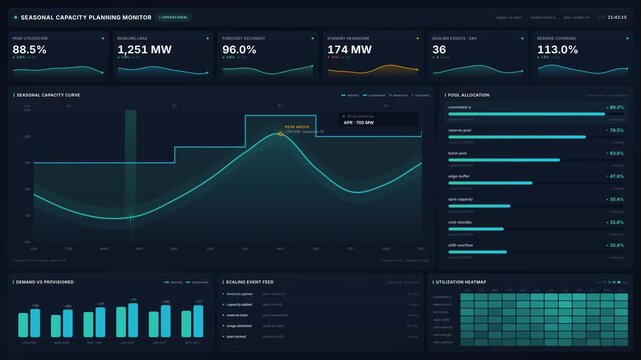
Seasonal capacity planning dashboard with utilization curves, load forecasts, pool allocation charts, for data analytics, resource management, operational efficiency
00:20
HD
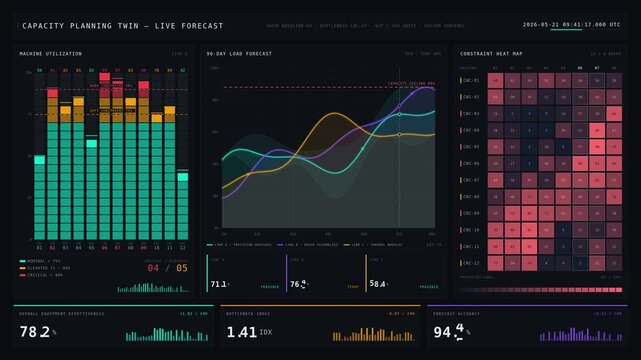
A sleek dark mode capacity planning twin dashboard animation showcasing machine utilization and constraints forecasting with vibrant color gradients and smooth transitions.
00:15
HD
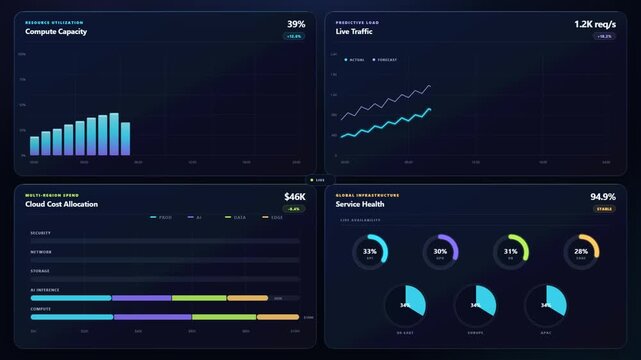
Cloud infrastructure dashboard animates capacity, traffic, cost, and service metrics
00:15
HD
GPU utilization dashboard reports 91 percent active load
00:11
HD
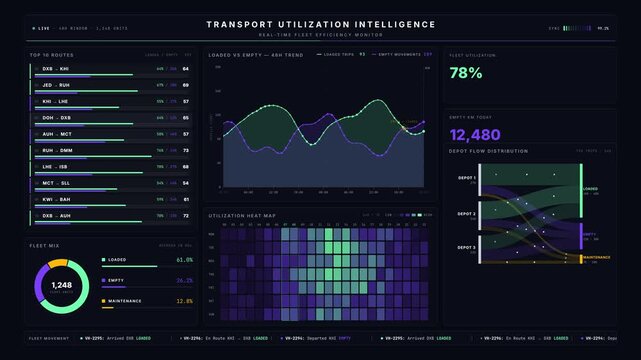
Transport utilization dashboard animation comparing loaded trips with empty vehicle movements, dark glassmorphism interface with lime and violet data visualization.
00:15
HD
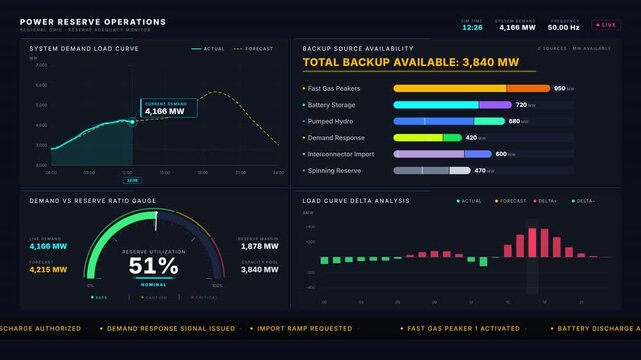
Power reserve dashboard animation showing demand load curves rising with animated backup source bars and reserve utilization gauge on dark UI background.
00:15
HD
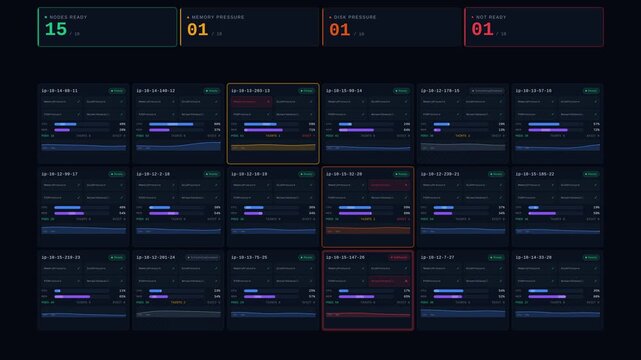
4K Kubernetes node reliability dashboard with pressure conditions, taints, utilization bars, and failure alerts on a dark grid background for commercial creative technology and business use.
00:15
HD
Car rental fleet management dashboard animation showing booking funnel vehicle utilization and revenue breakdown for transportation business analytics
00:12
HD
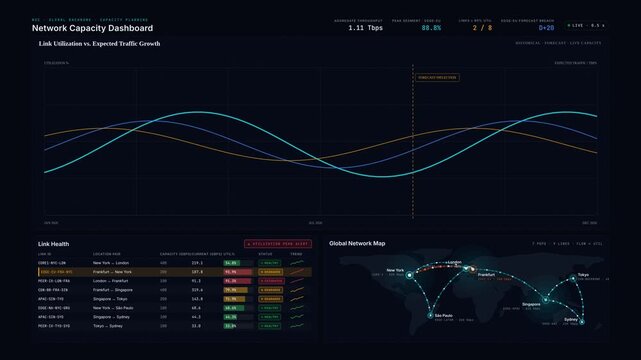
Network capacity dashboard comparing link utilization with expected traffic growth, featuring live charts, health tables, and geographic map animations in a dark cyber aesthetic.
00:15
HD
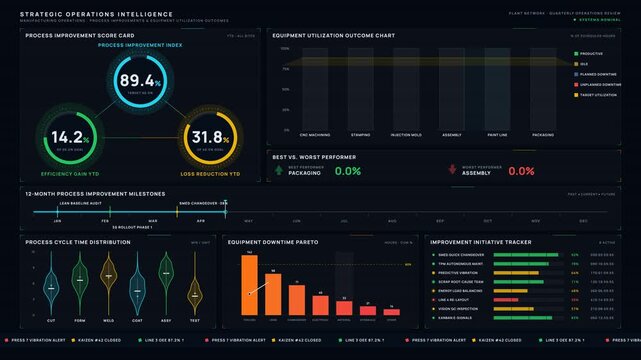
Seamless loop of a 4K manufacturing operations dashboard displaying process improvement gauges, equipment utilization charts, and timeline analytics on a deep navy background.
00:15
HD
Dashboard 5 futuristic HUD interface on white background with cash flow trends, forecast charts, utilization metrics, digital controls and modern technology motion graphics
00:10
HD
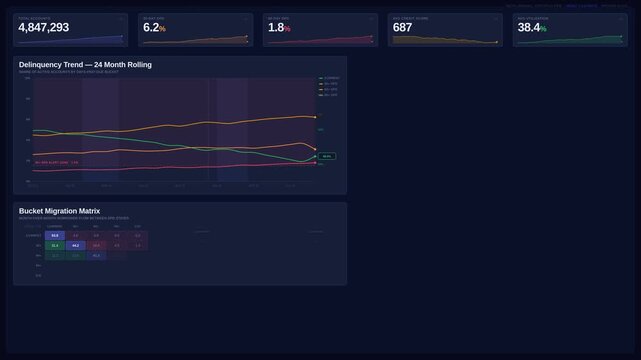
Explore a comprehensive consumer credit analytics dashboard showcasing delinquency scores, utilization metrics, and repayment behavior with vibrant, professional aesthetics.
00:15
HD
Asset management system showing investment planning, financial goal tracking, ROI analysis, and performance monitoring for efficient resource utilization Marrow
00:10
HD
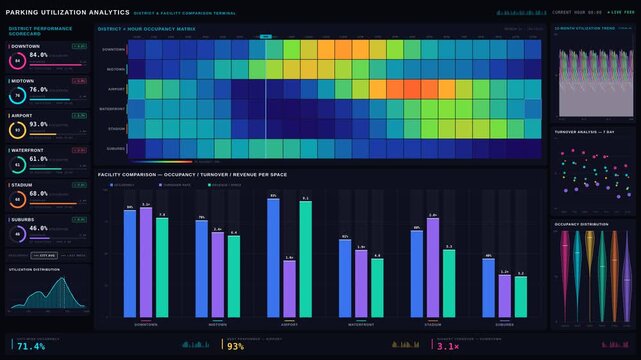
Explore a premium dark-mode parking utilization analytics dashboard that compares district facilities' occupancy and turnover trends with animated data visualizations and strategic insights.
00:15
HD
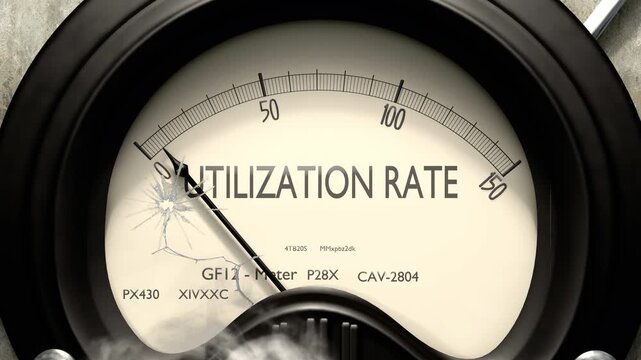
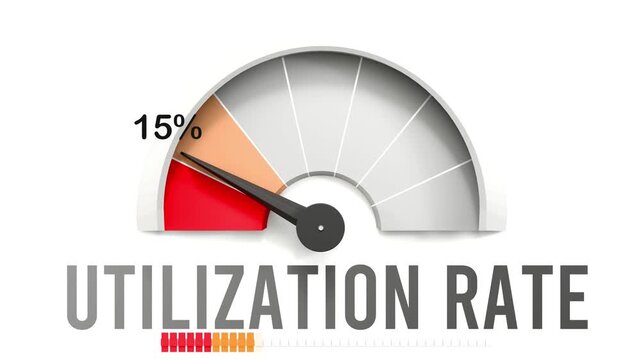
Utilization rate meter showing low levels of utilization rate. Minimum and decreasing utilization rate value, below the norm. Lack of utilization rate. None of it, insufficient.
00:08
HD
Facility control grid reports 71 percent rack utilization
00:13
HD
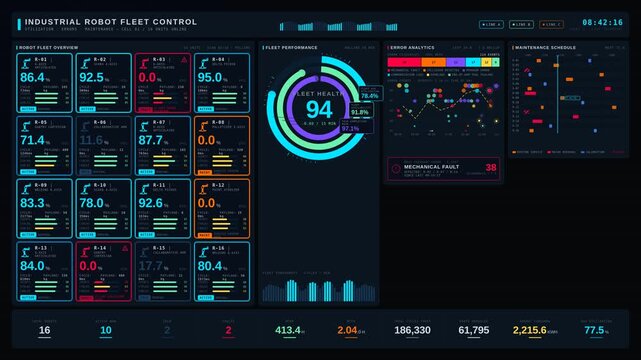
Explore a high-tech industrial robot fleet management dashboard showcasing utilization stats, error analytics, and maintenance schedules in a dark, dramatic setting with ambient lighting.
00:15
HD
National Biodiesel Day for better utilization of alternative energy
00:11
HD
China server utilization alternates between 86 and 87 percent
00:12
HD
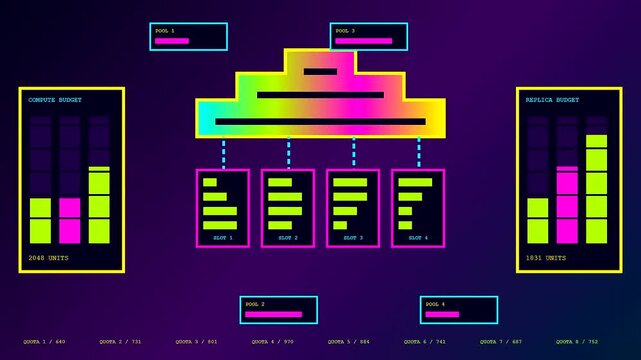
Digital cloud orchestration interface displays dynamic data flow through animated neon charts showing server utilization metrics across multiple server pools in a dark purple abstract environment
00:06
HD
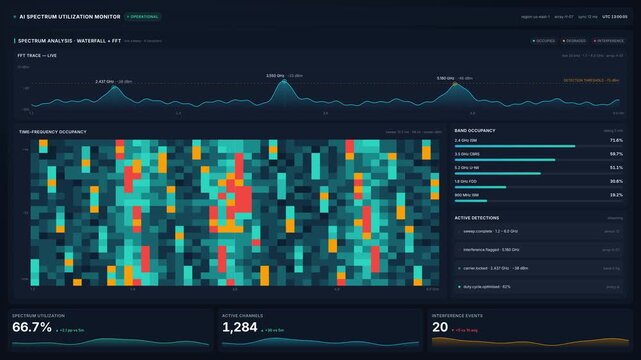
Ai spectrum utilization monitor dashboard for live fft trace time frequency waterfall heatmap, for radio frequency analysis, signal detection, network monitoring
00:20
HD
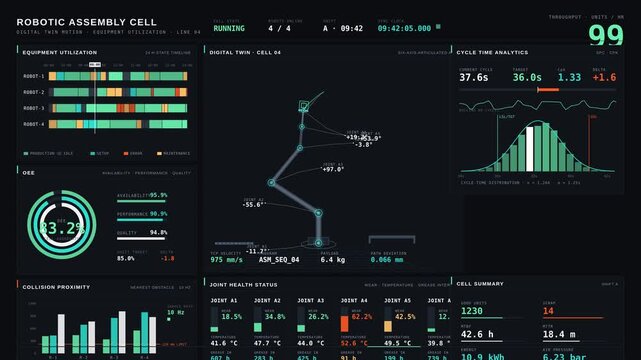
A sleek robotic assembly cell dashboard visualizes a digital twin in motion with equipment utilization metrics, displaying real-time analytics and performance indicators.
00:15
HD
Data visualization dashboard displaying global network performance metrics
00:13
HD
Resource planning concept with business icons showing capacity allocation, asset utilization, scheduling, and operational efficiency.
00:10
HD
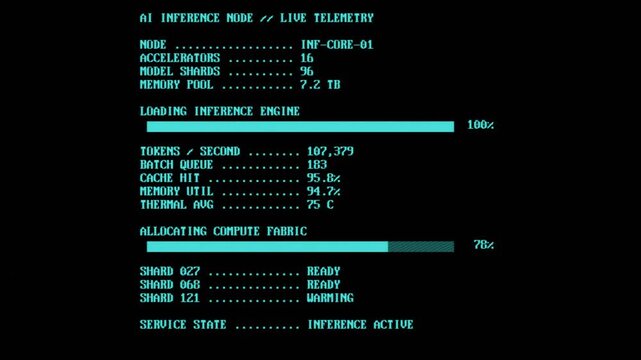
Futuristic cyan CRT terminal displaying artificial intelligence inference server telemetry with GPU accelerators, model shards, token throughput, memory utilization and live compute status.
00:08
HD
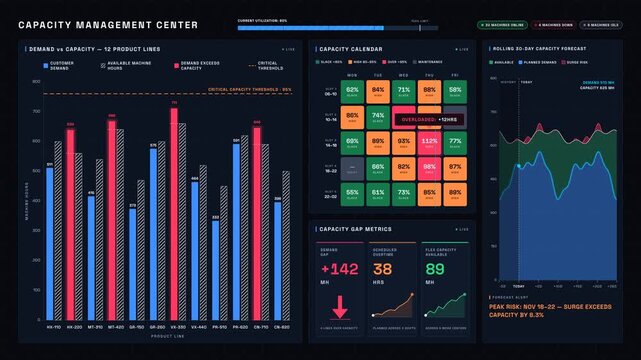
Executive manufacturing capacity dashboard comparing customer demand with available machine hours, featuring live bar charts, utilization metrics, and risk forecasts in a dark industrial 4K style.
00:15
HD
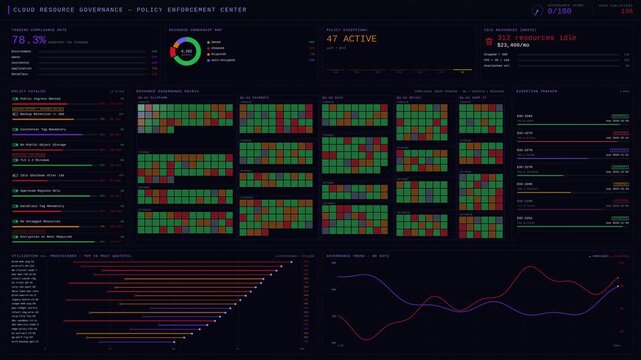
4K dark-mode cloud resource governance dashboard animation featuring ownership mapping, tagging compliance, utilization metrics, policy enforcement, and exception tracking with purple accents.
00:15
HD
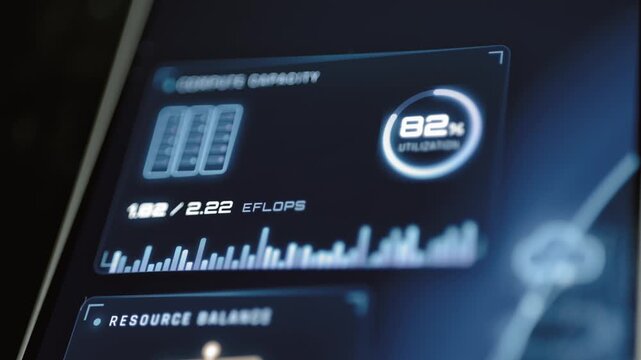
Compute capacity panel reports 82 percent utilization
00:11
HD
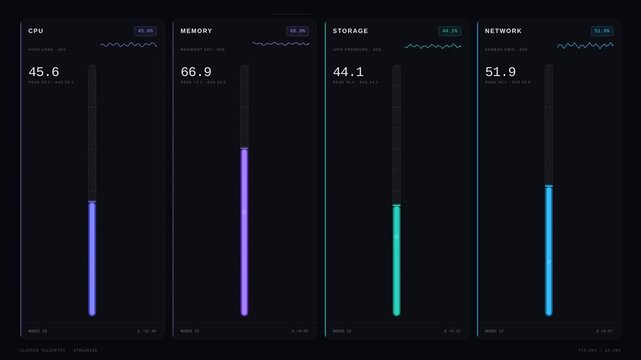
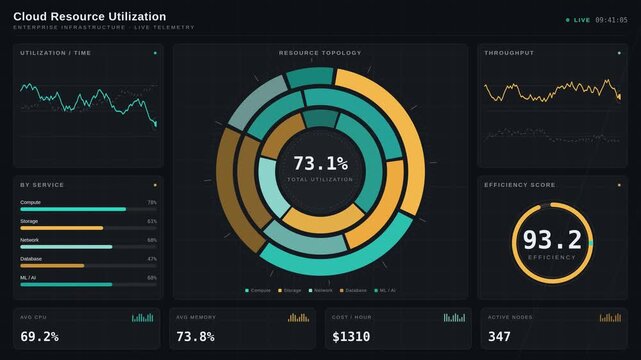
Explore a sleek and modern cloud resource utilization dashboard showcasing CPU, Memory, Storage, and Network metrics with vibrant colors and dynamic animations in dark mode.
00:15
HD
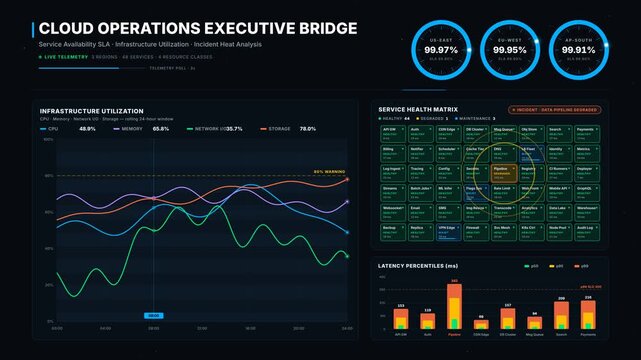
4K animated cloud operations dashboard displaying service availability rings, infrastructure utilization trends, and a live health matrix with futuristic data center control room aesthetic.
00:15
HD
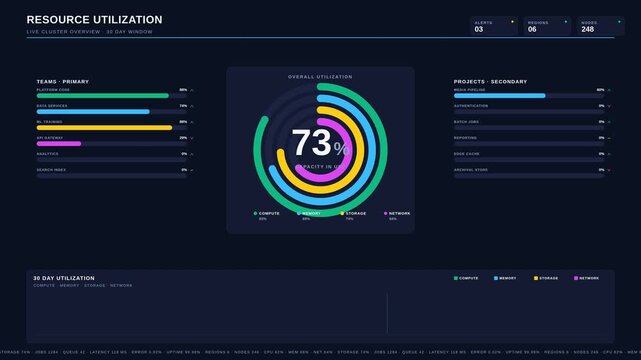
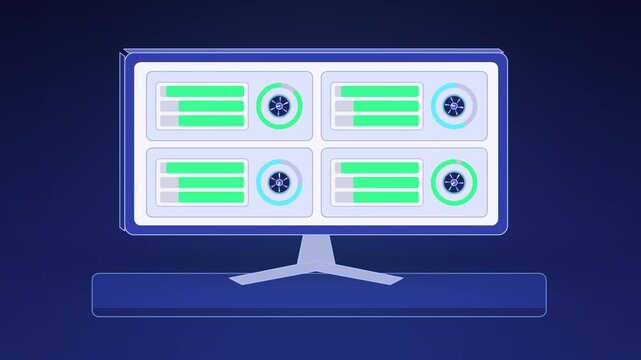
Digital resource utilization dashboard interface with data analytics charts
00:15
HD
Cloud resource utilization dashboard displaying real-time data analytics metrics
00:15
HD
Asset management system showing investment planning, financial goal tracking, ROI analysis, and performance monitoring for efficient resource utilization Marrow
00:10
HD
An extensively fractured and distressed animal hide surface presenting a ruptured motif substrate, macro perspective of a textured epidermis ground covering for utilization in visual projects, sartor
00:10
HD
Utilization rate meter showing falling values of utilization rate. Diminishing to minimum, reaching zero, below the norm. Lack of utilization rate. No AI, made by humans for humans.
00:06
HD
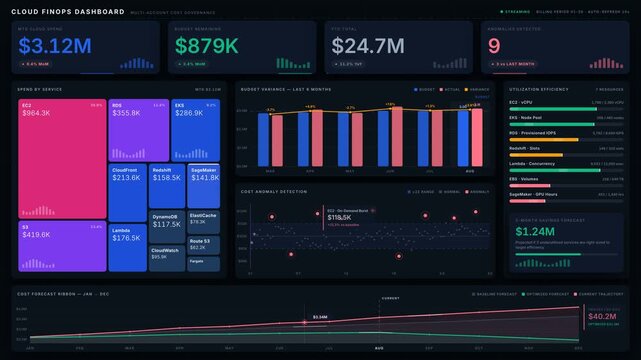
An advanced Cloud FinOps dashboard showcasing financial KPIs, budget variance, cost anomaly detection, and utilization efficiency metrics in a sleek, modern interface.
00:15
HD
Two Women Work Together Using Cybersecurity Software
00:26
HD
Rainwater harvesting system efficient water collection. Storage in a cistern. And utilization for household applications and garden irrigation
00:17
HD
Capacity utilization word in economic indicators
00:10
HD
Conceptual illustration of a system reaching its operational limits, displaying a critical message warning of SYSTEM OVERLOAD utilization and potential functional collapse
00:10
HD
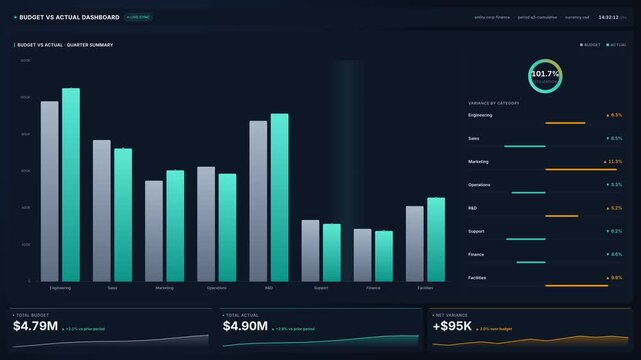
Animated budget versus actual dashboard displays quarterly bars utilization gauges, for financial planning, cost tracking, variance analysis, business performance
00:20
HD
Explore a detailed machine utilization dashboard showcasing productive, idle, setup, and maintenance time with vibrant colors and smooth animations for real-time insights.
00:15
HD
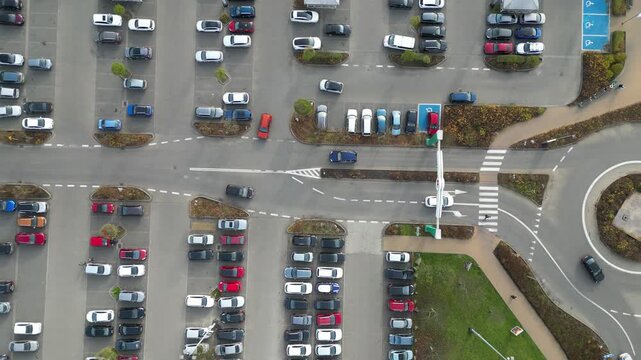
Aerial view of busy parking lot near shopping center, showcasing various parked vehicles, camera pans across scene highlighting parking dynamics and space utilization
00:10
HD
Credit card balances feeding an overall utilization level that drops as balances are paid down
00:14
HD
Indigo GPU cluster utilization monitor stacking completed jobs
00:15
HD
Dark mode AI load balancing dashboard with fleet utilization grid, task queue monitoring, auto scaling metrics, workload distribution, and enterprise operations interface.
00:15
HD
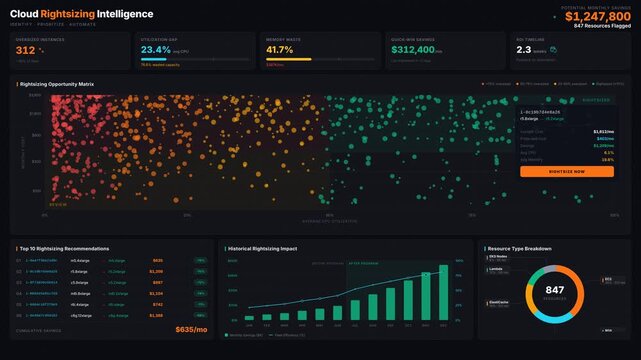
Premium 4K dark mode cloud rightsizing dashboard animation showing oversized resources, utilization gaps, and savings opportunities with dynamic charts and data.
00:15
HD
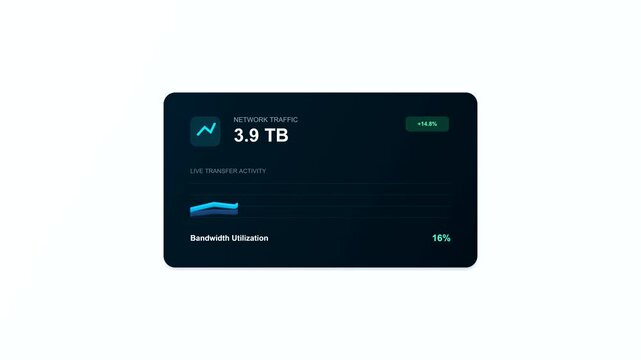
Data dashboard showing bandwidth utilization and storage growth
00:20
HD
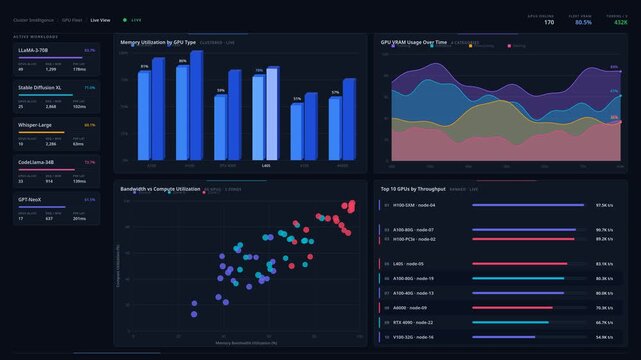
Explore the GPU Cluster Dashboard showcasing AI workloads with detailed memory utilization metrics and performance analysis in a sleek dark-mode interface.
00:15
HD
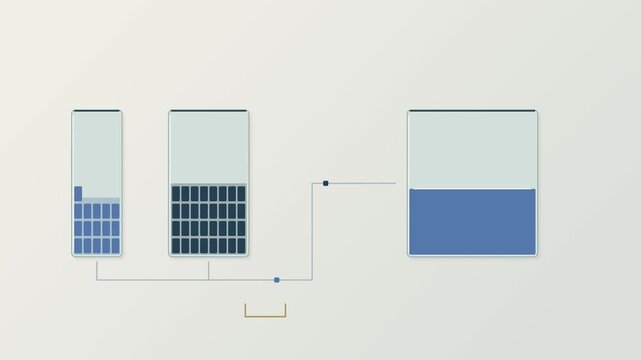
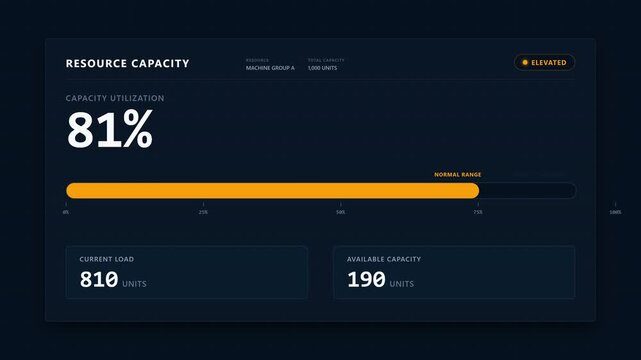
Optimizing resource management through a sleek data dashboard presenting utilization and availability metrics for efficient operations
00:14
HD
Animated office space utilization dashboard: close-up occupancy tracking with real-time booking analytics
00:09
HD
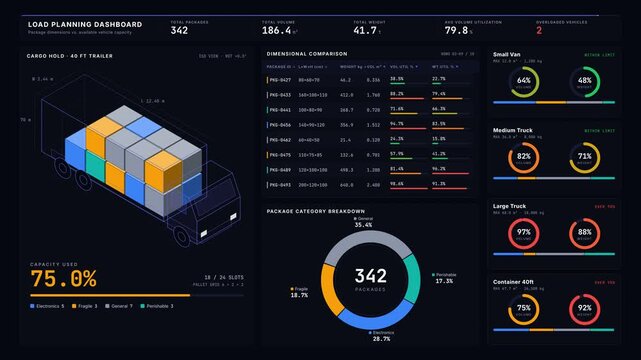
Load planning dashboard animation comparing package dimensions with vehicle capacity, featuring 3D wireframe truck, data tables, and utilization gauges in dark indigo style.
00:15
HD
Asset management system showing investment planning, financial goal tracking, ROI analysis, and performance monitoring for efficient resource utilization Marrow
00:09
HD