En e-post med en kobling for å angi passordet har blitt sendt til: Du trenger et passord for å få tilgang til kjøpene dine i fremtiden.
Få 3 videoer eller 25 bilder med en Prøv gratis
Nye filtre er lagt til
Sorter etter

19 768 treff for increase and decrease i videoer

Cost Reduction Business Growth Motion Graphics Line Chart Arrow Down Concept, Financial Loss Analysis, Budget Cut Optimization, Downward Arrow Graphic with Text Animation on Black Background.
00:10
HD
A sleek digital interface presenting various green energy solutions, showcasing trends and analytics across solar, wind, and biomass to promote sustainability and ecological awareness. Cipher
00:10
HD
storage usage level indicator scale. Low normal high meter infographic animation on black background. Showing high pressure level color gauge indicator.4k animation video
00:10
HD
Glowing purple neon continuous line forming up and down arrows isolated on black background, perfect for finance, trade, and data exchange concept.
00:10
HD
Ghana Oil Prices Decline with Oil Barrels, Gold Coins and Downward Green Arrow, 3D Economic and Financial Market Concept
00:11
HD
Business concept showing hand receiving goods, a delivery truck with dollar signs, and a gauge indicating price fluctuations influenced by market supply and economic factors
00:17
HD
Personal Skills Word Cloud
00:11
HD
Health care concept. Keyword weight and increase and decrease neon glowing arrow icons.
00:08
HD
Haiti Oil Price Falling with Oil Barrels Downward Green Arrow and 3D Financial Data Visualization Graphs for Economy and Business Concept
00:11
HD
Animated white line graph arrow pointing downwards on black background, for financial analysis, and market trend presentation
00:10
HD
Business Profit and Loss Chart Animation
00:06
HD
Reuse level indicator scale. Low Normal High meter infographic animation on black background. Showing high reuse level color gauge indicator for sustainability and eco-friendly practices.
00:10
HD
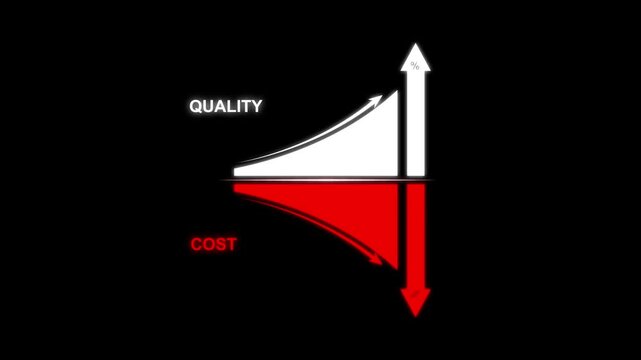
Cost control and quality improvement concept. Red bar chart with line graph showing cost reduction and improving quality. Successful business strategy, efficiency, product optimization and management
00:06
HD
Focus level indicator scale. Low normal high meter infographic animation on black background. Showing high focus level color gauge indicator for mental performance and productivity monitoring.
00:10
HD
Vibrant Green Digital Marketing Promotional Graphics for Seasonal Retail Shopping Events and Massive Discount Sales Campaigns
00:06
HD
Business Person Calculating Financial Budget and Debt Reduction Strategy
00:15
HD
Financial Growth Graph Animation Featuring Increasing Business Performance Bars
00:07
HD
Futuristic dollar countdown timer animation, glowing dollar symbol integrated with a circular countdown display, numbers decreasing smoothly from 0 to 60,
00:10
HD
Cryptocurrency trading dashboard with multiple market price charts
00:09
HD
glowing neon Percentage growth and decline icon with up and down arrows. financial, business, and statistical analysis. Up and down percentage arrows icon.
00:10
HD
policy level indicator scale. Low normal & high meter infographic animation. Showing high policy level color gauge indicator. on a black background 4k animation video
00:10
HD
Hands Over Laptop with Digital Graph Showing Growth Projections for Future Years Including 2023, 2024, 2025, 2026, and 2027 in Business Context Sigmoid
00:10
HD
Zigzag line with a downward arrow falling trend loss decline and negative business direction animation
00:06
HD
Brightness slider level control animation isolated on black background, slider level adjust 0 to 100, simple brightness contrast icon animated.
00:06
HD
Guinea Oil Prices Decline with Oil Barrels, Gold Coins and Downward Green Arrow, 3D Economic and Financial Market Concept
00:11
HD
Automated manufacturing process focusing on efficiency, cost reduction, and quality control, optimizing industrial operations and increasing business productivity with smart planning
00:17
HD
Intermodal Port-To-Port Word Cloud
00:11
HD
Glowing neon red animated line graph illustrating a downward market trend on black background. 4K Video motion graphic animation
00:10
HD
connection strength level indicator scale. Low normal high meter infographic animation on black background. Showing high pressure level color gauge indicator.4k animation video
00:10
HD
Speaker Volume Level Animation. Volume Sound Control Animation on Black Background, Audio Level Up and Down Icon.
00:10
HD
Animated down graph icon designed in flat icon style. Finance, Business Info graphic animation, Bar down graph Animated down graph icon, business or finance, down graph bar,4k video
00:10
HD
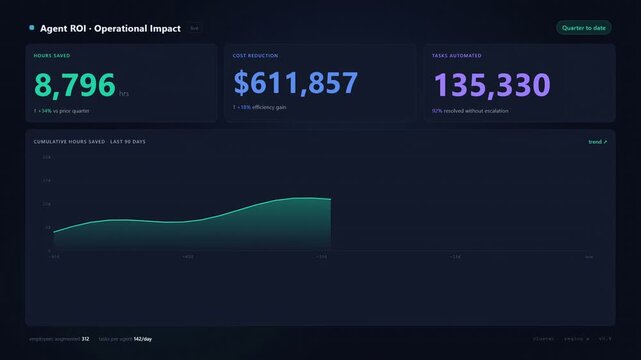
Animated Agent ROI & Operational Impact Dashboard UI. Dark mode interface showing hours saved, cost reduction, tasks automated counters, and cumulative growth charts.
00:15
HD
Bright white 3D number 2035 text animation floating against a deep black void offering a vibrant and modern visual for the year with a sense of digital energy.
00:10
HD
Urgency level indicator scale. Low normal & high meter infographic animation on black background. Showing high urgency level color gauge indicator for task priority time management and workflow.
00:10
HD
2027 New year with change to UP and Down arrow. Interest rate, GDP, stocks market, financial, deflation and Inflation, mortgage, debt, Loan and Economic Recession
00:09
HD
Sugar at high levels, displayed on a barometer or tachometer, illustrating excess sugar intake, potential impact on health, and the need for balanced dietary regulation and moderation
00:10
HD
Revenue and Profit Growth Animation for Corporate Business Reports
00:08
HD
Neon dollar coin icon animation with up and down arrows for financial market trends on black background, 4K
00:10
HD
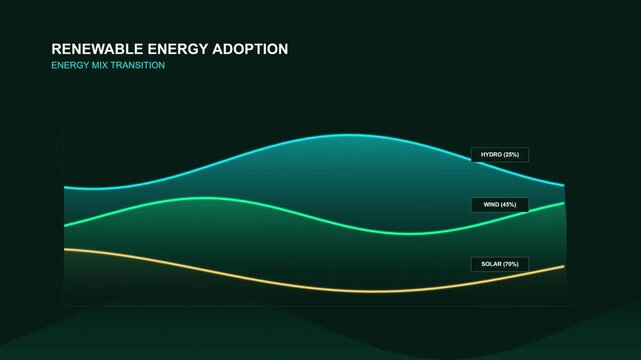
Sustainability data visualization showing renewable energy metrics
00:10
HD
Reuse level indicator scale. Low Normal High meter infographic animation on black background. Showing high reuse level color gauge indicator.
00:10
HD
Cost Reduction Business Growth Motion Graphics Line Chart Arrow Down Concept, Financial Loss Analysis, Budget Cut Optimization, Downward Arrow Graphic with Text Animation on Black Background.
00:10
HD
Team Collaboration on Environmental Goals and Sustainable Development with Graphs and Charts for Future Planning and Climate Action Initiatives in 2023 Sigmoid
00:20
HD
Red downward arrow on digital financial graph showing declining market trend and investment data visualization
00:15
HD
Uruguay Oil Price Falling with Oil Barrels Downward Green Arrow and 3D Financial Data Visualization Graphs for Economy and Business Concept
00:11
HD
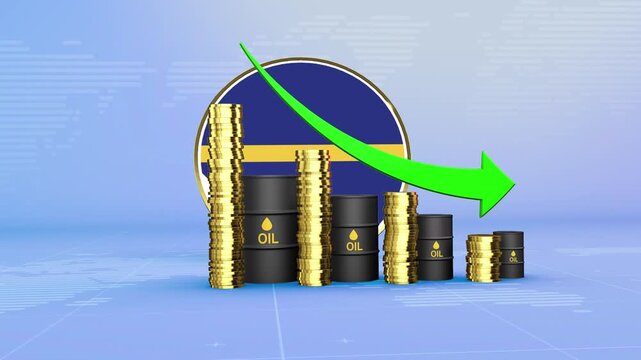
Nauru Oil Prices Decline with Oil Barrels, Gold Coins and Downward Green Arrow, 3D Economic and Financial Market Concept
00:11
HD
Proactive risk prevention strategy involves identifying potential threats. Managing hazards with strategic planning
00:17
HD
Joint Mobilization Word Cloud
00:11
HD
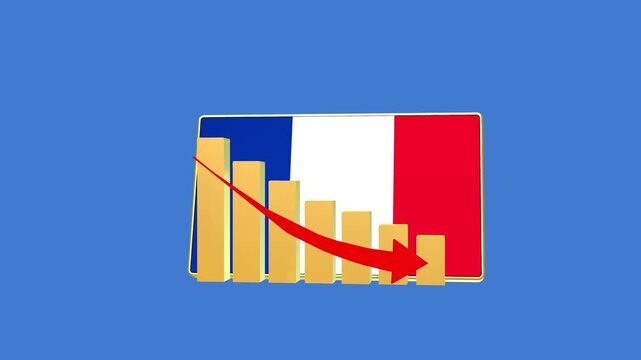
France economic bar chart graph showing decreasing downturn with national Flag 3D animation on black background.
00:16
HD
hydration index level indicator scale. Low normal high meter infographic animation on black background. Showing high pressure level color gauge indicator.4k quality animation video
00:10
HD
Zoom in and out animation the image symbol. Large black symbol in the center and four small symbols around. Seamless looped 4k animation on white background
00:12
HD
Down arrow business graph chart animation. Loss business graph icon animation.  on black background. 4k video
00:10
HD
weather level indicator scale. Low normal & high meter infographic animation. Showing high weathe level color gauge indicator. on a black background 4k animation video
00:10
HD
Bright white 3D number 2019 text animation floating against a deep black void offering a vibrant and modern visual for the year with a sense of digital energy.
00:10
HD
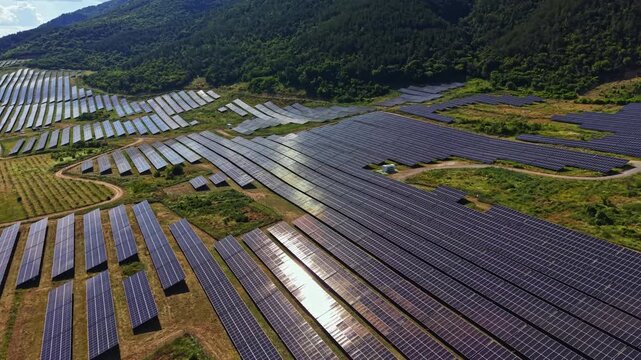
Rows of solar panels stretch across the landscape under clear skies. The sun reflects off the panels, showcasing the energy production in a rural area during daytime.
00:20
HD
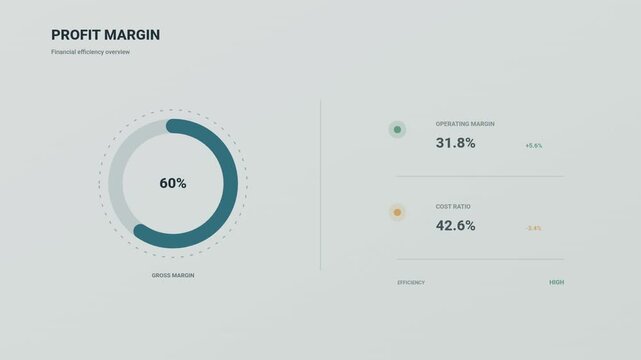
Financial profit margin analysis with circular progress bar and data charts showing performance metrics
00:10
HD
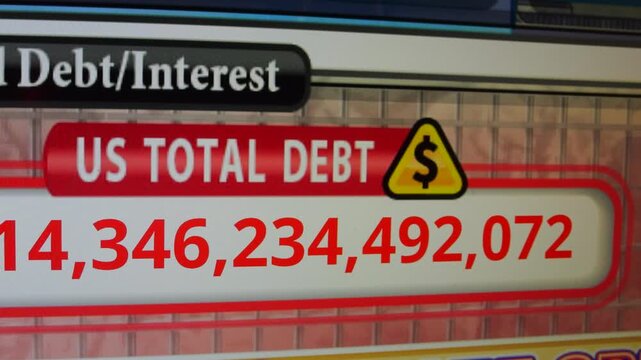
Visual Breakdown of U.S. Total Debt Data Over Time
00:15
HD

Hand drawn fluctuating line chart animation showing changing values, market volatility, financial analysis, data trends, uncertainty and performance movement.
00:07
HD
Efficiency level indicator scale. Low normal & high meter infographic animation on black background. Showing high efficiency level color gauge indicator for Performance and productivity monitoring.
00:10
HD
Thermometer Temperature Increase and Decrease Animation Clinic and Weather Alpha Channel 4K Resolution
00:10
HD
Graph chart animation minimalist business data presentation finance statistics growth seamless loop motion graphics. Animated graph chart grid minimalist business data.
00:08
HD
Money reduction icon animation on black background. Dollar currency price drop concept. circle with down arrow moving animation. 4k video
00:10
HD
A collaborative business environment showcasing a digital globe with eco-friendly icons, charts, and graphs illustrating innovative strategies for sustainable development and growth. Raster
00:12
HD
Glowing red downward arrows pulsing on dark background with subtle particles, concept for financial decline, market crash and negative growth
00:10
HD
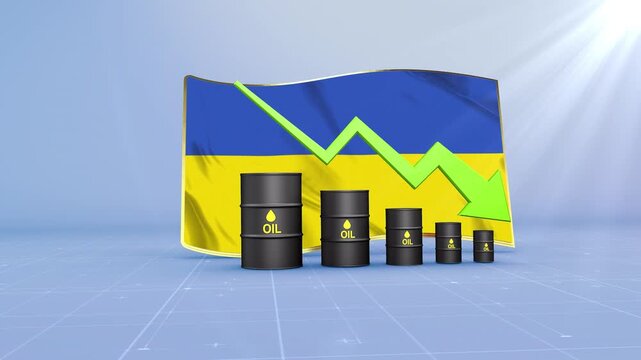
Ukraine Oil Price Falling with Oil Barrels Downward Green Arrow and 3D Financial Data Visualization Graphs for Economy and Business Concept
00:11
HD
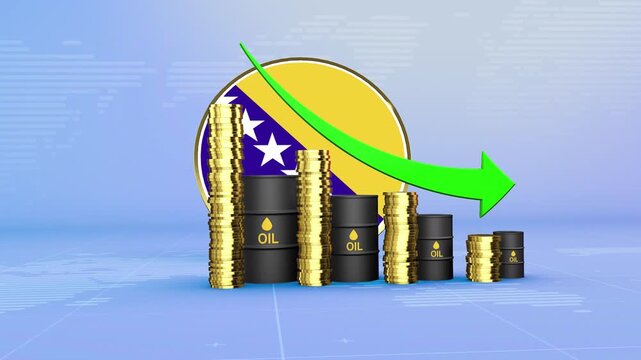
Bosnia and Herzegovina Oil Prices Decline with Oil Barrels, Gold Coins and Downward Green Arrow, 3D Economic and Financial Market Concept
00:11
HD
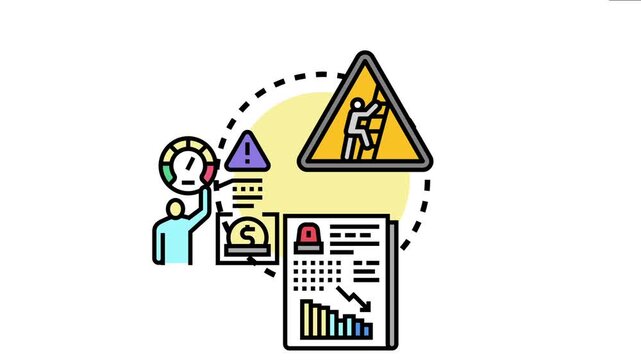
Analyzing price fluctuations showing various financial indicators. Including a decreasing value graph. A risk warning. A computer monitor with performance charts
00:17
HD
Mental Stimulation Word Cloud
00:11
HD
Bar chart animation shows declining percentages on black. Negative economic trading analytics track on bar chart animation. Financial investment downturn marks the chart.

00:07
HD
network quality level indicator scale. Low normal high meter infographic animation on black background. Showing high pressure level color gauge indicator.4k animation video
00:10
HD
Glowing white bar chart and downward arrow illustrating business decline, financial loss and economic downturn. Concept of recession, falling profits, market crash and negative growth performance
00:12
HD
Red stock market line graph motion graphics on black triangle over green screen background loop
00:10
HD
coustomer satisfaction level indicator scale. Low normal & high meter infographic animation. Showing high coustomer satisfaction level color gauge indicator. on a black background 4k animation video
00:10
HD
Bright white 3D number 2012 text animation floating against a deep black void offering a vibrant and modern visual for the year with a sense of digital energy.
00:10
HD
dollar up and down arrow animation, money icon, dollar sign, up and down arrows, 4k video.
00:10
HD
Glowing Neon Percentage Growth and Decline Icon Animation with Up and Down Arrows on Black Background, Financial Business Statistics, 4K Motion Graphics Loop..
00:10
HD
Spinning gold coin stack with rising and falling arrows
00:10
HD
White percentage symbols float and scatter against a dark red background
00:08
HD
Abstract financial chart with falling bars downward market trend and low performance with grid and world map details animation
00:10
HD
Red neon sign financial bar chart falling with downward arrow. Illustrating stock market crash, business loss, economic recession, financial decline, and negative investment trend. 4k motion videos
00:10
HD
Zoom in and out animation the sexy woman symbol. Large black symbol in the center and four small symbols around. Seamless looped 4k animation on white background
00:12
HD
Opening neon-green map starting shifting bar chart and expanding pie segment presenting global data
00:12
HD
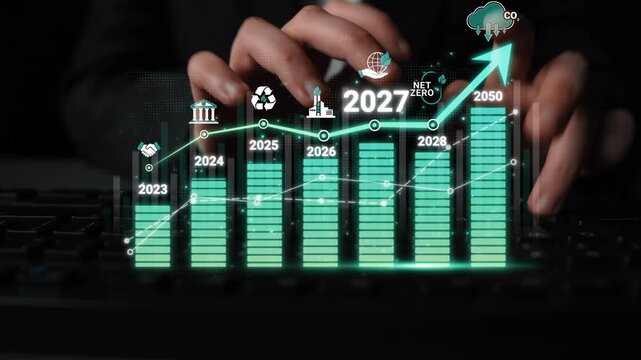
Dynamic Financial Growth Chart with Future Projections and Carbon Neutrality Vision for Years 2023 to 2050 in Modern Business Setting Sigmoid
00:10
HD
Three-word text animation featuring Grow With Consistency with sequential word reveal, spacing reduction effect, and zoom transition in 3840x2160 format.
00:12
HD
Belgium Crude Oil Price Drop with Oil Barrels Downward Green Arrow and 3D Financial Data Visualization Graphs for Economy and Business Concept
00:11
HD
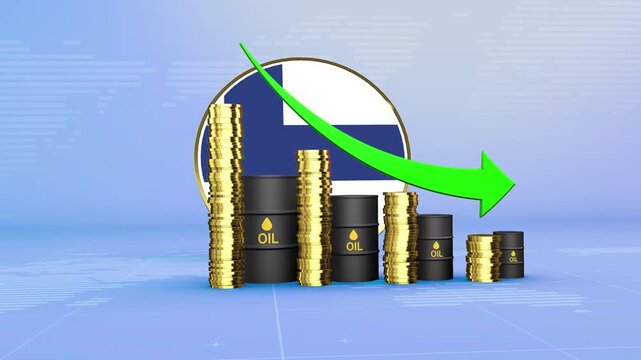
Finland Oil Prices Decline with Oil Barrels, Gold Coins and Downward Green Arrow, 3D Economic and Financial Market Concept
00:11
HD
Child centered play therapy developing children's communication skills and emotional regulation through engaging activities, fostering growth and reducing stress
00:17
HD
Angular Acceleration Word Cloud
00:11
HD
Colorful Bar Chart Illustrating Business Data and Financial Growth Trends.
00:05
HD
data security level indicator scale. Low normal high meter infographic animation on black background. Showing high pressure level color gauge indicator.4k animation video
00:10
HD
Neon Dollar Sign with Downward Arrows in a Circle
00:10
HD
Fullscreen icon animation on green background. Exit full screen mode, multimedia player animation. Increasing and decreasing screen size animation. Zoom expand for screen scaling and full screen mode
00:08
HD
Animated business data visualization bar chart purple pink neon grid background. Animated bar graph chart data visualization business finance purple pink neon 4k loop.
00:09
HD
Fading in translucent data panels animating line graphs and bar charts in office displaying metrics
00:05
HD
Increasing counting number 0 to 10k for price like views figures or amount concepts.4k motion graphics video animation
00:10
HD
A symbol representing business collaboration. Business partnerships to enhance development and gain a competitive advantage. Cost reduction and improved economies of scale. Business leadership.
00:10
HD
Red bar chart animation with rising columns and curved arrow, representing economic instability, financial crisis risk, volatile growth, and uncertain business performance on minimal background.
00:05
HD
Neon line Cost Effective concept button on a futuristic computer screen. abstract technology background with rotating world map icon, Business, Technology, Internet and networking concept.
00:10
HD
money stack on table, Wealth Increasing and Decreasing - Global Financing
00:05
HD
Neon line Down business graph loss project. 4k Business graph. loss graph direction. damage business graph. down business graph icon. business or finance concept icon animation.
00:10
HD
Zoom in and out animation the star symbol. Large black symbol in the center and four small symbols around. Seamless looped 4k animation on white background
00:12
HD