En e-post med en kobling for å angi passordet har blitt sendt til: Du trenger et passord for å få tilgang til kjøpene dine i fremtiden.
Få 3 videoer eller 25 bilder med en Prøv gratis
Nye filtre er lagt til
Sorter etter

19 600 treff for increase and decrease i videoer

coin money dollar cash value rise with arrows pointing up represent financial profit economic growth outline
00:05
HD
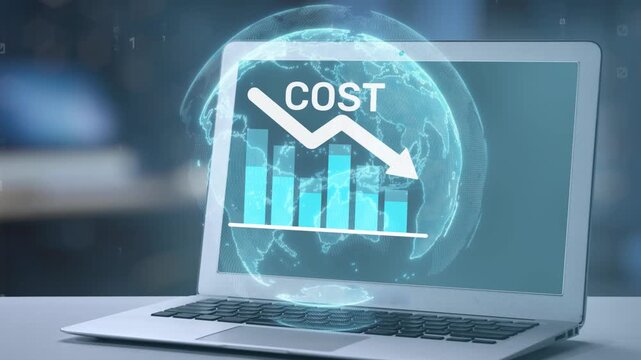
Visual representation of cost analysis with a declining graph on a laptop screen, emphasizing financial trends and data visualization in a modern business environment. Salient
00:12
HD
Cost reduction and cost saving through digital transformation, business cost optimization, operational cost reduction, financial saving, and resource efficiency 4k video animation.
00:10
HD
Annual tax reduction planning concept. Person typing on keyboard with calculator, tax form deduction and financial savings icons, smart corporate and personal income tax strategy.
00:10
HD
Animated Bar Chart Data Visualization 3D Cylinders Growing Up and Down Dark Blue Background
00:05
HD
Cryptocurrency trading. Bitcoin stock graphic. Bitcoin mining and Finance banking management concept, oil and Money trading, Digital trade platform. Profit and loss graph. Online trading
00:12
HD
Self-Actualization indicator scale. Low Normal High meter infographic animation on black background. Showing high self-actualization level color gauge indicator for personal growth and well-being.
00:10
HD
Business growth concept in graph chart showing marketing sales profit increasing to future target . growing business concept.
00:10
HD
Hand drawn sketch icons of mutual fund net asset value nav increase and decrease with indian rupee currency symbol 4k animated video, alpha transparent video
00:10
HD
Corporate Success Animation Rising Arrow on Business Graph
00:10
HD
Dynamic Signal Bars on Green Screen - The video showcases a set of digital signal bars displayed in a dynamic, increasing sequence against a chroma key green backdrop.
00:08
HD
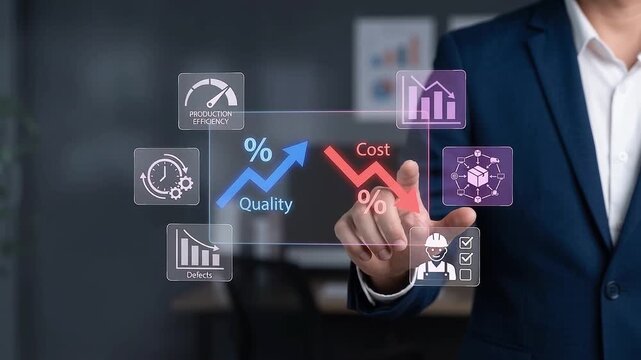
Digital neon analysis data business graph icon shows Quality and cost control concept, Cost and quality icons to Improve work efficiency for quality control and company cost reduction. business growth
00:10
HD
Neon Celsius thermometer displayed temperature 53 degree. Digital Temperature Meter Display 53°C. That's indicates weather temperature 53 degree increase or decline.4k video.
00:10
HD
Business growth bar chart showing rising graph and growing fluctuation. Ideal for financial analytics, revenue growth, and company data visualizations, growth and success concept 4k
00:10
HD
Hand Drawn Animation of Bar Charts Growing and Shrinking.
00:10
HD
Business graph shows revenue decline, financial loss, negative growth, and market decrease performance, Abstract decreasing business graph chart animation background. Bad Economy concept
00:10
HD
Pink Bar Chart Fluctuating Up and Down with Upward Arrow Indicator
00:05
HD
Red arrow pointing down animation. Continuous Bouncing Motion Graphic for Directions and Download.
00:10
HD
Financial data and diagrams showing a steady increase in profits. Growth And Success Arrow. arrow rising transparent channel.4k video.
00:10
HD
Waterfall chart bridging gains and losses to a final total
00:12
HD
Set of four black and white thermometer icons showing rising falling increasing and decreasing temperature for professional creative use today for des
00:10
HD
Cost reduction and cost saving through digital transformation, business cost optimization, operational cost reduction, financial savings, and resource efficiency strategies for business success. Spire
00:20
HD
Neon Modern Infographic Growth Animation with Increasing Business Metrics
00:12
HD
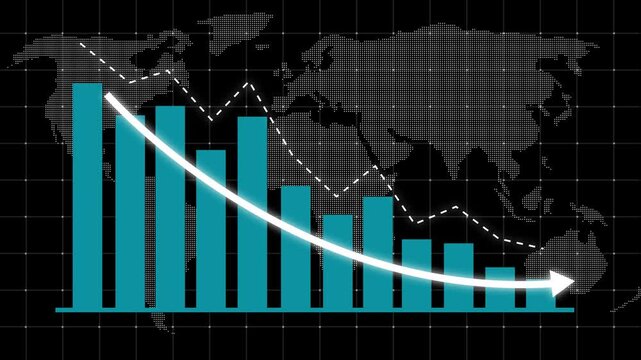
Declining Bar Chart with Curved Downward Arrow, Business Loss and Market Decrease Concept, Financial Statistics and Performance Reduction Graphic on Dark Gray Background.
00:06
HD
Volume Level Indicator Increasing on Transparent Background
00:10
HD
Cryptocurrency trading. Bitcoin stock graphic. Bitcoin mining and Finance banking management concept, oil and Money trading, Digital trade platform. Profit and loss graph. Online trading
00:12
HD
Ticker display. table grid Stock exchange screen number with financial trade index rates, finance fund stocks price increase and decrease charts arrow up and down
00:20
HD
Financial chart with bars and upward arrow growth decline and recovery animation
00:10
HD
line graph showing cost reduction and improving quality. Successful business strategy, efficiency, product optimization and management. Business steady growth concept with rising progress bar chart
00:10
HD
Bar chart animation displays declining columns with a falling trend line. Corporate business financial losses reflect on bar chart. Economic downturn marks the chart.
00:08
HD
Dynamic Bar Graph Animation Showing Data Trends Over Time.
00:07
HD
Annual bar chart animation tracks economic values from 2020 to 2026. Corporate financial analytics update along the annual bar chart. Multi year business revenue drives the annual bar chart.
00:12
HD
Neon Celsius thermometer displayed temperature 58 degree. Digital Temperature Meter Display 58°C. That's indicates weather temperature 58 degree increase or decline.4k video.
00:10
HD
Loss concept business graph animation. Symbolizing revenue drop, financial loss, negative growth, market downturn, and decrease business performance, Graph Going down animation. Down business
00:10
HD
Business Performance Strategy Showing Improved Quality and Reduced Costs Through Operational Efficiency, Process Optimization, Cost Control, Productivity Growth, and Sustainable Competitive Advantage
00:10
HD
Pixelated bar chart showing downward trend, financial decline, economic recession, data loss, negative growth visualization
00:06
HD
Net zero carbon neutrality concept infographic with animated hud interface featuring business financial growth charts, and sustainable corporate strategy for modern environmental presentations
00:10
HD
Restrictions gauge rises from low to high before falling, presenting changing limits, regulation, pressure, risk, recovery, and improving business conditions with copy space
00:40
HD
Animated quality and cost comparison graphic featuring opposing arrows, business concept visuals for presentations and marketing, 4K video with an alpha channel
00:10
HD
Bar graph animation with white glowing. Bar graph financial data visualization. Bar graph business success graphic on dark blue grid background for data.
00:12
HD
Dynamic downward trend line animation stock visual representation business finance market analysis
00:10
HD
A robotic hand points at a floating digital representation of cost graphs and global trends, symbolizing advanced analytics and efficient business decision-making. Synapse
00:15
HD
Red arrow graph declining business, financial loss concept, animation with motion
00:06
HD
Man works on a laptop and then places a “New Price” sign on the desk, representing price changes, retail pricing, sales and updated costs.
00:17
HD
Blood vessel obstruction caused by fatty cholesterol buildup demonstrating reduced circulation, vascular inflammation, and increased risk of coronary artery disease and stroke. 3D Rendering
00:15
HD
Cost reduction concept. Cost wording on decrease money with down arrow. Cost Management, Economy recession, low budget, Effective business, Expense reduce on transparent background 4k video,
00:10
HD
Large black fingerprint symbol zooms in and out at the center, surrounded by four small copies. Seamless looped 4k animation on white background
00:12
HD
Monetary devaluation causes economic challenges, featuring a person climbing obstacles, a dollar decreasing in value, and an increasing percentage representing inflation or rising interest rates
00:17
HD
Audio Volume Level Slider Animation | 0% to 100%
00:05
HD
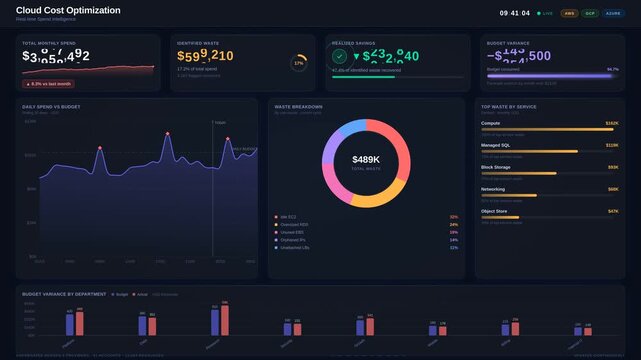
Dark mode cloud cost optimization dashboard with animated spend charts, waste metrics, savings data, and budget variance visualizations in 4K for commercial creative technology and business use.
00:15
HD
Abstract Neon Red Glowing Up and Down Arrows Icon for Data Transfer, Stock Market Trading, and Technology Concepts on Black Background.
00:10
HD
Bar graph animation indicates downward global economic trends. International financial market analytics route across bar graph animation. Economic policy teams use graph.
00:10
HD
Neon Celsius thermometer displayed temperature 09 degree. Digital Temperature Meter Display 09°C. That's indicates weather temperature 09 degree increase or decline.4k video.
00:10
HD
Business growth bar chart showing rising graph and growing fluctuation. Ideal for financial analytics, revenue growth, and company data visualizations, growth and success concept 4k
00:10
HD
Cost reduction business finance concept. Businessman cost reduction icon with down arrow for budget management and cost management.4k video animation.
00:10
HD
Animated line graph with increasing and decreasing data points on dark background showing financial growth and decline over time.
00:05
HD
High Performance Gauge Indicator Animation. Speedometer Icon with arrow Indicate high level
00:10
HD
Animated business bar chart showing monthly sales growth and data
00:08
HD
Bar chart for declining business performance by month. the curve shows a downward move .chart graph animation, 4k arrow is making downfall on a grid ...
00:10
HD
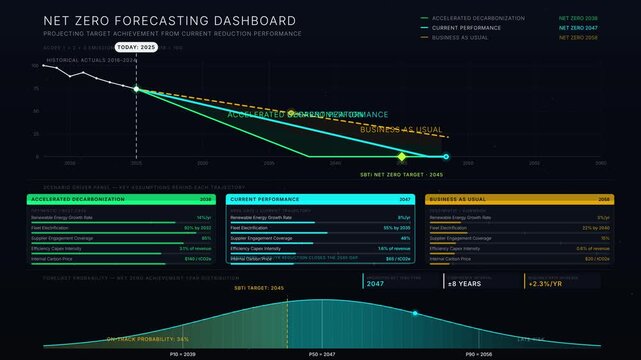
A dark mode net zero forecasting dashboard animation featuring a fan chart illustrating emissions reduction scenarios with interactive elements and animated starry background.
00:15
HD
Bar Chart Graph Growing and Falling Down, Financial Data Analysis, Business Growth
00:10
HD
Cost reduction and cost saving through digital transformation, business cost optimization, operational cost reduction, financial savings, and resource efficiency strategies for business success. Elide
00:11
HD
Minimalist black arrow pointing downwards on a clean white background in motion graphics.
00:10
HD
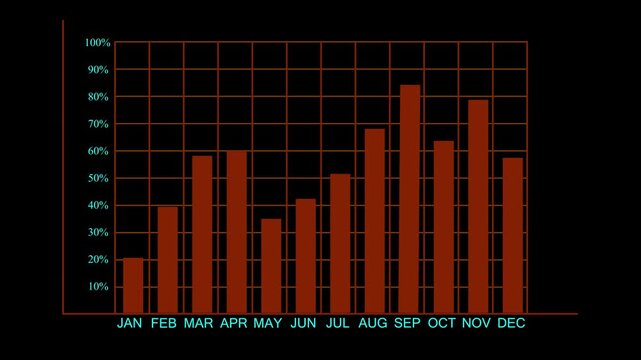
Monthly bar chart showing percentage growth over a year. Financial monthly bar chart showing percentage growth for fiscal tracking. Corporate monthly bar chart on grid.
00:07
HD
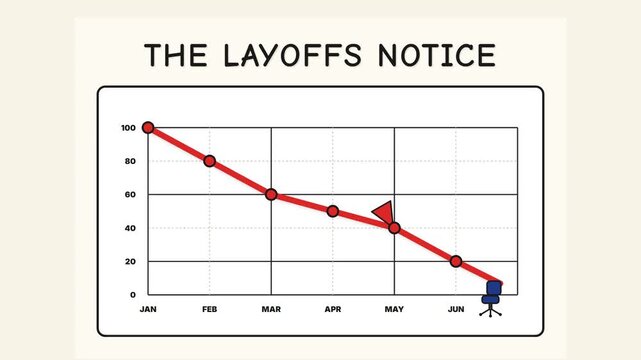
the layoffs notice falling economy business employment animation HD 4K
00:12
HD
Cost reduction concept. Cost wording on decrease money with down arrow. Cost Management, Economy recession, low budget, Effective business, Expense reduce on transparent background 4k video,
00:10
HD
Zoom in and out animation the paperclip symbol. Large black symbol in the center and four small symbols around. Seamless looped 4k animation on white background
00:12
HD
Hand pruning with scissors for mulberry plant
00:14
HD
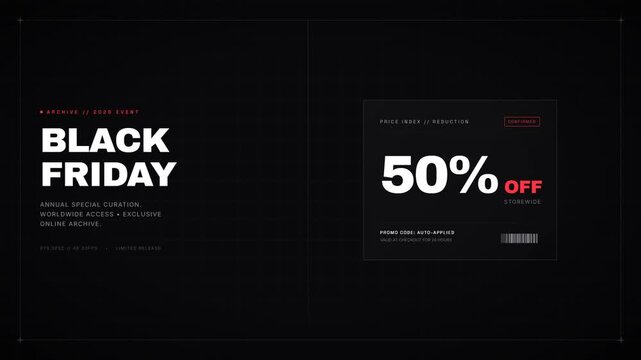
A minimalist Black Friday promotional video showing a discount percentage rapidly increasing from 0% up to 50% off against a sleek dark background.
00:10
HD
Broke businessman showing empty pockets with no money. Financial crisis in tax. Loan repayment, installment plan. Business animation video
00:07
HD
Business growth chart arrow icon animation. Rising icon animation .
00:10
HD
Bar chart animation on green neon grid. Bar chart financial data visualization. Bar chart business growth graphic on black.

00:12
HD
Neon Celsius thermometer displayed temperature 42 degree. Digital Temperature Meter Display 42°C. That's indicates weather temperature 42 degree increase or decline.4k video.


00:10
HD
Market oversaturation concept illustrated by surging competition. Increasing product or service availability. And a corresponding decrease in demand
00:17
HD
Red declining graph on monitor with abstract elements
00:12
HD
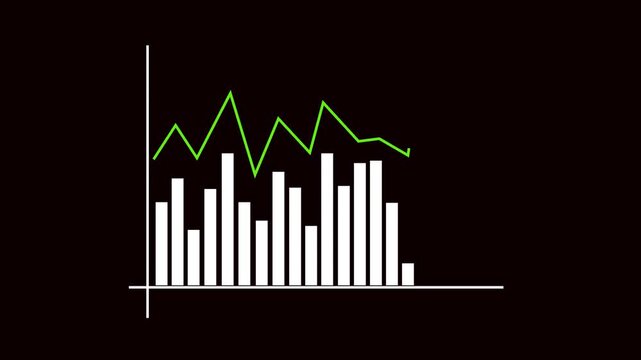
Bar graph chart animation stock market. Finance and business data presentation with abstract background. Stock market animated bar graph chart. Minimalist green line white bars black background.
00:09
HD
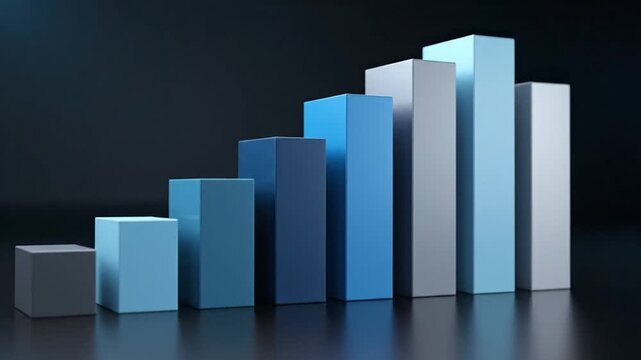
3D Bar Graph Animation with Blue Blocks.
00:08
HD
Glowing business bar chart with downward arrow, declining line curve. Symbolizing revenue drop, financial loss, negative growth, market downturn, and decrease business performance, Graph Going down 4k
00:10
HD
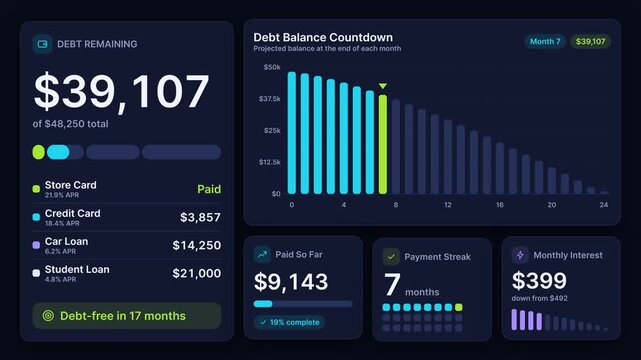
Financial Debt Repayment Dashboard Animating Monthly Progress and Balance Reduction, Dark Mode UI
00:10
HD
Businessman interacting with virtual dashboard interface optimizing product quality growth while reducing operational manufacturing costs and production defects
00:08
HD
Colorful neon bar charts displaying data on black background
00:08
HD
Business concept showing cost reduction and quality increase using Lean, Six Sigma, and Total Quality Management (TQM) to enhance efficiency, value, and customer satisfaction. Muxer
00:12
HD
Cost reduction business finance concept. Businessman cost reduction icon with down arrow for budget management and cost management.4k video animation.
00:10
HD
Business graph chart with growing business concept. Abstract decreasing business graph chart animation background. business or finance concept icon animation. 4k video
00:10
HD
Business graph shows revenue decline, financial loss, negative growth, and market decrease performance, Abstract decreasing business graph chart animation background. Bad Economy concept
00:10
HD
Animated Data Visualization Showing Scatter Plot with Smooth Regression Line on a Dark Grid Background
00:08
HD
Financial chart with bars and upward arrow growth decline and recovery animation
00:10
HD
Growth meter showing low levels of growth. Minimum and decreasing growth value, below the norm. Lack of growth. None of it, insufficient.
00:08
HD
Digital Dashboard Analytics: Growing Numbers & Financial Data Displayed on Screens
00:10
HD
Bar chart for declining business performance by month. the curve shows a downward move .chart graph animation, 4k arrow is making downfall on a grid ...
00:10
HD
Zoom in and out animation the cursor symbol. Large black symbol in the center and four small symbols around. Seamless looped 4k animation on white background
00:12
HD
Analytics comparison indicator business performance overlay
00:10
HD
Neon Celsius thermometer displayed temperature 10 degree. Digital Temperature Meter Display 10°C. That's indicates weather temperature 10 degree increase or decline.4k video.
00:10
HD
Animation of speaker volume with alpha channel, Speaker volume animation. sound up down icon
00:06
HD
Dark Blue Bar Chart with Diagonal Line on Black Background .Business growth concept in graph chart showing marketing sales profit increasing to future target .
00:10
HD
Abstract decrease icon on transparent background. Dollar rate down looped icon reduce costs sign and symbol business idea down arrow moving animation
00:10
HD
Red arrow showing stock market crash across black cubic blocks. Business financial data decrease with falling trend line.
00:08
HD
Cost reduction concept. Cost wording on decreasing coins stacking with the down arrow. Businessman working on company cost saving. Cost Management, Economy recession, low budget.
00:06
HD
Business growth concept in graph chart showing marketing sales profit increasing to future target. business graph bars columns growth animation arrow on black .Business graph chart growing business
00:10
HD
Typography text overlay featuring market trend detection slogan against simple minimal black background suitable for corporate presentations.
00:10
HD