En e-post med en kobling for å angi passordet har blitt sendt til: Du trenger et passord for å få tilgang til kjøpene dine i fremtiden.
Få 3 videoer eller 25 bilder med en Prøv gratis
Nye filtre er lagt til
Sorter etter

13 054 treff for decrease arrow i videoer

Red neon coin and down arrow symbol glowing on black background representing financial loss and economic downturn.
00:10
HD
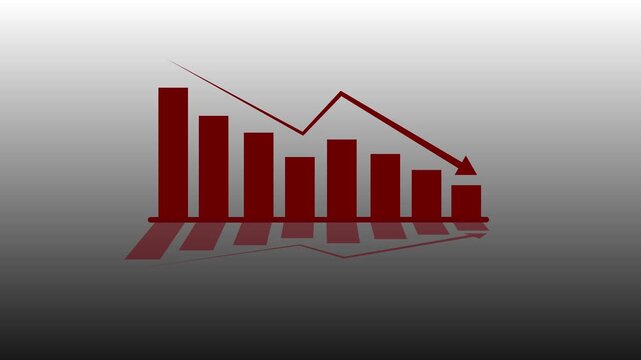
Business decline bar chart animation with falling line graph and shadow effects on transparent background. Indicate revenue decline, financial loss, negative growth
00:06
HD
Russia Oil Prices Decline with Oil Barrels, Gold Coins and Downward Green Arrow, 3D Economic and Financial Market Concept
00:11
HD
Rising Falling Graph Animation Green Screen
00:06
HD
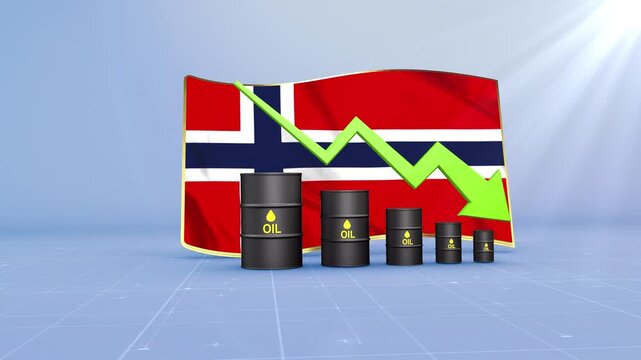
Norway Oil Price Falling with Oil Barrels Downward Green Arrow and 3D Financial Data Visualization Graphs for Economy and Business Concept
00:11
HD
Laptop screen displays gold bars and a downward arrow indicating a price drop.
00:08
HD
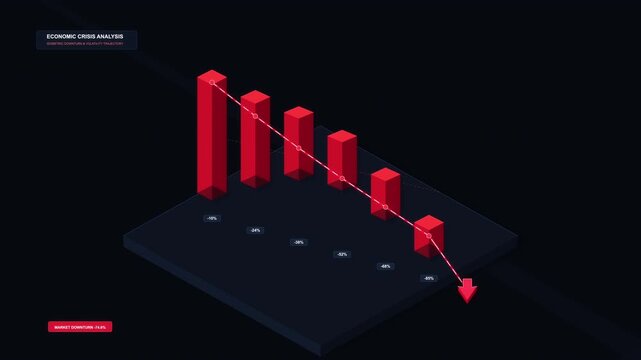
Pixelated red bar chart showing downward trend on dark background, motion graphic
00:06
HD
Business financial standing concept featuring a decreasing bar graph, falling coins, and financial reports on a computer screen, signifying risk, analysis, and monetary evaluation
00:17
HD
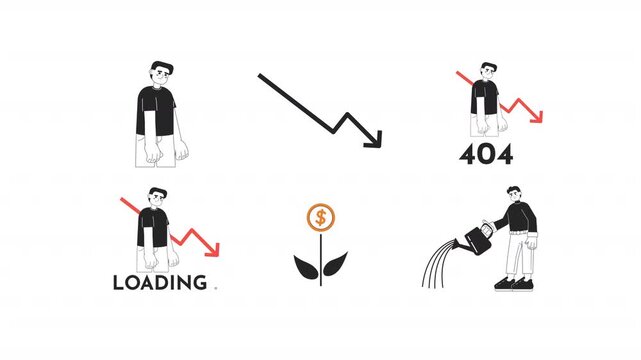
Financial downturn loading and 404 error black and white line animation pack. Investor watering money plant. Discouraged entrepreneur animated outline 4K video set on transparent background
00:42
HD
calcium level indicator scale. Low normal & high meter infographic animation. Showing high calcium level color gauge indicator. on a white background 4k animation video
00:10
HD
Neon red declining bar chart animation for financial loss and market downturn concepts glowing
00:10
HD
Teal bar chart decline animation displays downward trend arrows. Bar chart graph column layout indicates financial losses. Decline animation sequence loops well.
00:06
HD
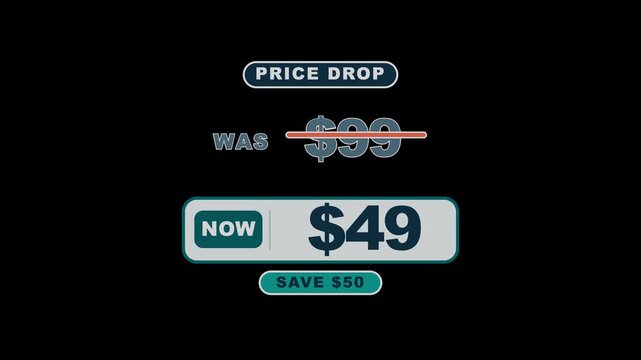
Price Drop $99 to $49 with $50 Savings
00:12
HD
Rate cut graphic with downward trending green line and percentage symbols on black background interest rate
00:07
HD
thermometer temperature animation rising and falling
00:10
HD
Carbon offset growth graph showing increasing CO2 reduction over time on a minimalist grid background
00:10
HD
Fall in business market values on a digital monitor showing professional data management tips for corporate annual report projects
00:15
HD
CO2 Emission and Reduction Icon Animation. Of carbon emission Arrow icon drawing on and fading out. Features On White Background.
00:08
HD
Customer satisfaction level indicator scale. Low normal & high meter infographic animation on black background. Showing high level color gauge indicator for business service quality and experience.
00:10
HD
Business graph. loss graph direction. damage business graph. business or finance concept icon animation.
00:10
HD
3D Business Statistics Bar Chart with Downward Arrow Showing Financial Decline, Falling Revenue, Market Loss and Negative Growth Data Visualization on Green Screen
00:05
HD
Animated red arrows pointing downward on green screen background, for motion direction, motion animation
00:10
HD
Tanzania Oil Prices Decline with Oil Barrels, Gold Coins and Downward Green Arrow, 3D Economic and Financial Market Concept
00:11
HD
Decreasing Bar Graph Chart With Downward Arrow On Black Background Animation
00:12
HD
Congo Republic Oil Price Falling with Oil Barrels Downward Green Arrow and 3D Financial Data Visualization Graphs for Economy and Business Concept
00:11
HD
Black Friday Price Drop Animation with Downward Arrow and Percent Sign on Green Screen Background
00:08
HD
Neon cloud emissions animation features glowing CO2 text and arrows. Climate pollution concept animates this cloud emissions animation. Carbon footprint reduction drives the cloud emissions animation.
00:13
HD
Weight level indicator scale. Low normal & high meter infographic animation on black background. Showing high weight level color gauge indicator for body weight and health monitoring.
00:10
HD
radiation level indicator scale. Low normal & high meter infographic animation. Showing high radiation level color gauge indicator. on a black background 4k animation video
00:10
HD
water pollution level indicator scale. Low normal & high meter infographic animation. Showing high water pollution level color gauge indicator. on a black background 4k animation video
00:10
HD
Close-up stock market trading screen with market data, trading volume, prices and percentage changes. Investment strategy, analyzing, data spreadsheet, financial figures, trading board, exchange infor
00:10
HD
Neon green recycling sign zooming in slowly against black background with glowing digital symbol for eco concept.
00:10
HD
Merchandise loss concept decreasing business profits, inventory value erosion, financial decline, and theft risk impacting store operations and company assets
00:17
HD
Animated Stress Level Gauge Infographic Illustrating Mental Health Tension and Overwhelm
00:07
HD
Minimalist gold recycling symbol graphic
00:08
HD
priority level indicator scale. Low normal high meter infographic animation on black background. Showing high pressure level color gauge indicator.4k quality animation video
00:10
HD
Low-margin profit tracking visualized on a high-tech monitor illustrating tight financial limits and business revenue contraction
00:15
HD
Interest Rate Decline With Coins
00:06
HD
Security level indicator scale. Low normal & high meter infographic animation on black background. Showing high security level color gauge indicator for safety and risk monitoring.
00:10
HD
glowing neon Percentage growth and decline icon with up and down arrows. financial, business, and statistical analysis. Up and down percentage arrows icon.
00:10
HD
graph chart up down business statistics
00:08
HD
Water Recycling Symbol Animated Icon With Alpha Channel. Sustainable Water Management And Conservation Motion Graphic. Eco-Friendly Practices And Resource. On Transparent Background
00:07
HD
South Africa Oil Prices Decline with Oil Barrels, Gold Coins and Downward Green Arrow, 3D Economic and Financial Market Concept
00:11
HD
Black downward trending graph line over green screen grid. Financial loss chart for corporate business economic market crash. Animated graph chart loop.
00:08
HD
bat wing arm reduction animation, sagging upper arm skin tightening animated video, plastic surgery procedure motion graphics
00:05
HD
Currency exchange icon with two dollar coins and red green arrows in purple outline for money transfer forex finance trading and banking concepts
00:10
HD
Dollar Sign Cutting Corporate Budget Downsizing finance business animation HD 4K
00:10
HD
Immunity level indicator scale. Low Normal High meter infographic animation on black background. Showing high immunity level color gauge indicator for health monitoring and wellness.
00:10
HD
Business growth concept in graph chart showing marketing sales profit increasing to future target . growing business concept. Clean Hi-tech style technology chart
00:10
HD
satureated fat level indicator scale. Low normal & high meter infographic animation. Showing high atureated fat level color gauge indicator. on a black background 4k animation video
00:10
HD
Financial growth animation finance money investment
00:08
HD
3D blue earth world map globe combined with a direct descending red line graph arrow showing sudden economic market crash notification icon popping up on green screen.
00:15
HD
Business concept risk mitigation through financial planning, loss prevention, and managing negative impacts on customers or market conditions
00:17
HD
Person Typing on Laptop with House Icon and Percentage Symbol Illustrating Real Estate and Market Trend Analysis Sigmoid
00:10
HD
Green recycling symbol rotates smoothly through a full circular turn and subtly scales, high quality video footage for sustainability, reuse, waste reduction, and environmental awareness
00:08
HD
Financial Downturn and Economic Recession Analysis Bar Graph
00:10
HD
Decrease in profit on a digital monitor showing steady financial decline for maintaining long term corporate budget adjustments
00:15
HD
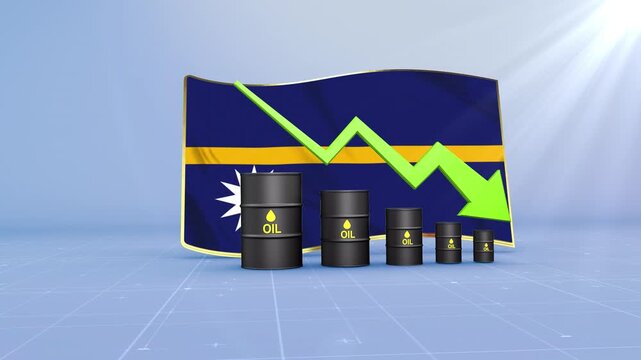
Nauru Oil Price Falling with Oil Barrels Downward Green Arrow and 3D Financial Data Visualization Graphs for Economy and Business Concept
00:11
HD
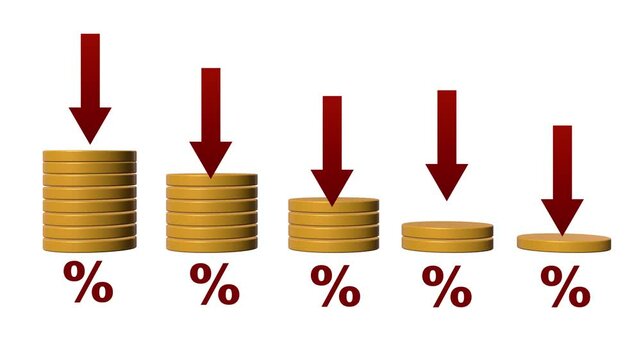
Declining Financial Value Illustrated by Progressively Smaller Coin Stacks, Downward Arrows, and Percentage Symbols, Representing Falling Rates, Reduced Returns, Depreciation, and Economic Decline
00:10
HD
Neon Dollar Sign with Downward Arrows in a Circle
00:10
HD
Business decline bar chart animation with falling line graph and shadow effects on transparent background. Indicate revenue decline, financial loss, negative growth
00:06
HD
Water pollution level indicator scale. Low normal & high meter infographic animation on black background. Showing high water pollution level color gauge indicator for environmental analysis.
00:10
HD
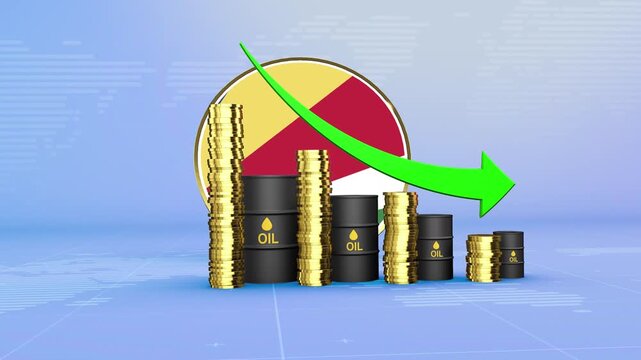
Seychelles Oil Prices Decline with Oil Barrels, Gold Coins and Downward Green Arrow, 3D Economic and Financial Market Concept
00:11
HD
Curved Down Arrow Hand Drawn Animation
00:05
HD
Chart candlestick downtrend crisis crash bankruptcy, low lost market stock trading trade loss negative, financial economy decay graph recession business decrease
00:20
HD
4K animation of Falling Dollar Coin With Red Downward Arrows and Alert Icon Representing Financial Loss
00:06
HD
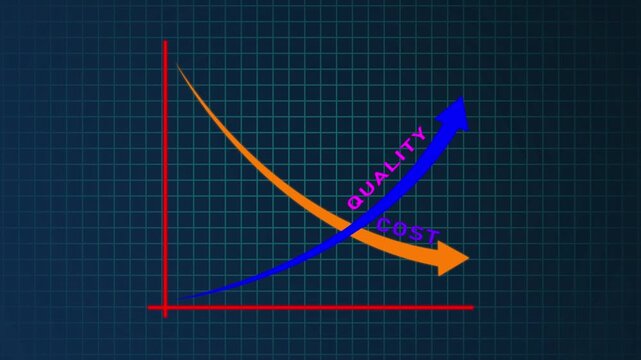
Quality improvement and cost reduction concept with blue quality line rising and red cost line falling. Concept of business strategy, management, efficiency and performance optimization
00:12
HD
Reuse level indicator scale. Low Normal High meter infographic animation on black background. Showing high reuse level color gauge indicator for sustainability and eco-friendly practices.
00:10
HD
2027 New year with change to UP and Down arrow. Interest rate, GDP, stocks market, financial, deflation and Inflation, mortgage, debt, Loan and Economic Recession
00:09
HD
danger level indicator scale. Low normal & high meter infographic animation. Showing high danger level color gauge indicator. on a white background 4k animation video
00:10
HD
metabolism rate level indicator scale. Low normal high meter infographic animation on black background. Showing high pressure level color gauge indicator.4k quality animation video
00:10
HD
energy level indicator scale. Low normal & high meter infographic animation. Showing high energy level color gauge indicator. on a black background 4k animation video
00:10
HD
Stock market candles with falling prices of securities. Loss of assets in equities, showing a decreasing trend, poor performance, and financial losses due to economic crisis.
00:17
HD
Businessman Using Digital Tablet to Analyze Real Estate Market Trends with House Icon and Percentage Decrease Symbol Against Abstract Background Sigmoid
00:10
HD
Reuse level indicator scale. Low Normal High meter infographic animation on black background. Showing high reuse level color gauge indicator.
00:10
HD
Cyan blue segmented downward arrow animation on a black background, ideal for download, navigation, scrolling, decrease, interface, and direction concepts.
00:10
HD
Downside financial exposure highlighted on a modern screen for professional risk management and economic tracking presentations
00:15
HD
Italy Oil Price Falling with Oil Barrels Downward Green Arrow and 3D Financial Data Visualization Graphs for Economy and Business Concept
00:11
HD
Transparent Alpha Channel Falling US Dollar Currency Icon with Red Downward Arrow for Financial Crisis
00:12
HD
Operational expense chart visualizing financial analysis, budgeting, and cost management with rising expenses, risks, and careful monitoring for business strategy and success
00:17
HD
Quality increase and cost optimization for products or services to improve customer satisfaction and enhance company performance. Successful corporate strategy and management. Effective business.4k
00:10
HD
Probability level indicator scale. Low Normal High meter infographic animation on black background. Animation showing high probability level color gauge indicator for statistical analysis and outcome.
00:10
HD
Albania Crude Oil Price Decline with Oil Barrels and Downward Green Arrow
00:11
HD
Bar Chart with Downward Arrow on Green Grid 2026 Animation
00:07
HD
Net zero emissions by 2008 to change climate and net zero greenhouse gas emissions target. Aerial of Net zero environment sustainable development concept. Neon net zero goal achieved.4k video
00:10
HD
Glowing neon line Global economic crisis news icon isolated on black background. World finance crisis. 4K Video motion graphic animation.
00:10
HD
miniature earth planet with a tree Eco-Sustainable Solar Panel Corporate Environment friendly goal development green business strategy global net zero carbon neutral target emission reduction
00:06
HD
Fire danger level indicator scale. Low normal & high meter infographic animation on black background. Showing high fire danger level color gauge indicator for safety and risk monitoring.
00:10
HD
Animated Dollar Icon with Down Arrow on White
00:10
HD
trans fat level indicator scale. Low normal & high meter infographic animation. Showing high trans fat level color gauge indicator. on a white background 4k animation video
00:10
HD
fitness level level indicator scale. Low normal high meter infographic animation on black background. Showing high pressure level color gauge indicator.4k quality animation video
00:10
HD
Capitol Building Silhouette with Decreasing Red Graph Lines Against Grid In Blue
00:08
HD
Stock market crash, red candlestick chart falling arrow, financial decline concept. Business crisis economy downturn, trading loss graph. Stock market crash risk
00:10
HD
Efficacy Level Text or Word Low and Medium to High Meter Concept Animation on Black Background and Blue Screen
00:58
HD
A semi-circular gauge with a color gradient and a needle indicating a moderate level of infection against a black background. infection text or word low and medium to high meter concept.
00:10
HD
Carbon footprint reduction key climate responsibility supporting clean energy sustainability low emission levels through data analysis green technology use for healthier planet future
00:05
HD
Declining Bar Chart with Downward Arrow Representing Financial Loss and Economic Downturn.
00:11
HD
Aland country flag and bar chart graph showing decreasing values a red arrow economic crisis concept. Flag of Aland
00:11
HD
Animated searvice Sector Performance Meter – Increasing and Decreasing Gauge from Good to Best Levels, Comparison Indicator for  Data Visualization,  perfomance, and Motion Graphic Reports
00:10
HD
Business growth and success arrow, growing business chart animation with dollar sign.
00:10
HD