En e-post med en kobling for å angi passordet har blitt sendt til: Du trenger et passord for å få tilgang til kjøpene dine i fremtiden.

Få 3 videoer eller 25 bilder med en Prøv gratis
Nye filtre er lagt til
Sorter etter

9 485 treff for data statistic template i videoer

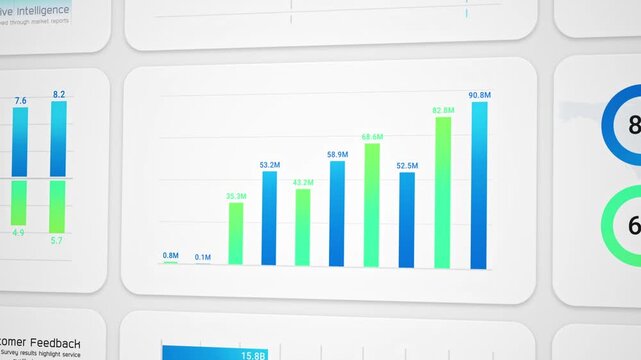
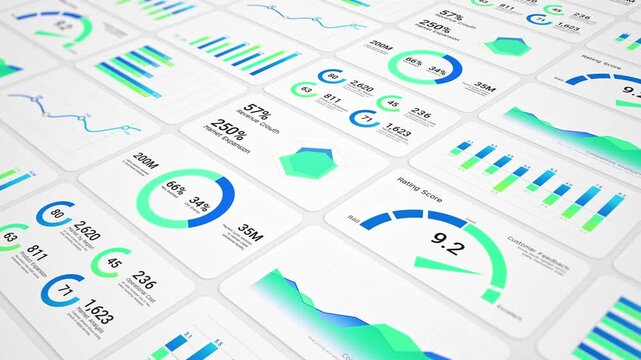
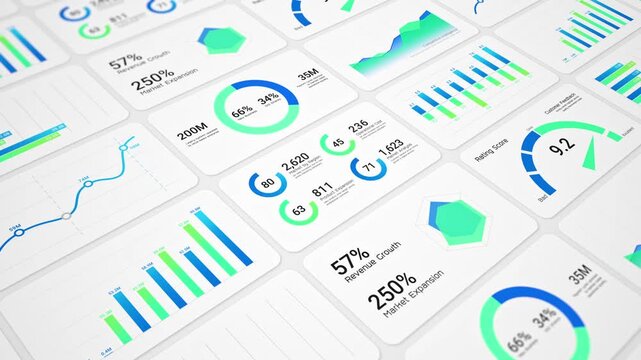
Closeup blue green infographic chart dashboard, Business intelligence and financial performance analysis report, investment data analytic bar graph, success corporate market statistics trend
00:16
HD
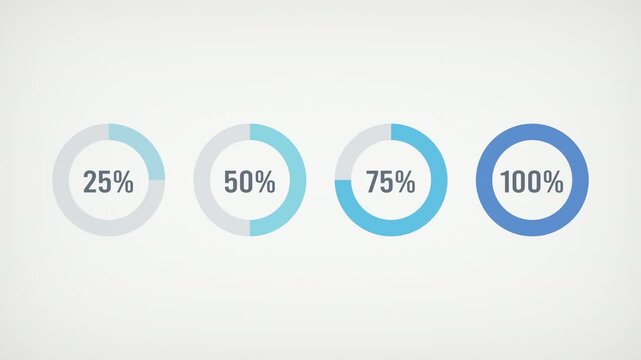
Animated blue and warm tones donut chart showing 25%, 50%, 75% and 100% progress, suitable for data visualization dashboards reports presentations statistics and business analytics.

00:36
HD
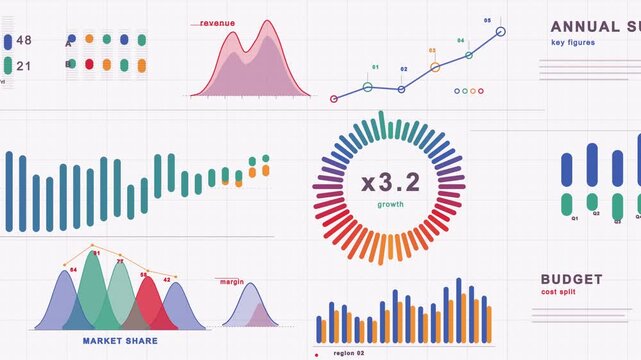
Animated Infographic Elements with Timeline, Bar Charts and Area Graph on Light Grid Background, Annual Report Loop Business Annual Summary Data Visualization with Colorful Capsule Charts and Timeline
00:48
HD
3d infographic animation with 3 steps, infographic with empty rectangle shape, presentation template, report, plan, data
00:10
HD
Abstract business infographic template with animated charts, graphs, world map, and data visualization elements for corporate presentation.
00:07
HD
Digital world analytics screen visual with blue map texture, radar targets, floating numbers, and hexagon pattern. Perfect for data reports, global tech videos, and motion overlays.
00:30
HD
Floating numerical digits counting numbers animated on a green screen chroma key background.  professional superb alpha element effects flying style high cgi overlay transparent imagery animation
00:26
HD
online learning dashboard interface template with skill progress metrics and digital study tracking panels
00:15
HD
Modern business dashboard UI design template featuring clean data analytics graphs and financial metrics charts
00:15
HD
Colorful business infographic tree template with six branching options and text placeholders for data presentation, process workflow, and strategic planning diagrams.
00:06
HD
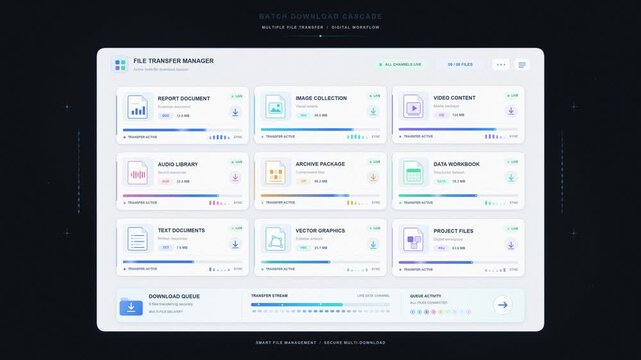
Website app UI infographic dashboard animation, abstract light mode user interface elements analytics loop, modern desktop application data presentation stock clip video
00:15
HD
Cyan dotted line chart drawing across monthly grid on light background, statistics graph animation, clean data growth infographic for presentation
00:20
HD
Advanced AI neural render processing hud progress loading panel animation seamless background overlay a high-tech digital interface showing artificial intelligence rendering progress, tensor
00:15
HD
Neon blue tournament bracket for sports competition and esports events
00:10
HD
neumorphic circular infographic template featuring eight numbered option branches and vibrant colorful accents for data presentation
00:05
HD
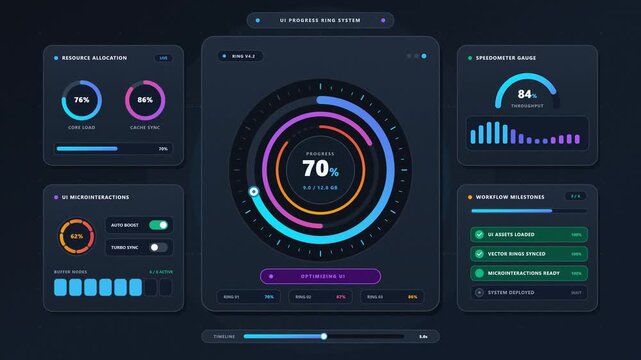
Resource allocation, dashboard and project management interface for business planning, data analysis and corporate efficiency. Software, task tracking and digital report with growth statistics
00:10
HD
abstract digital background with glowing lines and particles moving in waves, technology and data concept
00:10
HD
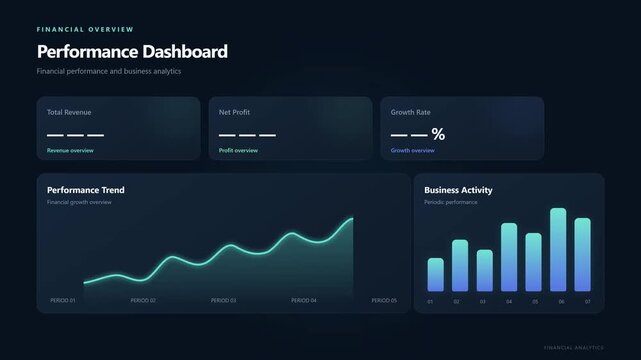
Modern dark UI glassmorphism area chart graphic template for business analytics and data visualization
00:10
HD
AI risk analytics dashboard showing operational signal data charts on
00:15
HD
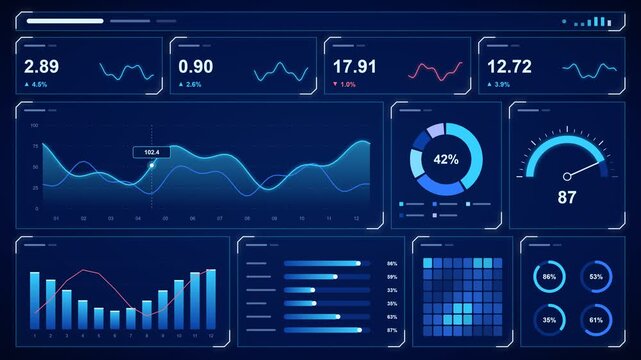
Futuristic blue data analytics dashboard screen with animated line graph, donut chart, gauge, bar charts and heat map panels on a dark digital interface background
00:15
HD
Business intelligence and financial performance analysis report on white background, animated infographic bar chart loop, investment data analytic graph dashboard, enterprise market statistics trend
00:14
HD
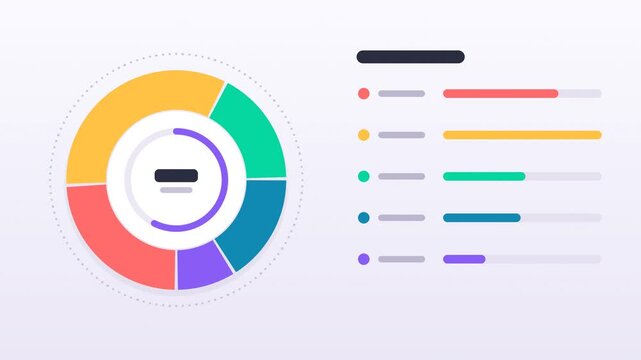
Colorful donut pie chart infographic with changing segments and progress bars, business statistics and data visualization template, seamless loop 4K
00:10
HD
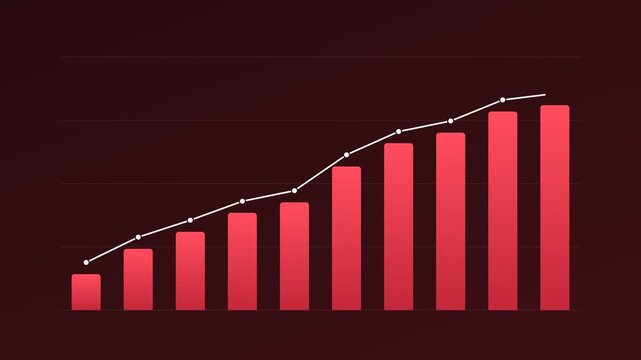
Animated bar chart with trend line without text or numbers, blank red business infographic template 4K
00:10
HD
Futuristic dark user interface design with glowing graphs charts and data visualization elements.
00:10
HD
Modern dashboard UI with charts graphs and data visualization elements
00:06
HD
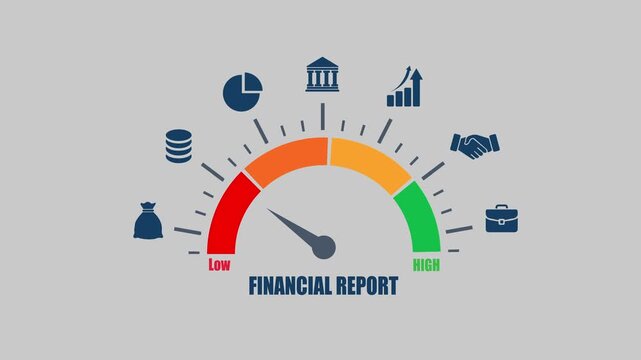
Financial report analytics gauge meter for corporate performance review, company audit score indicator concept, business accounting data vector graphic.
00:16
HD
Financial data analytics dashboard with interactive charts and graphs displaying business statistics on blue screen
00:06
HD
Animated Percentage Counter 0 to 100 Percent, Alpha Channel
00:06
HD
Mobile analytics dashboard interface shows performance charts, progress metrics, reports, notifications, data insights, digital monitoring, business statistics, smartphone application design
00:15
HD
Modern business analytics dashboard UI template with colorful charts, graphs, and financial data visualization elements for web and mobile applications
00:10
HD
Financial dashboard displaying revenue growth and data analytics
00:15
HD
Futuristic technology animation science fiction, Digital background with transparent screen surface, glowing engineering computer connections HUD futuristic UI viewfinder frame scifi technology data
00:30
HD
Animation of blue squares with white markers over grid background
00:10
HD
Core system override data visualization shows progress bars on a dark computer monitor.
00:10
HD
Green screen market news lower third template
00:15
HD
Uploading circle loads on the device screen with a smooth animation. Software uploading process. Please wait uploading in progress. motion graphic of Circular loading concept.
00:10
HD
Futuristic digital interface with glowing neon circle, data charts, and information panels, ideal for technology and analytics concepts
00:06
HD
Circular progress indicator showing fiftyfive percent multicolored horizontal bar chart for data analytics interface. Suitable for business presentations or infographic designs.
00:10
HD
a statistical data that shows the level of intelligence in various types
00:10
HD
Business intelligence and financial performance analysis report on white background, animated infographic bar chart, investment data analytic graph dashboard, success corporate market statistics trend
00:15
HD
Business intelligence and financial performance analysis report on white background, animated infographic bar chart, investment data analytic graph dashboard, success corporate market statistics trend
00:16
HD
Comprehensive executive analytics dashboard template showcasing real time enterprise performance, total revenue stats, trajectory trends, and regional allocation charts
00:05
HD
Report generation dashboard user interface animation with weekly blue bar chart and progress percentage for data analytics digital template
00:06
HD
This futuristic digital user interface demonstrates Dark Store Automation with colorful interactive data charts performance statistics and system nodes on a dark background
00:06
HD
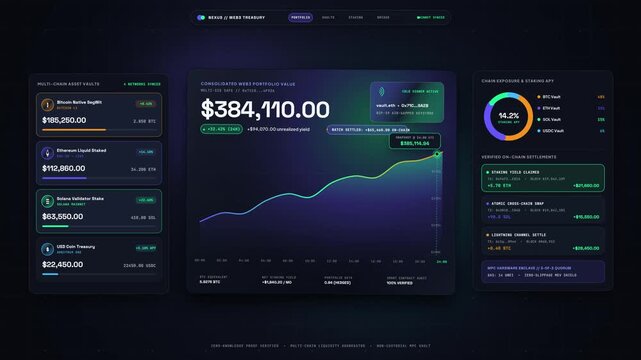
Futuristic financial dashboard interface, dark mode crypto analytics UI design, neon purple data visualization screen, business investment tracking template 4k
00:10
HD
glowing 1923 number on dark background with neon effect, historical date for retro events and anniversaries. digital 1923 data display with vibrant blue light, perfect for vintage year timeline.
00:11
HD
Business analytics infographic charts and graphs for corporate data reporting statistics presentation and performance tracking animation
00:12
HD
Futuristic business dashboard with data visualization charts
00:10
HD
Circular digital template interface with business and central text label on a dark blue background with glowing network nodes and data lines
00:10
HD
Modern dark mode financial performance dashboard UI mockup featuring line charts, bar graphs, and key performance indicators for business analytics and data visualization
00:05
HD
Glowing data bars and animated graphs moving across a clean dark blue background template
00:10
HD
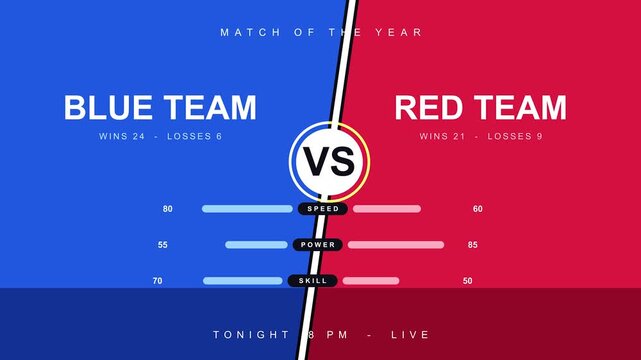
Versus comparison screen showing blue team and red team statistics for esports match event motion graphic animation
00:10
HD
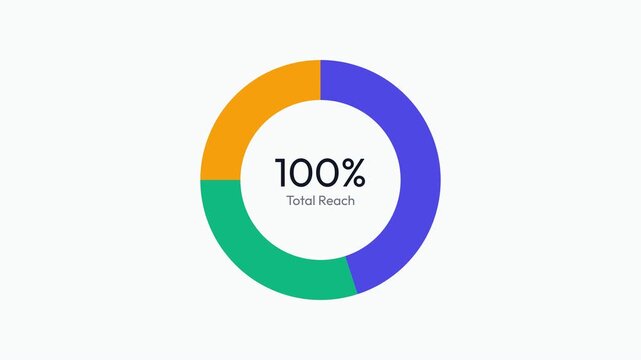
Donut chart animation showing one hundred percent total reach for marketing data presentation
00:10
HD
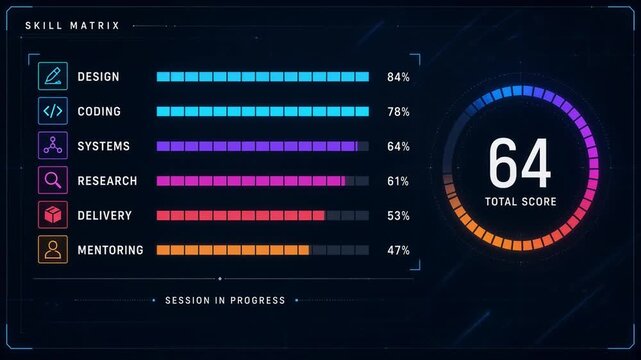
Futuristic hud user interface dashboard template for skill evaluation stats data analytics performance scoring dark digital control panel
00:10
HD
Modern user interface dashboard wireframe showing analytics data charts and metrics layout
00:20
HD
Dark UI design mockup for proactive healthcare management. Digital dashboard panel featuring data charts, patient trends, and modern medical technology interface on black background
00:10
HD
Futuristic UI interface with glowing icons and data visualization, digital technology concept, blue and purple gradients
00:06
HD
Blue floating data cubes background with glowing hologram blocks, numeric labels, and deep digital network space. Perfect for analytics videos, cloud storage intros, tech demos, and visual overlays.
00:30
HD
Business productivity dashboard screens with data charts and graphs
00:15
HD
Set of modern infographic elements for business data visualization
00:10
HD
Business intelligence and financial performance analysis report on white background, animated infographic bar chart loop, investment data analytic graph dashboard, enterprise market statistics trend
00:14
HD
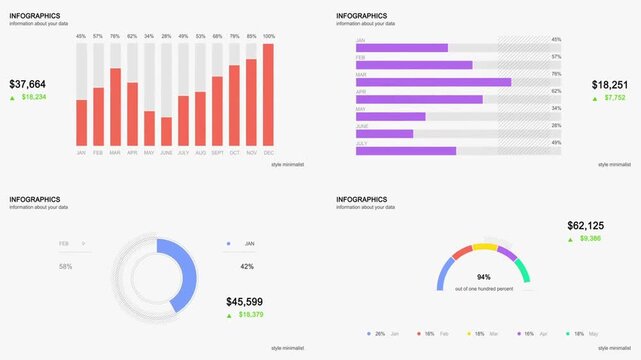
Minimalist business infographics pack animation with bar chart, line graph, doughnut chart, and progress semi-circle meter. Financial data visualization on a white background.
00:11
HD
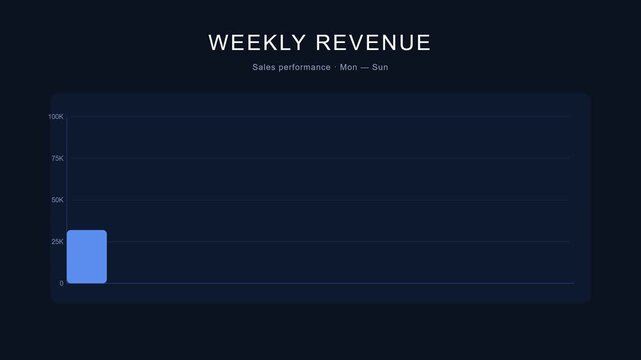
Weekly revenue sales performance animated chart for corporate financial dashboard and business data analytics presentation template
00:06
HD
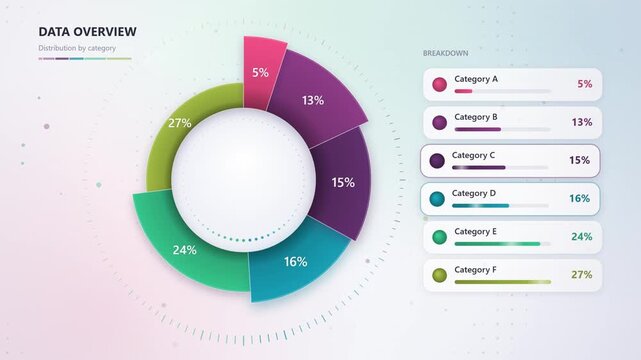
Circular infographic chart template with colorful percentage segments and category breakdown for business data visualization
00:10
HD
Futuristic fitness dashboard UI design, dark neon health tracking interface, digital workout analytics screen, modern sports app data visualization 4k
00:10
HD
Animated motion graphic displaying a financial bar and line chart with data visualization, showing growth and trends
00:07
HD
Animated bar chart with trend line without text or numbers, blank navy business infographic template 4K
00:10
HD
Animated four seasons year cycle infographic with seasonal data
00:10
HD
Futuristic HUD interface displaying interactive data graph and analytical metrics
00:10
HD
Minimalist digital dashboard interface with financial data visualization and line charts.
00:15
HD
Modern infographic template with six colorful rounded text boxes and pointer callout elements connected to a central white circular node for data presentation
00:10
HD
colorful pie chart analysis window displays statistical data centered on dark digital dashboard interface with various line graphs and progress bars shown in the blurred background
00:06
HD
Dashboard interface design template with completion rate progress bar and statistics metrics for business data analysis
00:10
HD
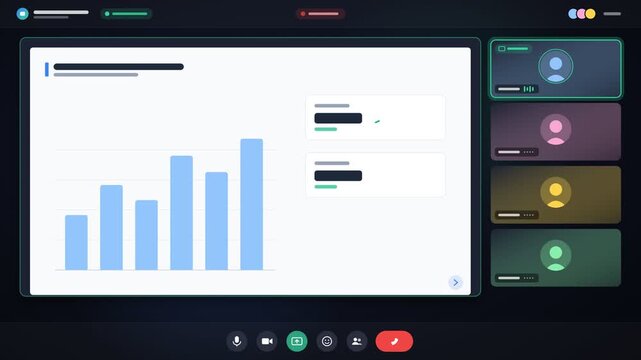
Animated video conference screen share showing bar chart and donut chart data presentation with participant thumbnails
00:15
HD
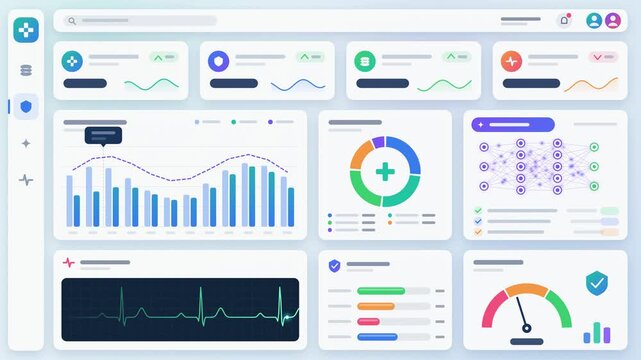
Modern SaaS dashboard UI with analytics cards and clean data overview.
00:15
HD
Modern infographic template with animated four step numerical list progress bars and green animation
00:16
HD
Animated dashboard interface with charts and data visualization, digital analytics and progress tracking
00:06
HD
Business infographic, blue gradient charts, financial data visualization, corporate statistics HD animation
00:10
HD
Modern dashboard UI mock-up, clean analytics interface with charts, digital software screen on green background, business data visualization template
00:08
HD
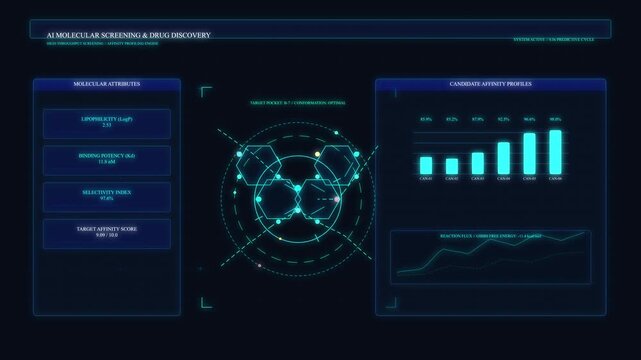
Futuristic digital dashboard displaying radar data, graphs, charts, and statistics for analysis, tech interface, big data visualization
00:06
HD
Closeup blue green infographic chart dashboard, Business intelligence and financial performance analysis report, investment data analytic bar graph, success corporate market statistics trend
00:16
HD
Infographics element template dashboard data visualization animation background.
00:09
HD
Futuristic financial dashboard interface, dark mode crypto analytics screen, neon data visualization UI template for fintech apps 4k
00:10
HD
Dynamic green screen analysing progress bar animation with percentage counter and circular loading indicator loop for seamless digital technology and data processing presentations
00:10
HD
Digital business pyramid and data analytics for corporate strategy, marketing success and network growth. Technology, big data and statistics with financial charts, global connectivity and commerce
00:06
HD
Abstract futuristic digital interface display with glowing data visualizations, charts and graphs, motion graphic loop
00:06
HD
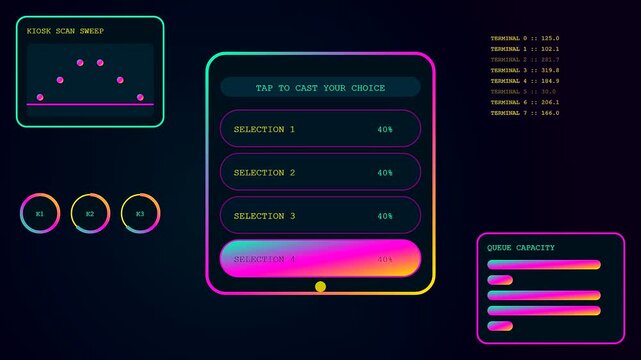
An interactive poll interface displays selection progress and data streams on a sleek digital screen set against a dark moody atmosphere for modern user analysis
00:06
HD
Neon Red Falling Line Graph with Downward Arrows and Declining Trend Animation
00:10
HD
Social Media Data Analytics Dashboard Animation On White Background
00:10
HD
Dynamic digital year counter animation: rapidly scrolling calendar years for time travel and historical timeline projects
00:08
HD
Animated analytics dashboard interface with data charts statistics and KPI metrics loading on screen
00:12
HD
Modern responsive user interface digital dashboard template featuring sleek interactive product cards for motion render data visualization and web application design
00:10
HD
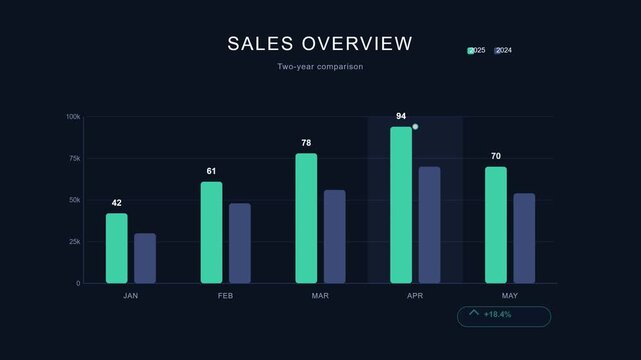
Sales overview bar chart financial data analytics dashboard animation with two year comparison for business marketing strategy template
00:06
HD
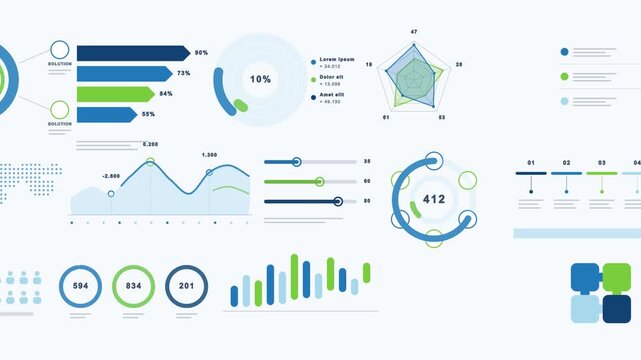
Business infographic data animation with donut charts, percentage bars, radar chart, pyramid, dotted world map, area graph, sliders and circular counters, blue green statistics seamless loop
00:48
HD
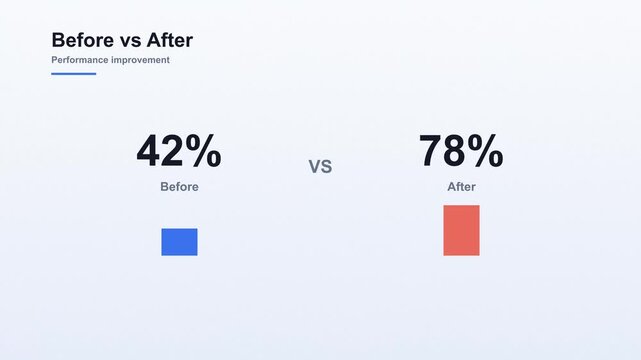
Light theme animated comparison chart showing performance improvement before versus after
00:10
HD
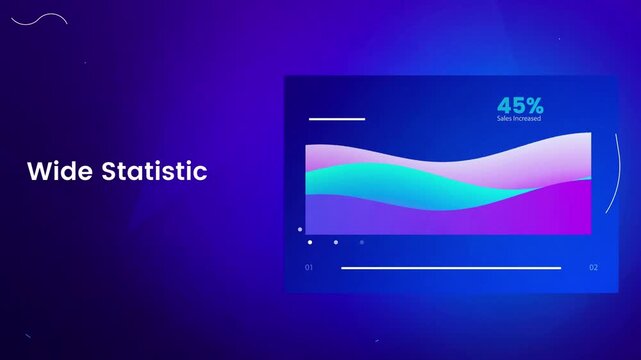
Animated wide statistic data visualization displaying moving wave graphs and percentages for corporate business presentations in this motion digital video
00:07
HD
Motion graphic animation of a futuristic dashboard interface with glowing charts and data visualization elements on a dark background, representing technology and analytics
00:06
HD
Business data presentation. Abstract elements of graph, diagram with 4 steps, options, parts or processes. Business template for presentation. Infographic concept
00:09
HD
Number counter animation from 0 to 1,000,000,000 on a transparent background, Animated counting Numbers of one billion in 4k animation with alpha channel
00:06
HD
HUD Futuristic Digital Data and infographic elements. Looped motion virtual technology background. For Screensaver, Background. Motion Abstract Binary Decimal Statistics Monitor Display.
00:22
HD