Een koppeling om je wachtwoord in te stellen is verzonden naar: Als je in de toekomst toegang wilt tot je aankopen, heb je een wachtwoord nodig.
Krijg 10 Stock-afbeeldingen bij een gratis proefperiode
Nieuwe filters toegevoegd
Sorteren op

154.350 resultaten voor interface statistic vector in alles

5.463 resultaten in video
Digital dashboard interface with animated data visualization charts and energy monitoring metrics
00:10
HD
futuristic ai automation dashboard interface with data analytics charts and progress indicators in red
00:09
HD
Advanced ai ddos mitigation control center dashboard for live threat neutralization, traffic graphs, attack vectors, for cybersecurity, network monitoring, system protection
00:20
HD
Data analytics dashboard panels on chroma key green background
00:12
HD
Futuristic HUD interface animation with morphing data charts and vector panels
00:10
HD
Set of glowing blue neon data charts and digital info graphs with futuristic interface elements
00:10
HD
Modern UI vector animation displaying dashboard analytics interface with interactive charts and search magnifying glass graphic
00:11
HD
Digital displays showing an agile backlog provide a neon interface for tracking progress across multiple data tiers in a sleek modern software monitoring system
00:06
HD
dynamic data visualization interface featuring bar charts and interactive infographics for business intelligence analysis, dashboard monitoring, reporting, financial metrics, performance tracking
00:09
HD
A digital collaboration invite expands as network nodes emerge from a central profile icon on a dark monitor display with changing analytical data panels below
00:06
HD
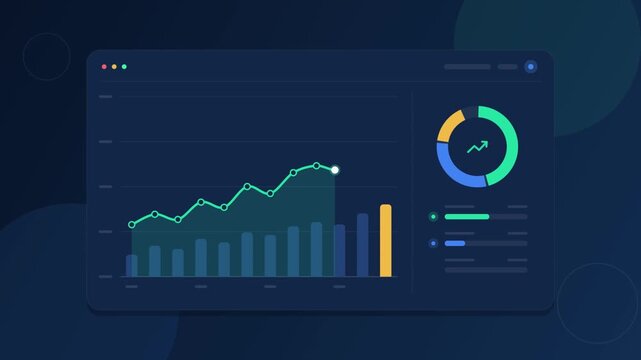
Financial growth dashboard interface with line graph and chart analytics vector illustration concept
00:10
HD
Pressure gauge needle rising to maximum capacity
00:15
HD
A fluid stream commerce visual interface features digital graphical charts displaying changing numerical values within a dark frame setup for rapid data processing and analytical monitoring
00:06
HD
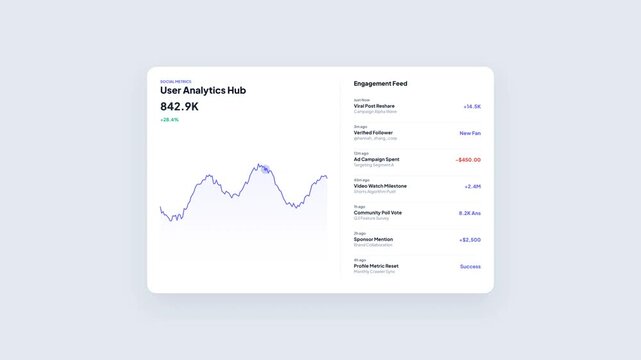
User Analytics Hub Marketing Social Performance Dashboard with Moving Line Graph Trend and Engagement Feed Activity Stream Notification Animation
00:08
HD
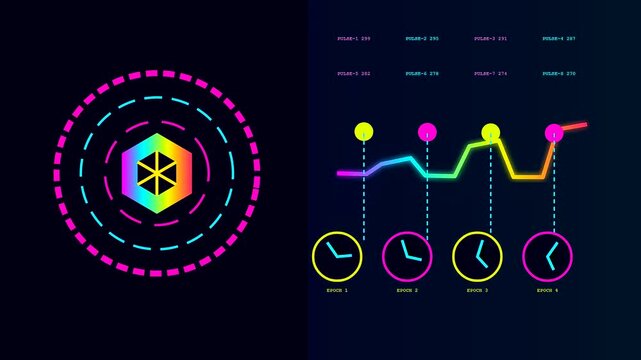
Data flow lines showing blockchain tracking with floating hexagonal symbols and glowing interface elements changing values over time in a vibrant digital monitor display screen environment
00:06
HD
Digital HUD interface with animated charts and data visualization
00:10
HD
Futuristic financial stock market graph trading data interface hud screen
00:15
HD
Futuristic digital data graph with blue bars and glowing elements HUD interface
00:05
HD
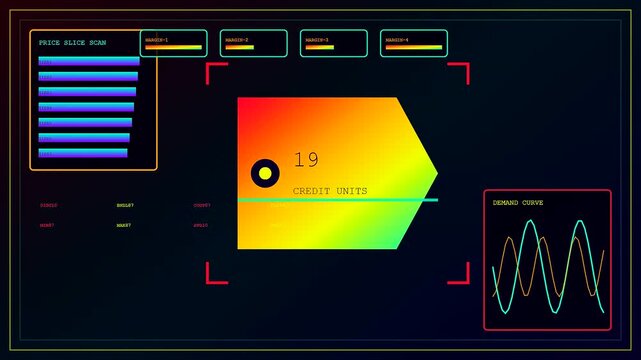
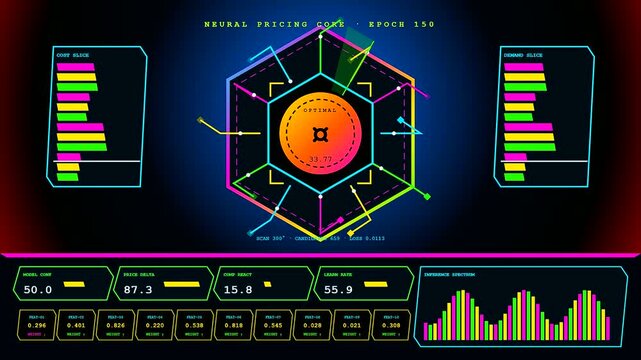
A sequence showing dynamic pricing metrics updating across three vibrant hexagonal monitors that display shifting statistical data bars and glowing numerical figures within a dark interface
00:06
HD
Packet inspection processes appear on a dark interface displaying animated network node connections and shifting numeric statistics in a cycle of digital surveillance data visualization
00:06
HD
Laptop computer displaying financial data dashboard on transparent background. 4K Alpha Channel
00:08
HD
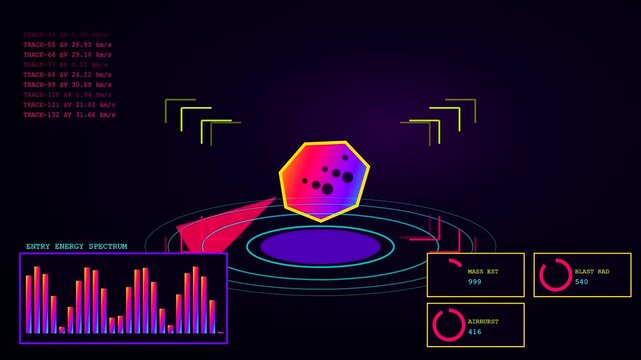
Catastrophe mapping display shows complex scientific data metrics for celestial object impact trajectory analysis on a dark glowing interface screen with multiple dynamic analytical interface panels
00:06
HD
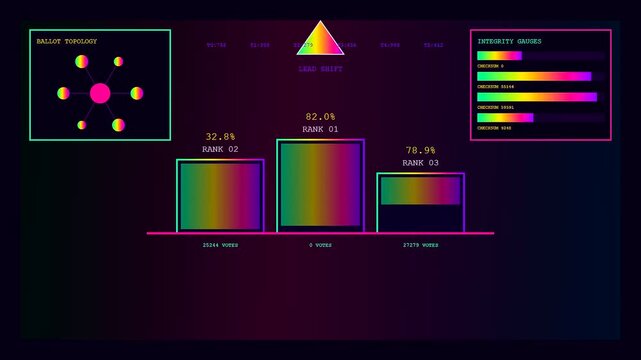
An interactive poll visual interface displays changing election statistics across three distinct screen captures showing shifting voter rank data and gradient bar chart graphics
00:06
HD