Een koppeling om je wachtwoord in te stellen is verzonden naar: Als je in de toekomst toegang wilt tot je aankopen, heb je een wachtwoord nodig.
Krijg 3 video's of 25 afbeeldingen bij een gratis proefperiode
Nieuwe filters toegevoegd
Sorteren op

19.768 resultaten voor increase and decrease in video's

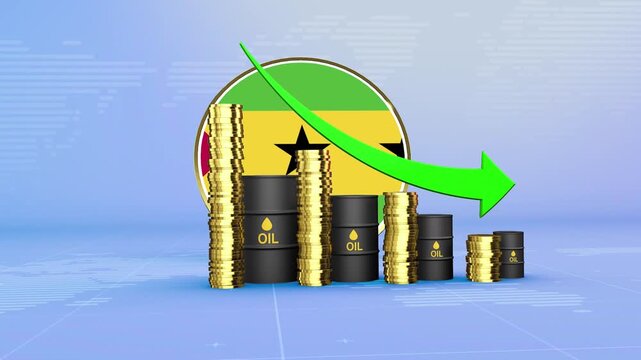
Sao Tome and Principe Oil Prices Decline with Oil Barrels, Gold Coins and Downward Green Arrow, 3D Economic and Financial Market Concept
00:11
HD
Purple bar chart showing downward trend with arrow graph. Financial loss chart for corporate performance failure metrics. Digital bar chart animation for network alert.
00:12
HD
stroke level indicator scale. Low normal & high meter infographic animation. Showing high stroke level color gauge indicator. on a white background 4k animation video
00:10
HD
Business graph. loss graph direction. damage business graph. down business graph icon. business or finance concept icon animation.
00:07
HD
Digital Data Visualization with Bar Charts Blue and Orange Bars on Dark Background
00:10
HD
Candles of the stock market, price falls. Falling prices of securities. Loss of assets in equities stock. Decreasing trend showing unsuccessful performance and losses failure due to economic.
00:10
HD
glowing neon Global business analyzing concept with trade. Financial figures and charts showing a downward trend, business crash and economic collapse 4k video animation.
00:10
HD
Market index fund investment strategy involving financial analysis, portfolio management, and monitoring market trends for passive income growth and long term asset accumulation
00:17
HD
Red rectangular stamp with the word WARNING in distressed white font on a white background
00:06
HD
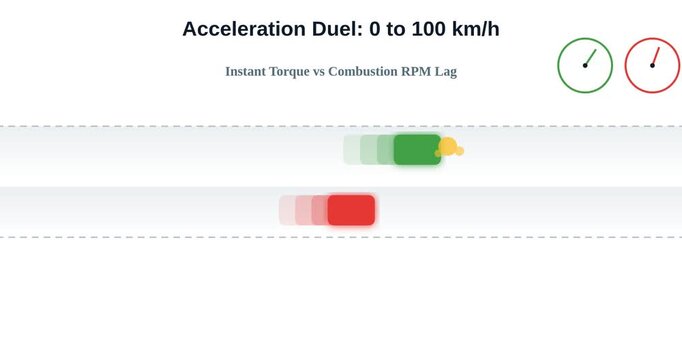
acceleration race
00:10
HD
Illicit trade of Opioids tramadol and oxycodone or oxy is significant public health danger. Supplies contaminated with potent synthetic fentanyl. Counterfeit pills increases risk of fatal overdose.
00:17
HD
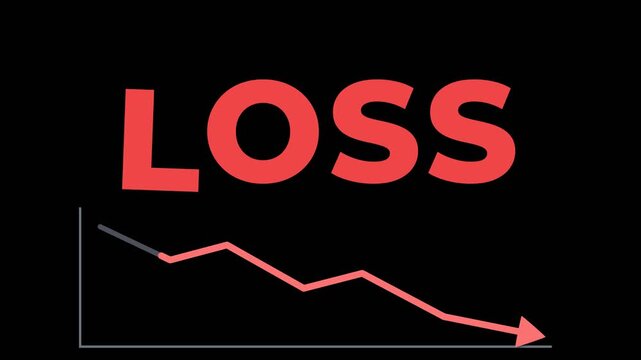
word LOSS dips letter by letter as a red downward graph line draws beneath it and ends in a descending arrow. Useful for financial loss with a transparent alpha channel for compositing
00:08
HD
Modern digital representation of artificial intelligence with quality and cost indicators over a keyboard, showcasing technology and innovation in business analytics Sigmoid
00:10
HD
Hand drawn white zigzag arrow moving upward and downward on a dark background. 4K horizontal video
00:06
HD
25 percent off discount badge isolated on dark background.
00:06
HD
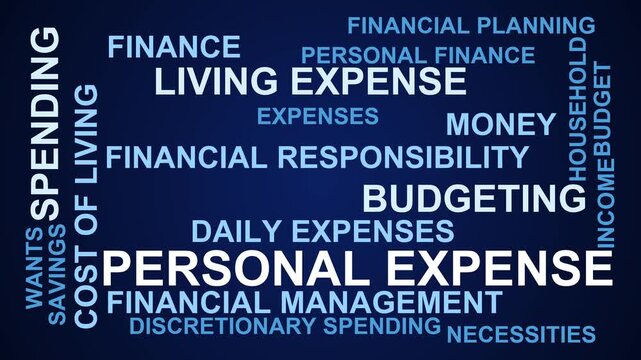
Personal Expense Word Cloud
00:11
HD
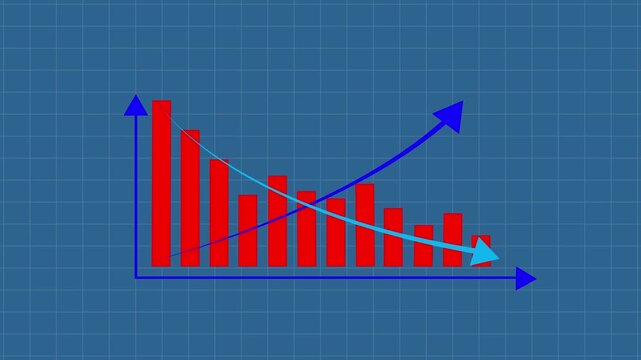
Red bar chart with line graph showing cost reduction and improving quality.. growing business concept.
00:10
HD
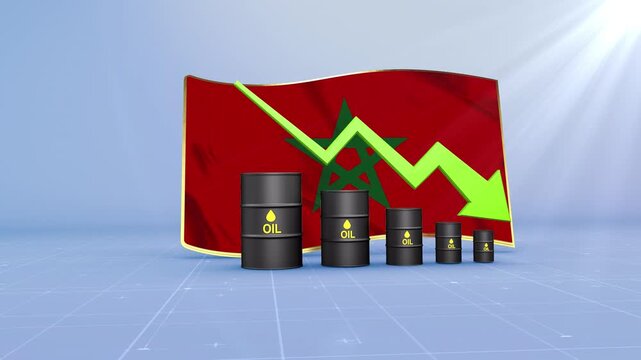
Morocco Oil Price Falling with Oil Barrels Downward Green Arrow and 3D Financial Data Visualization Graphs for Economy and Business Concept
00:11
HD
Global business line animation. Abstract glowing neon line business graph growth arrow to down arrow.  loss, and negative trends on a dark, abstract background
00:10
HD
Volume Level Control Animation with Speaker Sound Wave, Plus and Minus Buttons on Soft Peach Background
00:09
HD
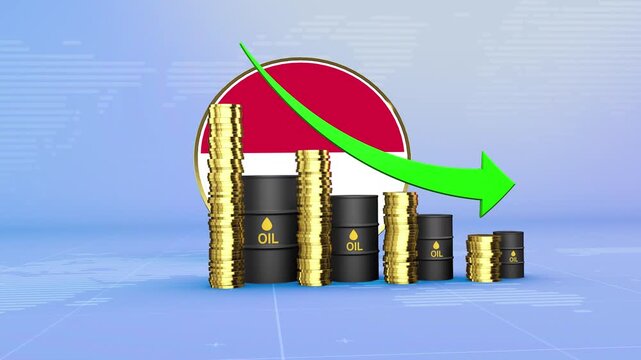
Monaco Oil Prices Decline with Oil Barrels, Gold Coins and Downward Green Arrow, 3D Economic and Financial Market Concept
00:11
HD
Close up of moving digital Business Growth Financial Trading Chart and Stock Market Data Animation looping Seamless Motion Background. Business stock data concept
00:27
HD
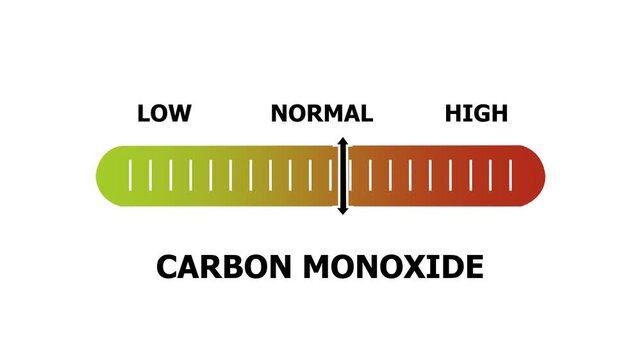
carbon monoxide level indicator scale. Low normal & high meter infographic animation. Showing high carbon monoxide level color gauge indicator. on a white background 4k animation video
00:10
HD
Commercial infographic animated 3D pyramid consisting of 6 blocks
00:07
HD
Bright white 3D number 2039 text animation floating against a deep black void offering a vibrant and modern visual for the year with a sense of digital energy.
00:10
HD
Bar Chart, Profit Down, financial decline trend line chart, Economic crisis, recession, inflation, decrease graph. Bar chart Profit down. Concept of economic crisis, recession, inflation.
00:10
HD
Red chart background glows with financial data. White and orange candlesticks show market movements. Green and yellow lines track rising and falling trends
00:10
HD
Graphic displaying financial market trends with an upward revenue arrow, currency investing hand, rising coins, and a downturn risk with a dollar sign decrease and warning flame
00:17
HD
New Arrivals Discount Offer Precision Quality Advertisement.
00:15
HD
Finance fund stocks price increase and decrease charts arrow up and down, ticker display. table grid Stock exchange screen number with financial trade index rates
00:20
HD
Growth medium, text, word level concept. 4K video. on transparent background.
00:10
HD
Futuristic dollar countdown timer animation, glowing dollar symbol integrated with a circular countdown display, numbers decreasing smoothly from 0 to 30,
00:10
HD
Digital Concept of Real Estate Market with Keyboard and Percentage Sign, Showing Trends in Housing Prices and Economic Data Analysis Sigmoid
00:10
HD
Financial Stock Market Graph Showing Upward and Downward Trends with Data Analysis
00:15
HD
inflation Increased product sales growth basket , market or consumer price index concept shopping cart with food increase with arrow graph on the coin inflation VAT.4k motion graphics video animation
00:05
HD
Animated Stress Level Gauge Infographic Illustrating Mental Health Tension and Overwhelm
00:07
HD
Stamina level indicator scale. Low Normal High meter infographic animation on black background. Animation showing high stamina level color gauge indicator for fitness and endurance monitoring.
00:10
HD
Burundi Crude Oil Price Drop with Oil Barrels Downward Green Arrow and 3D Financial Data Visualization Graphs for Economy and Business Concept
00:11
HD
Close-up trading screen with index charts, currency and sector data, stock market information. Business, trading board, computer screen, prices, trading volume, investment, financial markets.
00:10
HD
Artificial Intelligence Reducing Cost and Increasing Quality Concept, AI Chip Process Automation, Cost Down Quality Up Neon Glowing Digital Diagram Motion Graphics Animation Video
00:08
HD
Costa Rica Oil Prices Decline with Oil Barrels, Gold Coins and Downward Green Arrow, 3D Economic and Financial Market Concept
00:11
HD
Modern line graph displays falling investment market trends. Technical line graph monitors negative corporate revenue data. Financial crisis concept with digital line graph.
00:10
HD
Animation of business graph on black background. 4k video
00:10
HD
Financial Market Decline and Economic Downturn Falling Dollar Value, Decreasing Wealth, Shrinking Investment Returns, Lower Asset Prices, and Increasing Financial Risk
00:10
HD
Bright white 3D number 2002 text animation floating against a deep black void offering a vibrant and modern visual for the year with a sense of digital energy.
00:10
HD
climate justice level indicator scale. Low normal & high meter infographic animation. Showing high climate justice level color gauge indicator. on a black background 4k animation video
00:10
HD
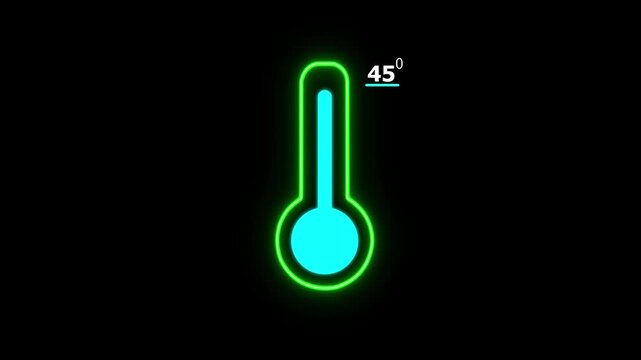
Neon Celsius thermometer displayed temperature 45 degree. Digital Temperature Meter Display 45°C. That's indicates weather temperature 45 degree increase or decline.4k video.
00:10
HD
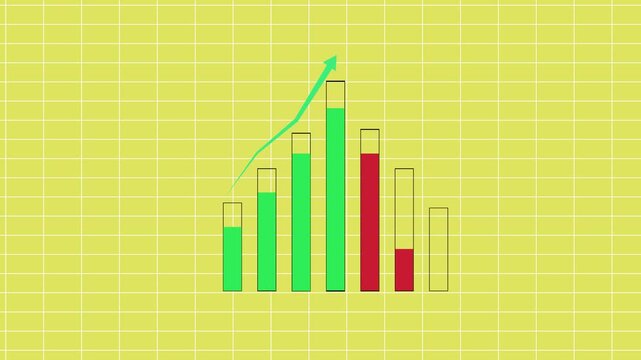
A graph is plotted against a lime-yellow background; the green elements, which represent gains, are trending upward and are marked with arrows, while the red elements, representing losses, are positio
00:10
HD
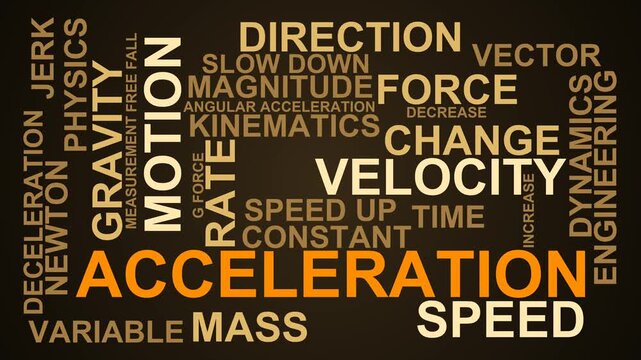
Acceleration Word Cloud
00:11
HD
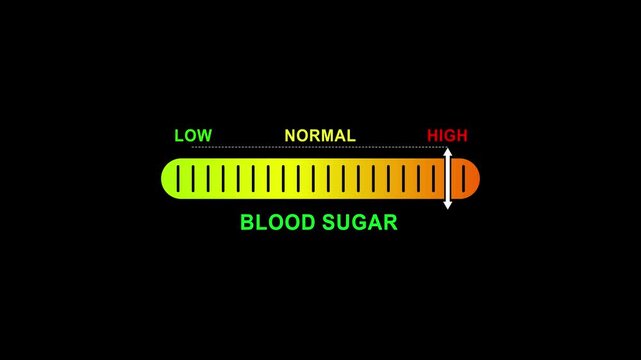
blood sugar level indicator scale. Low normal high meter infographic animation on black background. Showing high pressure level color gauge indicator.4k quality animation video
00:10
HD
Business concept visualizing human resource management, assessing employee potential, analyzing productivity metrics, and optimizing labor allocation for efficient organizational development
00:17
HD
Bar chart and line graph icon showing financial data trend analysis and business performance animation
00:10
HD
Business professionals engage with mobile devices while showcasing a timeline for carbon neutrality from 2026 to 2050, emphasizing commitment to sustainability and innovation. Raster
00:15
HD
US dollar coin inflation rise and fall value financial animation HD 4K
00:12
HD
Arrow up business graph icon animation. Increasing business growth chart animation. Going up business graph concept.
00:07
HD
Global financial market crash with downward arrow and graph on digital red grid background showing crisis and economic collapse impact concept- 4k black background icon animation
00:10
HD
Sales funnel infographic showing lead conversion and cost reduction
00:06
HD
Sri Lanka Oil Price Falling with Oil Barrels Downward Green Arrow and 3D Financial Data Visualization Graphs for Economy and Business Concept
00:11
HD
Wellness level indicator scale. Low normal & high meter infographic animation on black background. Showing high wellness level color gauge indicator for health and lifestyle monitoring.
00:10
HD
Carbon capture and offset icon depicting green plant sprout growing out of co2 cloud symbol vector
00:15
HD
Moldova Oil Prices Decline with Oil Barrels, Gold Coins and Downward Green Arrow, 3D Economic and Financial Market Concept
00:11
HD
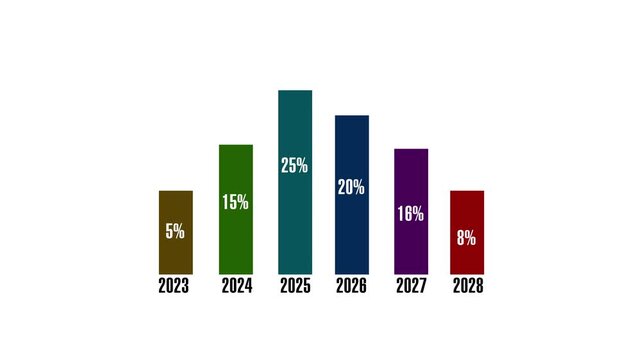
Annual bar chart animation tracks multi year percentage growth data. Corporate financial progress metrics update the bar chart. Long term investment success drives this bar chart.
00:06
HD
Minimalist Animated Graph Showing Business Growth and Decline
00:08
HD
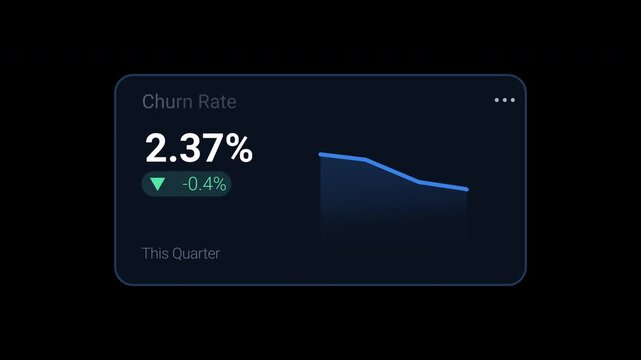
Churn rate Blue fintec KPI dashboard card showing customer loss percentage, decrease indicator and trend chart. Animated motion graphics component for subscription analytics, SaaS reports, retention
00:10
HD
Bright white 3D number 2046 text animation floating against a deep black void offering a vibrant and modern visual for the year with a sense of digital energy.
00:10
HD
Integration concept with connected business systems, seamless data flow, workflow automation and modern corporate technology infrastructure visualization.
00:12
HD
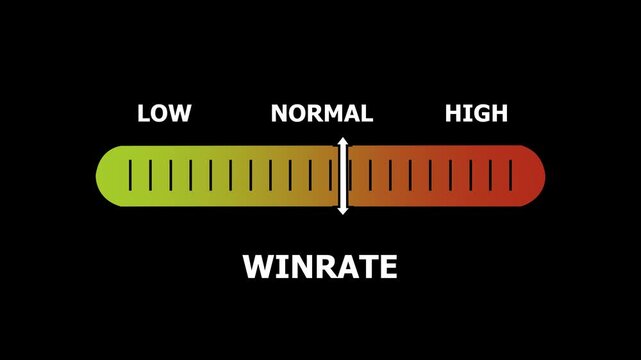
winrate level indicator scale. Low normal & high meter infographic animation. Showing high winrate level color gauge indicator. on a black background 4k animation video
00:10
HD
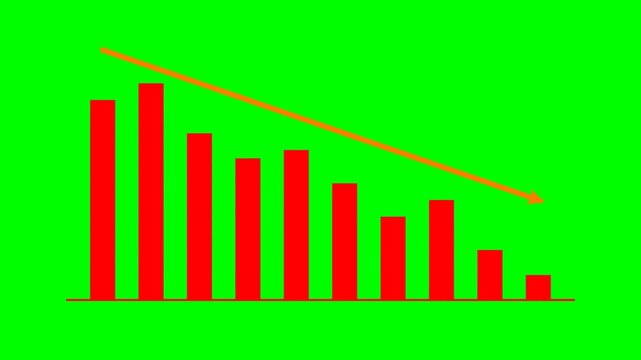
Professional HTML and SVG animated vertical bar chart featuring ten red bars showing a declining trend and an orange downward diagonal arrow on a solid chroma key green background.
00:10
HD
Business Bar Chart Growth Report Data Visualization On White Background
00:10
HD
Abstract increase icon on black background. Dollar rate up looped icon. Reduce costs sign and symbol. motion video 4k quality..
00:06
HD
Loss prevention plan concept strategic financial management, risk reduction, profit increase, and business growth through calculated actions and analysis
00:17
HD
Downward zigzag arrow symbolizing decline loss or falling trend animation
00:05
HD
Robotic hands analyze a digital cost graph in a sleek financial environment, showcasing the blend of advanced technology and data-driven business strategies. Synapse
00:12
HD
Green arrow pointing down over a dollar sign icon on a black background
00:10
HD
Zoom in and out animation the map symbol. Large black symbol in the center and four small symbols around. Seamless looped 4k animation on white background
00:12
HD
Business analytics trend arrow growth indicator overlay
00:10
HD
Zigzag line with a downward arrow falling trend loss decline and negative business direction animation
00:06
HD
France Oil Price Falling with Oil Barrels Downward Green Arrow and 3D Financial Data Visualization Graphs for Economy and Business Concept
00:11
HD
Selenium level indicator scale. Low normal & high meter infographic animation on black background. Showing high selenium level color gauge indicator for nutrition and antioxidant health monitoring.
00:10
HD
White downward arrow for cost and upward arrow for with percentage symbols on a solid black background for business performance analysis
00:10
HD
Belarus Oil Prices Decline with Oil Barrels, Gold Coins and Downward Green Arrow, 3D Economic and Financial Market Concept
00:11
HD
Increase counting numbers 0 to 50k digital clock or timer display with decimal point.4k motion graphics video animation
00:10
HD
Mental Health First Aid Word Cloud
00:11
HD
Concentrated urine, a dark yellow to amber urinary fluid with elevated solute concentration, increased specific gravity, and reduced water content studied in renal and clinical physiology
00:06
HD
Glowing green neon continuous line forming up and down arrows isolated on black background, perfect for finance, trade, and data exchange concept.
00:10
HD
Animated Bar Graph Data Visualization with Rising and Falling Columns on Grey Background
00:10
HD
Line icon of colored circles with a red upward arrow and green downward arrow representing data trend increase and decrease indicators being shown
00:10
HD
A 3d rendered bar chart showing a downward trend with blue and green blocks on a white background
00:08
HD
Data Optimization Workflow: Transforming Business Losses to Financial Growth and Profit
00:07
HD
glowing neon Percentage growth and decline icon with up and down arrows. financial, business, and statistical analysis. Up and down percentage arrows icon.
00:10
HD
Rising blue arrow line graph and chart on white background showing upward trend with labeled X and Y axes for data analysis, business growth, increase, and trend visualization
00:08
HD
Stack Coins with Financial Charts Growth Numbers Business Money Market Analysis Display
00:10
HD
Hands typing on laptop with green energy icons and symbols illustrating sustainable technology and eco-friendly practices in modern workspace. Cipher
00:10
HD
Finance fund stocks price increase and decrease charts arrow up and down, ticker display. table grid Stock exchange screen number with financial trade index rates
00:20
HD
Trends in data analysis with graphs showing fluctuations over time in a dark environment.
00:10
HD
Neon Quality Increasing And Cost Decreasing Arrow Animation With Transparent Alpha Channel For Business Infographics Corporate Finance Presentation Overlay Seamless Loop 4k Motion Graphics VFX
00:12
HD
Zigzag line with a downward arrow falling trend loss decline and negative business direction animation
00:06
HD
Palau Oil Price Falling with Oil Barrels Downward Green Arrow and 3D Financial Data Visualization Graphs for Economy and Business Concept
00:11
HD
Entrepreneur receiving money, facing potential risk, and observing a rising financial graph, the concept of a low initial investment leading to business growth and financial success
00:17
HD
Sustainable business partners discuss renewable energy models and ESG investment strategies for a greener future
00:10
HD