Se ha enviado un vínculo para establecer tu contraseña a: Para acceder a tus compras en el futuro, necesitarás una contraseña.
Consigue 10 imágenes de archivo con una versión de prueba gratuita
Se han añadido nuevos filtros
Ordenar por

4,544,914 resultados para data visualization en todos

39,580 resultados en vídeo
ait Cyber Security Dashboard UI Design
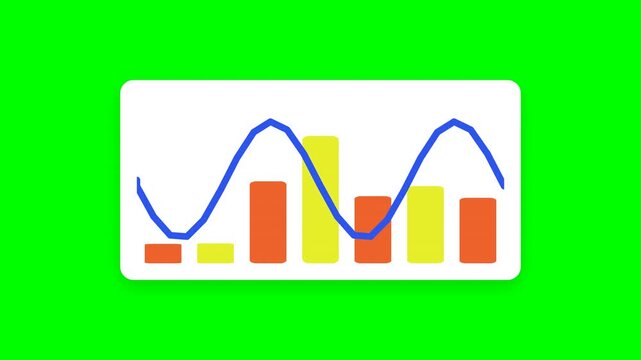
Business infographic and data visualization elements on green screen
00:08
Alta definición
Cyan neural network with data code panel. Software monitoring, system telemetry and DevOps analytics background
00:12
Alta definición
Abstract digital highway of light representing high-speed data transfer, network connectivity, and technological advancement in a futuristic urban environment
00:09
Alta definición
Dynamic digital interface background featuring vibrant neon lines and a glowing futuristic frame, ideal for technology presentations and motion graphics
00:05
Alta definición
indt Minimal Roadmap Infographic Template
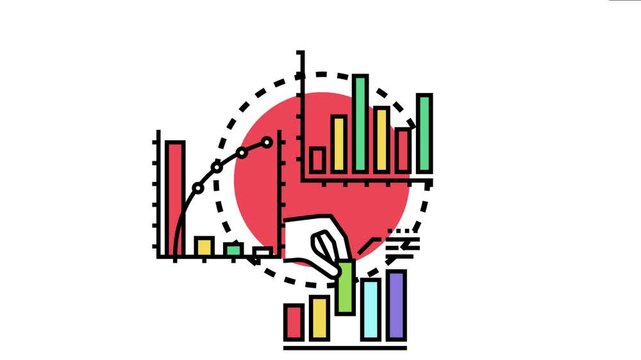
Hand placing a bar on a chart while displaying various types of graphical representations, concepts of data analysis, financial growth, and business strategy
00:17
Alta definición
Dynamic stock market data visualization with animated charts and graphs; slow camera pan across digital interface in a cinematic, ambient motion scene, ideal for finance and technology themes.
00:10
Alta definición
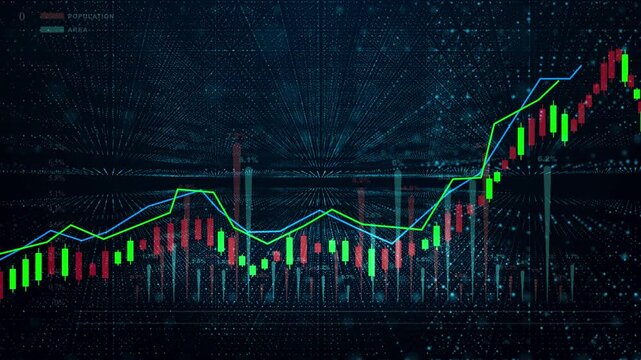
Abstract digital candlestick chart with global financial data background, perfect for trading, forex, crypto, and investment presentations. Financial Investment Background. 3d Rendering.
00:20
Alta definición
Advanced hud frame layout for digital interface mapping. Structured screen element designed for data analysis display. Futuristic interface frame built for technical visualization systems.
00:14
Alta definición
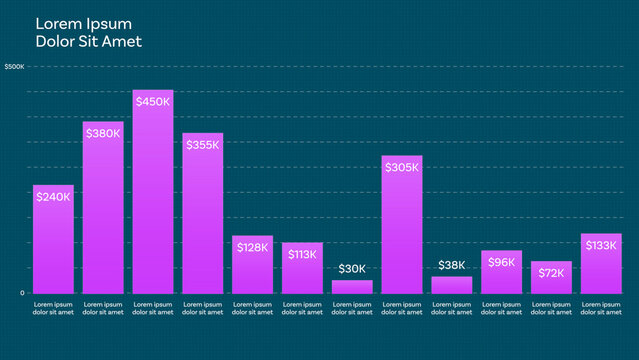
mogrt Responsive Vertical Bar Chart for Design and Data Visualization Design and Slide Presentation and with 12 Animated Data Points + Custom Text + Color with Dual Bar Graph Mode and Dynamic Auto-width Bar
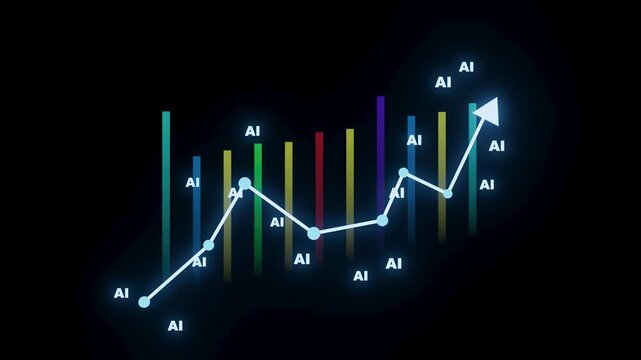
A line chart displays data trends with bars of different colors. Each bar is labeled with AI. The chart shows an upward movement over time.
00:10
Alta definición
Professional data science loop visualization with moving charts and indicators for corporate and banking presentations
00:09
Alta definición
Top Down View Corporate Office With Multiethnic Workers at Computer Stations as Linked Visualization Layer Appears, Glowing Blue AI Icons, Cybersecurity, Connectivity and Workflow Automation.
00:10
Alta definición