Se ha enviado un vínculo para establecer tu contraseña a: Para acceder a tus compras en el futuro, necesitarás una contraseña.
Consigue 10 imágenes de archivo con una versión de prueba gratuita
Se han añadido nuevos filtros
Ordenar por

4,533,552 resultados para data visualization en todos

38,206 resultados en vídeo
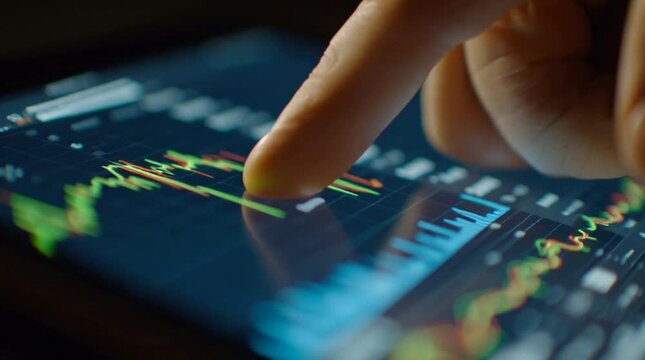
Close up of interactive tablet trading charts and data analysis with finger
00:05
Alta definición
ait Minimalist Green Global World Data Analysis Infographic Template
Data analysis with high-speed transfer connectivity, future background
00:16
Alta definición
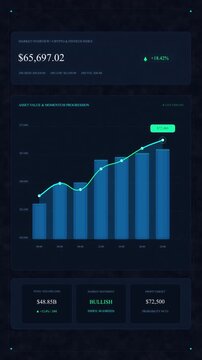
Financial dashboard analytics chart growth business motion graphic
00:06
Alta definición
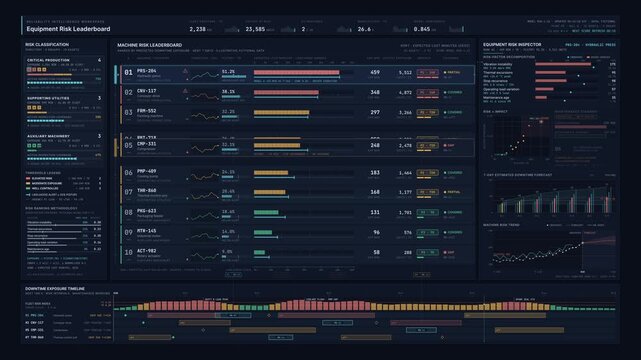
Dark mode industrial predictive maintenance dashboard ranking machines by downtime risk with animated data visualization and technical analytics interface.
00:15
Alta definición
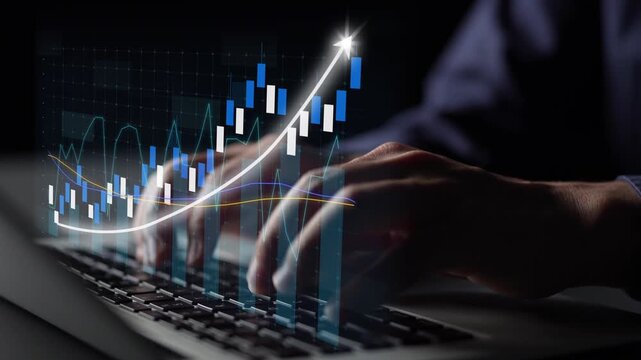
Close-up of hands typing on a keyboard with a digital graph overlay showing upward trends, symbolizing business growth and the influence of technology in data analysis. Copula
00:10
Alta definición
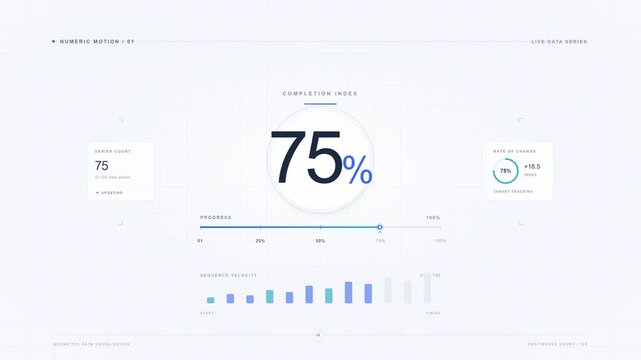
Progress bar filling from 41 percent to 75 percent to 100 percent with digital interface and data visualization on screen in a modern technology setting
00:10
Alta definición
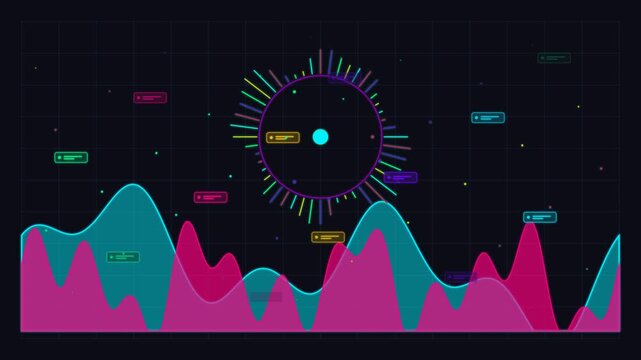
Digital data visualization with oscillating waveform frequency chart dynamic charts with neon nodes and floating interface elements on a dark background frequency graph digital analytics sound wave
00:10
Alta definición
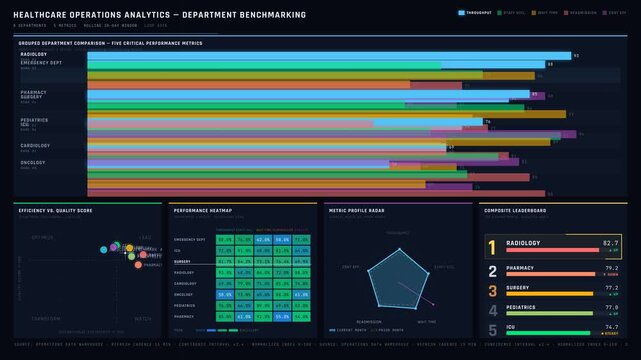
A sophisticated dark-mode healthcare operations analytics dashboard visualizes comparative performance metrics across hospital departments with clear data visualization and animations.
00:15
Alta definición
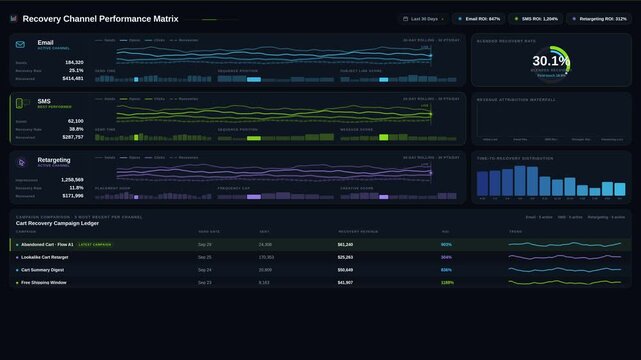
Experience a luxurious high-value cart monitoring dashboard with real-time abandonment alerts, featuring sleek design and dynamic data visualization for optimal business intelligence.
00:15
Alta definición
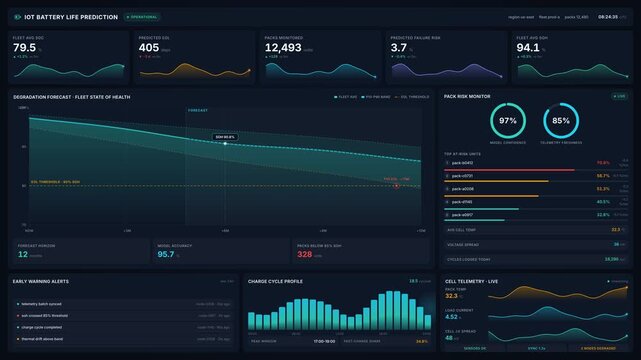
4k futuristic digital dashboard with iot battery life prediction telemetry data analysis, for modern technology, industrial monitoring, data visualization
00:20
Alta definición
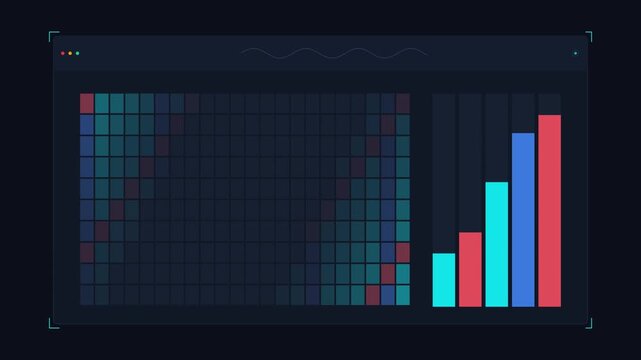
Modern data visualization chart with color coded matrix and bar graphs evolving over time
00:10
Alta definición
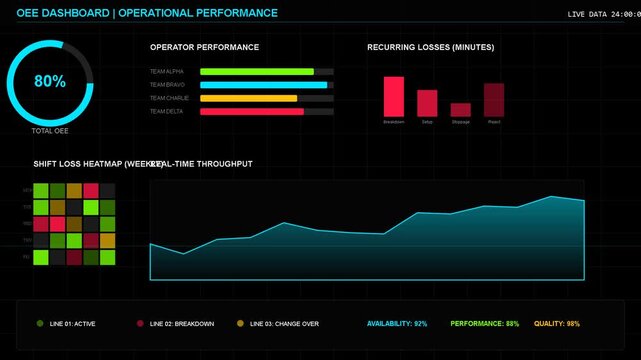
Digital analytics dashboard interface with data visualization charts, bar graphs, and performance metrics for business monitoring
00:09
Alta definición
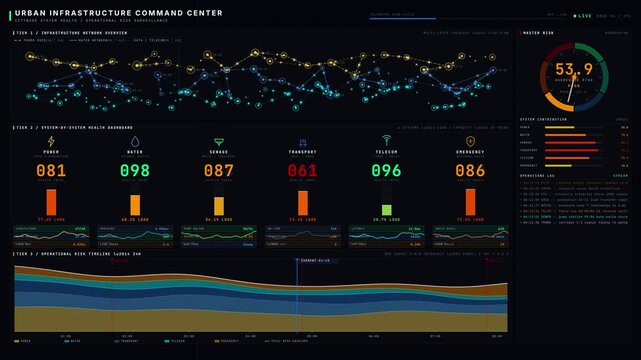
Explore an advanced urban infrastructure command center dashboard showcasing citywide system health, operational risks, and real-time data visualization in a sleek 4K animation.
00:15
Alta definición
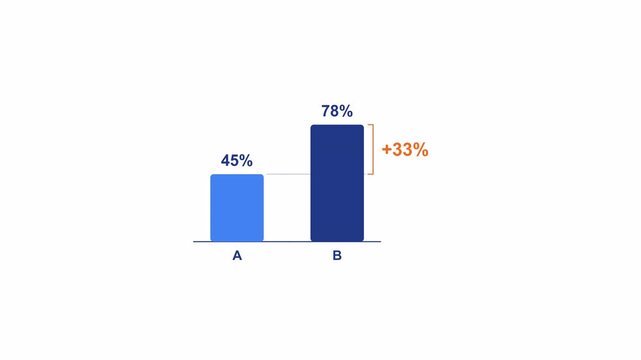
Animated A vs B comparison infographic with two columns growing side by side and the difference highlighted in orange, flat business data visualization
00:11
Alta definición
Dynamic digital data visualization with ascending bar graphs and animated motion in a futuristic dark technology environment for business presentation
00:10
Alta definición