A link to set your password has been sent to: To access your purchases in the future you will need a password.
Get 3 videos or 25 images with a free trial
New filters added
Sort by

44 258 results for chart patterns in videos

Vertical black graph paper motion video background, looping video set,  Animated grid lines moving from bottom to top in 4k background video, Purple moving grid animation on black background 4K.
00:14
HD
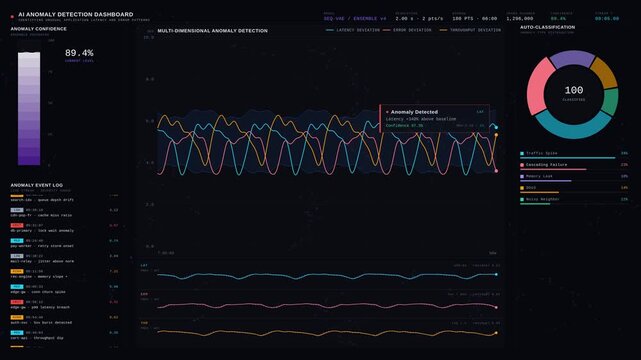
An AI anomaly detection dashboard visualizes unusual application latency and error patterns with dynamic charts and metrics in a sleek, high-tech style.
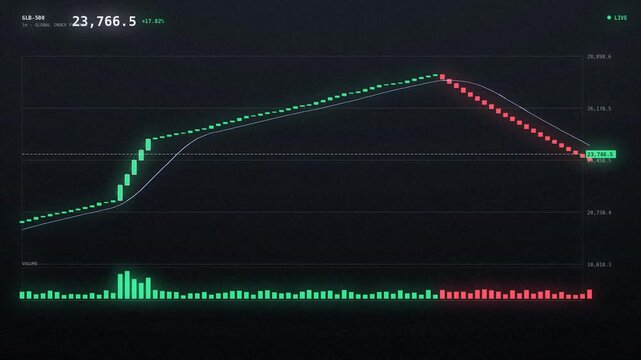
00:15
HD
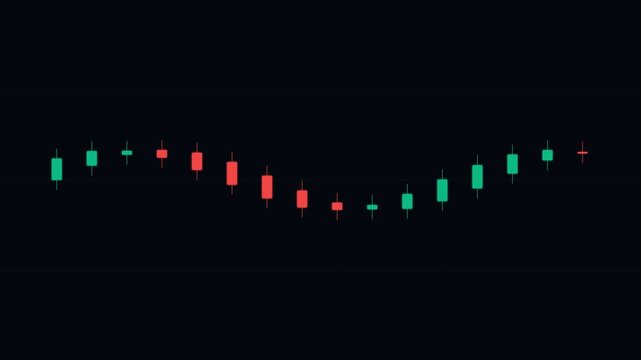
Minimalist financial candlestick chart pattern isolated on a black background
00:10
HD
Abstract background featuring multiple overlapping sine wave patterns on a dark background.
00:20
HD
Abstract financial trading chart with candlestick patterns and digital lines showing market data trends on a overlay background for business analysis
00:07
HD
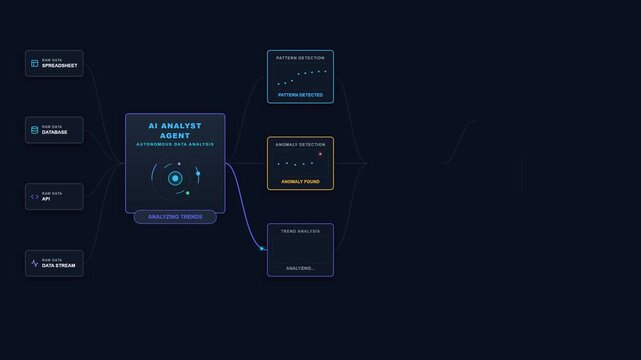
AI data analysis agent processes raw data, detects patterns and trends, generates insights, creates visualizations, and supports automated business decisions.
00:10
HD
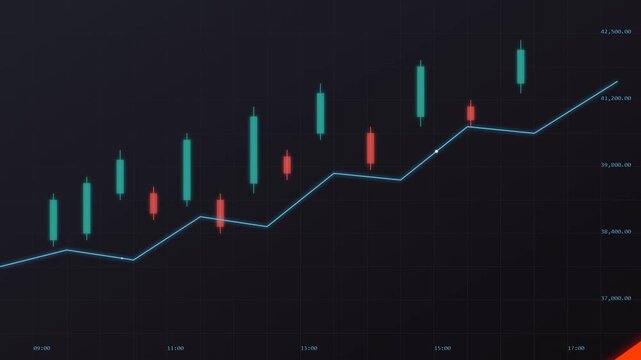
The scene shows a financial chart with rising and falling stock prices. Candlestick patterns are visible alongside a blue line tracking trends over time.
00:10
HD
Financial data growth and rising curve chart
00:10
HD
Stock market trading chart with candlestick patterns and financial data analysis background
00:05
HD
Dynamic stock market chart with candlestick patterns and real-time financial data on a digital screen ideal for illustrating investment trading and economic analysis
00:08
HD
This image represents an innovative blend of human and robotic interaction within the finance sector, showcasing market growth through a digital financial chart. Copula
00:10
HD
Stock market chart with green and red candlestick patterns showing buy and sell signals, financial data analysis, trading strategy, investment graph, digital screen display, economic growth trend
00:08
HD
Health heartbeat line showing heart rhythm and medical monitor trace animation
00:12
HD
Business Statistics, Market Data And Infographics Layout 4k animation design business market data analysis reports, with infographics, bar stats, charts and diagrams
00:18
HD
Business growth concept in allusive graph chart showing marketing sales profit increasing to target . Excellent financial status of corporate business rise up.4k animation video graph
00:10
HD
Financial stock market chart with glowing candlestick patterns and bullish trend lines, ideal for trading analysis and digital investment strategy
00:07
HD
Abstract financial chart displaying dynamic stock market data with glowing 
candlestick patterns 4k video
00:14
HD
Digital financial trading chart with candlestick patterns and trend lines on a dark blue background
00:10
HD
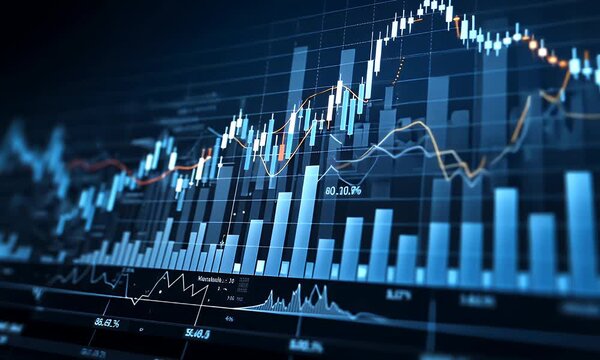
A digital financial chart featuring rising blue candlestick patterns on a dark blue gradient , overlaid with fluctuating line graphs.
00:10
HD
A digital virtual lab interface displays complex spectral light wave data analysis with glowing colorful charts and triangular prism light diffraction patterns on dark display screens
00:06
HD
digital graph paper grid chart subtle dark blue background with military, science, technology, or medical theme backdrop animated wallpaper 4K
01:00
HD
Abstract financial chart with glowing digital candlestick data points moving across dark screen representing stock market volatility investment analysis business growth and economic trends.
00:10
HD
a colorful skill matrix is displayed across three glowing panels showing a digital pyramid chart with dynamic audio bars and wave patterns in dark space
00:06
HD
Close-up of a stock market graph with red and green candlestick charts on a dark grid background with a cinematic lighting effect conveying a sense of financial analysis and trading
00:05
HD
Bitcoin price chart with candlestick patterns
00:10
HD
Abstract digital representation of financial market data with candlestick chart patterns on a dark background.
00:10
HD
Red financial candlestick market chart patterns with horizontal trend lines for technical analysis. Suitable for financial analysis presentations, stock market articles.
00:10
HD
Candlestick chart showing a bearish trend with red and green candles on a black background, representing stock market or financial data analysis
00:09
HD
Dynamic green financial chart with rising candlesticks glowing grid, and fluctuating lines climbing
00:08
HD
A chart displays data trends with blue lines and yellow bars. The background is dark. The graph illustrates fluctuations in values over time.
00:10
HD
A dynamic stock market chart visualizes financial data with candlestick patterns and glowing orange lights. ..Created with Generative AI, not depicting real subjects.
00:10
HD
Business chart graphics and bar stats appearing. Animation of financial infographics diagram showing increasing business growth and success. Digital business trend.
00:20
HD
Financial growth chart with rising green candlestick patterns for stock market analysis and trading data visualization animation 4k
00:10
HD
Visual representation of a stock market trading chart displaying candlestick patterns and trading signals on a dark purple backdrop suggesting financial analysis for investment opportunities
00:15
HD
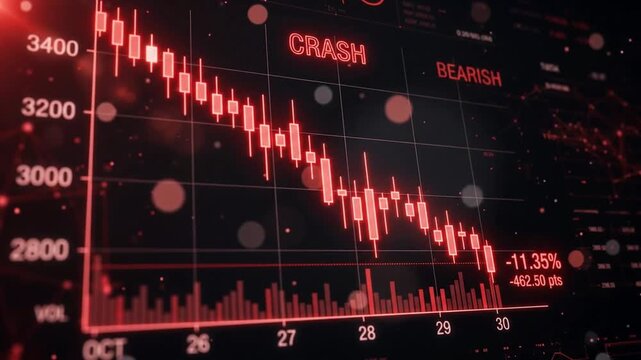
Financial stock market crash chart with red bearish candlestick patterns and digital data visualization
00:10
HD
Colorful financial candlestick chart with blue, yellow, and red bars showing market trends and data analysis dark background, colorful candlestick chart financial data stock market trading graph
00:10
HD
Financial stock market chart showing a strong bullish uptrend with green candlestick patterns on a dark digital interface
00:12
HD
Abstract financial trading chart with candlestick patterns and trend lines on a dark blue digital background
00:10
HD
Bull flag chart pattern formation showing breakout phases
00:08
HD
Dynamic algorithmic trading interface displaying fluctuating financial data patterns on a dark screen with glowing neon matrix grids and colorful digital charts for real time analysis
00:06
HD
Professional trader analyzing bearish market trend on multiple monitors displaying falling stock indices candlestick patterns and volume indicators in modern trading floor in  Photo Stock  Concept  an
00:10
HD
Spending pattern for the last 60 seconds showing a red trend line with spikes
00:11
HD
Glowing neon wave patterns animate over a digital equalizer bar background
00:15
HD
Glowing red stock chart line descending in stair step pattern showing market decline
00:12
HD
Digital stock market chart showing fluctuating green and red candlestick patterns on a dark blue background to represent financial trading trends and volatility for global investment analysis.
00:10
HD
Abstract financial trading background with purple candlestick chart patterns and neon glowing effects.
00:10
HD
Animated financial stock market trading chart with green and red candlestick patterns and moving average line on a white digital grid background
00:10
HD
Glowing bar chart with ascending red line graph during dark digital background with subtle grid pattern
00:05
HD
Engagement with digital charts unfolds as hands interact with a tablet, analyzing data visualizations and marking key insights. A thoughtful examination of trends and patterns evolves.
00:06
HD
Stock market chart shows data trends over time with bars indicating price movements in trading activity.
00:10
HD
This image illustrates a financial chart with colorful candlestick patterns layered over a keyboard, representing digital trading and investment evaluations vividly. Copula
00:10
HD
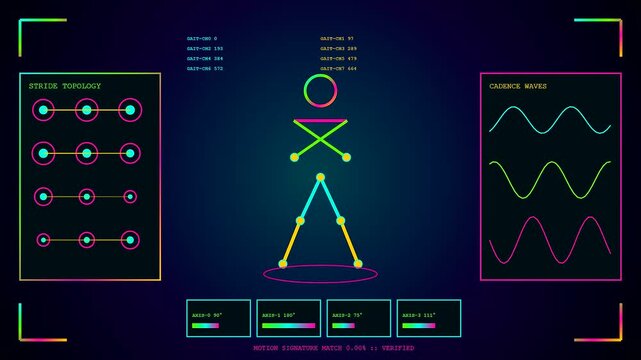
the biometric validate system monitors human skeletal motion on a digital screen featuring glowing colorful line wave charts and geometric node patterns for analysis
00:06
HD
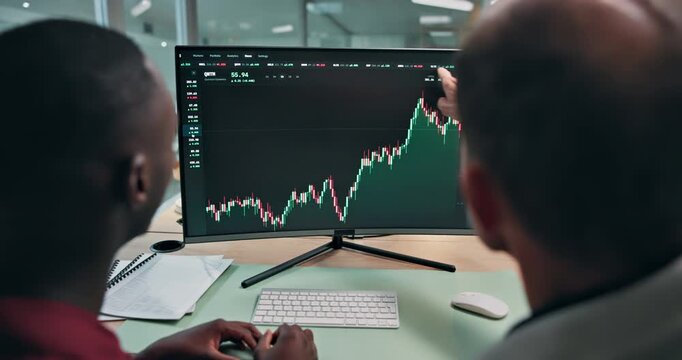
Computer screen, data or men with trading advice for economy news, chart patterns or stats in office. Trader dashboard, back of team or pointing to graphs for market timing, metrics or price movement
00:05
HD
Animated financial line chart showing market fluctuations and growth patterns in this digital blue glowing user interface motion clip video
00:10
HD
Abstract digital stock market trading chart with blue and orange lines showing upward trends and candlestick patterns on a dark background
00:10
HD
Holographic market analytics dashboard with fluctuating statistics. Digital interface showing financial growth patterns.
00:05
HD
Stock market price chart with candlestick patterns and trend lines
00:10
HD
Trading Chart Displayed on Tablet: A tablet screen displays a financial trading chart with candlestick patterns and moving averages, presented against a vibrant green background.
00:15
HD
Dynamic stock market price chart with candlestick patterns illustrating financial trends and volatility
00:10
HD
Financial stock market chart showing growth with candlestick patterns animated against glowing neon background
00:14
HD
Ocean topographic map with depth markings, dark blue background
00:30
HD
Digital candlestick financial chart displaying market trend fluctuations
00:05
HD
Digital audio console interface displaying vibrant wave patterns and frequency levels across three dynamic screen panels designed for sound processing and music production studio software environments
00:06
HD
Financial stock market chart with glowing trend lines, candlestick patterns, and data analysis elements
00:07
HD
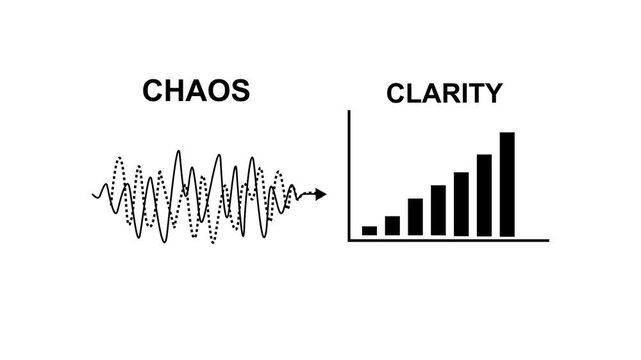
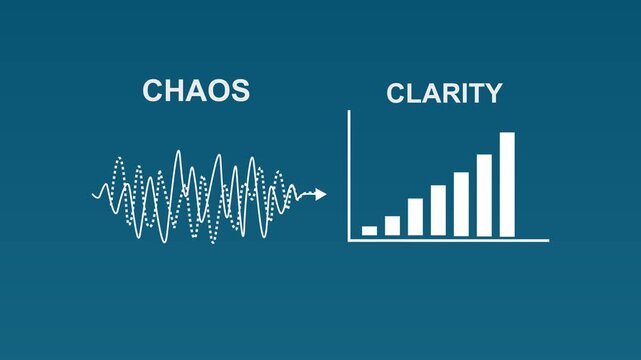
A concept transforming complex oscillating patterns into clear understandable progress illustrates how chaos can lead to clarity in business processes, business history graph animation.4k motion..
00:08
HD
Futuristic glowing interface with replay symbol, data visualizations, and circuit patterns
00:08
HD
Abstract background with rising arrows and square patterns, symbolizing growth progress success and business increase animation
00:20
HD
A concept transforming complex oscillating patterns into clear understandable progress illustrates how chaos can lead to clarity in business processes, business history graph animation
00:10
HD
An 8-second seamless loop featuring an architectural blueprint aesthetic in 3D perspective, highlighting Bullish and Bearish Engulfing reversal patterns with clear sweeping curve height dynamics.
00:08
HD
Lines and bars represent stock prices over time. Numbers indicate values while patterns show fluctuations in the market. This data is part of financial analysis.
00:10
HD
Repeating blue print millimeter paper pattern with fine grid lines, technical architecture backdrop, engineering chart surface, planning texture, drafting animation for creative projects
00:10
HD
Minimalist green candlestick chart pattern on a solid black background
00:10
HD
Computer screen, data or team with trading advice for stocks news, chart patterns or office. Trader dashboard, back of people or monitoring graphs for market conditions, statistics or price movement
00:05
HD
Abstract financial trading chart with candlestick patterns and glowing trend lines, representing market analysis, stock exchange data, and digital investment growth visualization
00:10
HD
Abstract digital graph with fluctuating line and bar chart over starry night sky
00:08
HD
Dynamic line chart with rising trend in volatility metrics
00:13
HD
Financial market chart with candlesticks and line graph, Abstract financial chart with candlestick bars and line graphs market analysis growth and data trends animation
00:10
HD
Stock market chart with candlestick patterns and trend lines illustration
00:06
HD
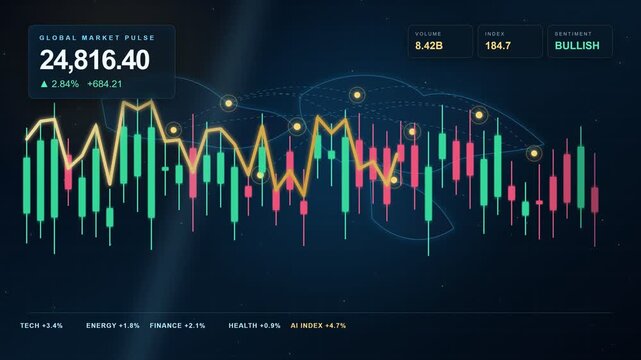
Global Financial Market Data Motion Graphic Featuring Digital Candlestick Chart Patterns Oscillating Around A Glowing Earth Globe Technology Backgroun
00:10
HD
A digital broadcast switcher interface features rotating radar sweeping patterns with glowing neon light segments and bar charts shown in a sequence of three motion shots
00:06
HD
Traders monitor the volatile fluctuations of financial markets by observing shifting candlestick patterns displayed on a digital screen to assess global economic performance during active
00:15
HD
Financial stock market chart animation showing candlestick bars moving in wave patterns on digital dark blue background motion footage
00:08
HD
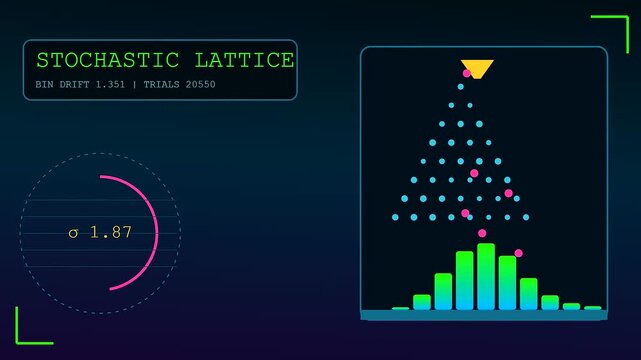
Probability modeling visualization showing a geometric grid with glowing dots falling into a statistical bar chart pattern across a dark digital interface screen in three stages
00:06
HD
financial stock market trading chart with candlestick patterns and upward trend analysis for investment data
00:07
HD
Digital stock market chart with green and red candlestick patterns on a dark financial background.
00:20
HD
Abstract finance chart showing various candlestick patterns and a smooth moving average line.
00:15
HD
A digital decibel meter display shows fluctuating sound levels across three distinct graphical user interface panels featuring vibrant neon charts and moving frequency wave light patterns
00:06
HD
Animated graph line chart economic data analysis financial trends business growth statistics
00:05
HD
Percentage 100 percent pie chart progress bar loading symbol circle.
00:10
HD
A candlestick chart used in finance to analyze market trends. The chart displays price movements in a visual format, focusing on fluctuations.
00:10
HD
Glowing financial chart with neon lines in digital style on dark background, concept of data analysis and market trends
00:10
HD
4K Ultra HD Financial trading chart with candlestick patterns and data analytics on a digital screen in a modern office environment video
00:10
HD
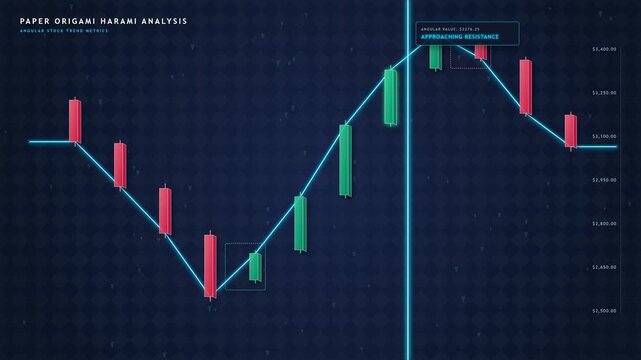
An 8-second seamless loop featuring an elegant minimalist paper origami 3D aesthetic. Highlights Bullish and Bearish Harami reversal patterns backed by a sharp, zig-zag polyline stock market curve.
00:08
HD
Growth bar chart with rising trend line and green arrow pointing up
00:15
HD
Animated trading chart with dynamic candlestick patterns. Stock exchange data visualization with price volatility. Financial market analysis in motion. 4K motion graphics.
00:15
HD
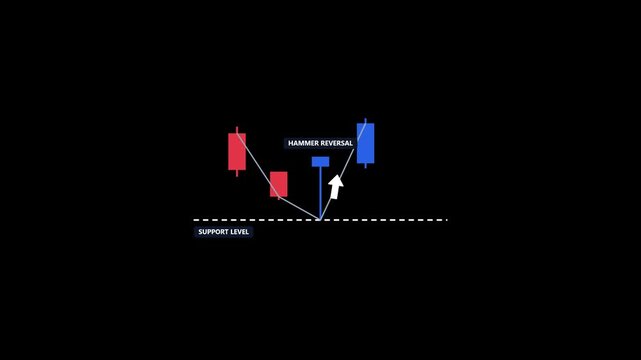
Hammer reversal candlestick pattern at support level in stock market chart
00:05
HD
Closeup of a digital tablet displaying a financial stock market trading chart with candlestick patterns and technical analysis indicators
00:12
HD
Various charts and graphs on grey background, different data visualizations floating, multiple graph types on grey surface, mixed chart patterns, abstract data graphics
00:10
HD
A concept transforming complex oscillating patterns into clear understandable progress illustrates how chaos can lead to clarity in business processes, business history graph animation
00:10
HD