암호 설정을 위한 링크가 다음으로 전송됨: 나중에 구매 기능을 이용하려면 암호가 필요합니다.
스톡 이미지 10개와 AI 편집 도구를 사용해 보세요
새 필터 추가됨
정렬 기준

전체에서 oscillogram에 관한 740개 결과

동영상 결과 327개
Glowing green heart pulse EKG line animation on a dark background representing vital signs and medical monitoring.
00:08
HD
Pulsating Golden Audio Spectrogram Bars Reflecting Dynamic Sound Frequency Levels on Black Surface 4k video
00:06
HD
Seamless looping animation oscillogram sine waves
00:10
HD
Digital displays showing power telemetry data with animated electrical grid energy flow metrics and fluctuating sensor readings captured in a sleek modern interface graphical dashboard view
00:06
HD
Layered Frequency Sound Wave Oscillograms On Dark Background
00:10
HD
Abstract sound wave graphic illustration with glowing blue and green sinusoidal lines intersecting against a clean white background
00:08
HD
Displaying sentiment analytics visuals on a dark screen featuring fluctuating waves of data and numeric metrics for observing complex digital patterns of fluctuating values
00:06
HD
Blue Digital Audio Waveform Pulse on Black Background
00:12
HD
Oscilloscope Waveform Progress Sequence Showing Sound Signal Visualization
00:15
HD
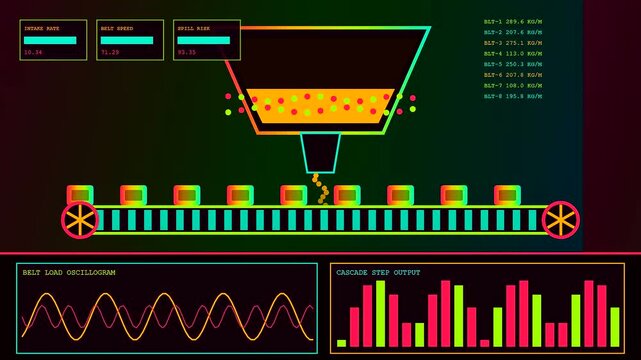
Industrial kinetic harvesting systems display numerical data streams and conveyor belt activity on a dark digital dashboard interface for automated manufacturing and monitoring flow logistics
00:06
HD
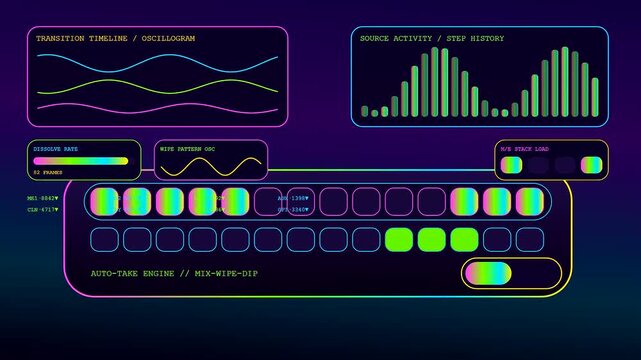
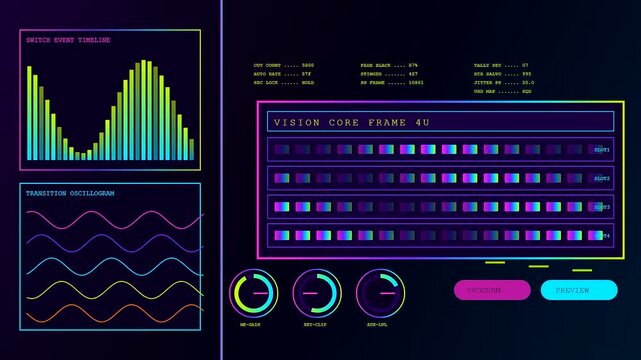
A broadcast switcher digital interface displays changing waveform patterns and active signal levels while glowing in neon blue and purple light during a production process
00:06
HD
Audio hit starting wave pulsing, glowing blobs and spikes forming for audio feedback on transparent
00:10
HD
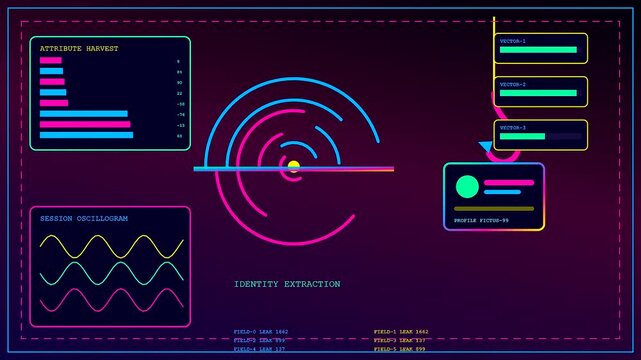
A digital phishing alert display features pulsing neon circles and rhythmic wave patterns with shifting graph bars as data metrics flow across a dark purple screen
00:06
HD
Seamless looping animation oscillogram sine waves
00:06
HD
Retro Oscilloscope Screen Displaying A Green Signal Wave And Grid Lines In A Laboratory Setting
00:05
HD
Display of modern digital oscilloscope with graphics
00:07
HD
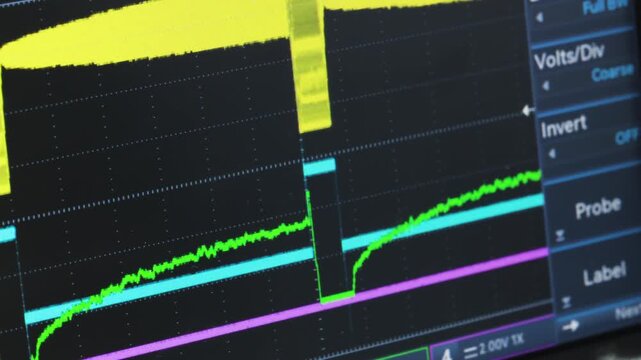
A detailed close-up zooms out from a digital oscilloscope screen, revealing the yellow waveform of an electrical signal. Concept of electronic engineering, data analysis, and diagnostic technology.
00:12
HD
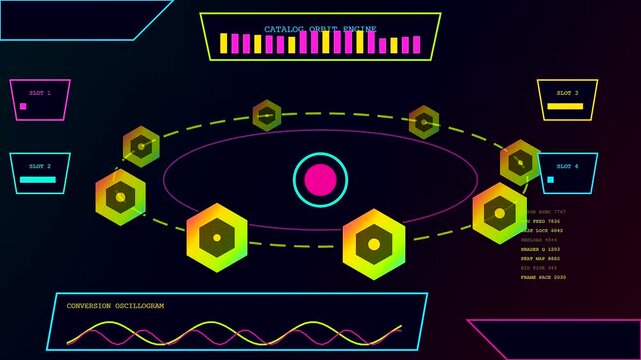
a virtual showroom interface displays animated hexagonal nodes orbiting a central magenta core featuring digital waveforms and cycling status metrics across multiple synchronized screen panel monitors
00:06
HD
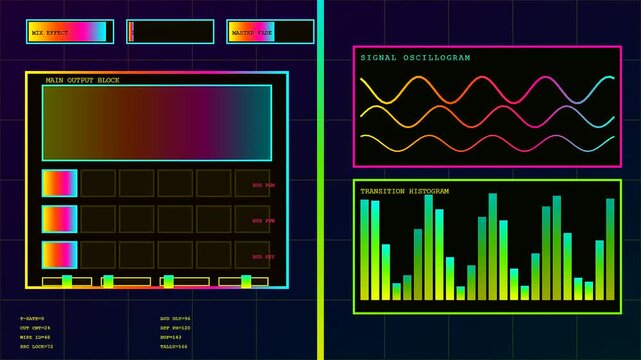
A digital broadcast switcher interface showing dynamic light bars and wave oscillation patterns on a dark screen used for live media production and monitoring tasks
00:06
HD
On data pulse dark panel rotating, waveform lines growing and overlapping to show neural analysis
00:12
HD
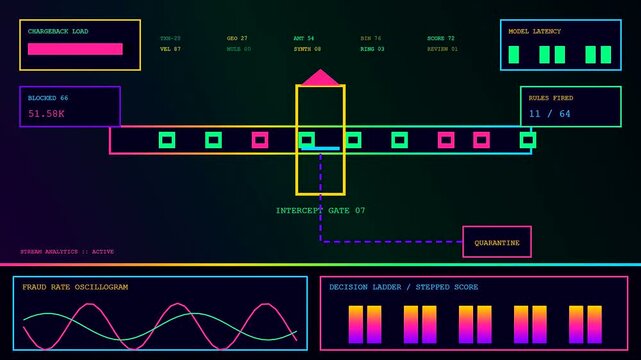
Digital ai fraud detection systems monitor data streams in this graphical interface featuring pulsing neon elements moving across a dark screen to analyze complex information patterns
00:06
HD
Abstract Neon Glowing Sound Wave Motion Graphics Loop
00:30
HD
Glowing green wave on black background
00:10
HD
Digital oscilloscope and male hand turns tumblers for setting
00:13
HD
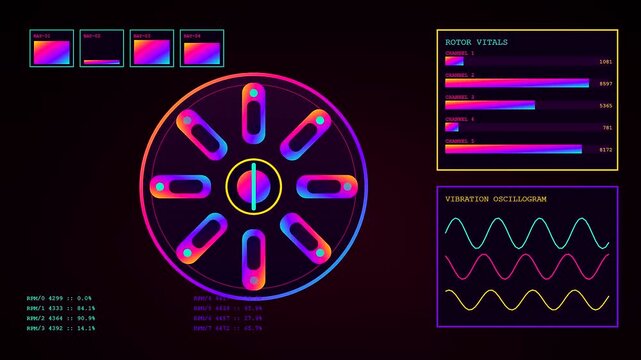
A virtual lab interface showing mechanical circular rotor status monitors with colorful graphs and waveform patterns displayed on a dark glowing electronic digital display panel grid
00:06
HD
A digital broadcast switcher interface displays vibrant waveform oscillograms and frequency spectrum graphs across six distinct panels to monitor audio levels and visual signal processing streams
00:06
HD
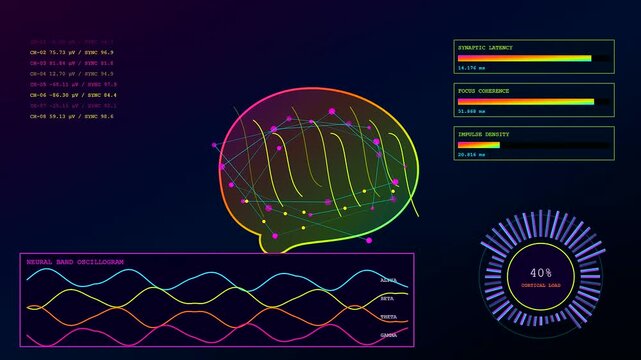
Three screens displaying biometric telemetry data points featuring digital brain icons neural wave graphs and circular meter gauges with pulsing neon light effects on a dark background
00:06
HD
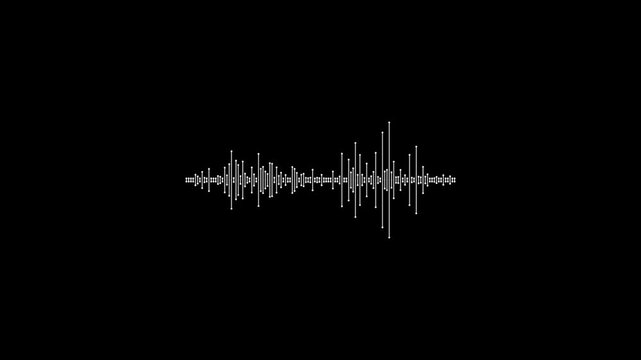
An animated white audio waveform pulses and fluctuates against a solid black background.
00:10
HD
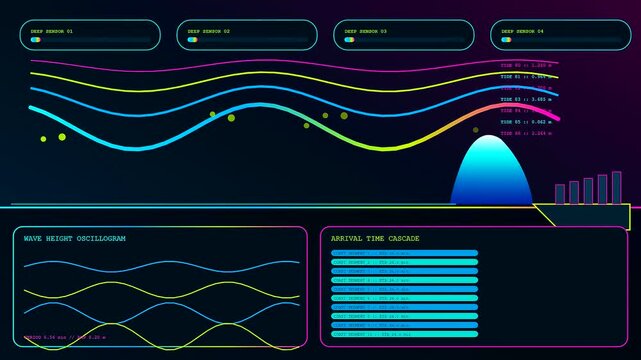
a colorful catastrophe mapping display shows dynamic wave patterns with motion graphs and sensor feedback visuals changing constantly within a simulated digital software interface for monitoring data
00:06
HD
Electrical waveforms of measured digital signal. Oscillogram of output signal. Radio measurements of high frequency currents.
00:11
HD
Digital oscilloscope and male hand pushes buttons for setting
00:07
HD
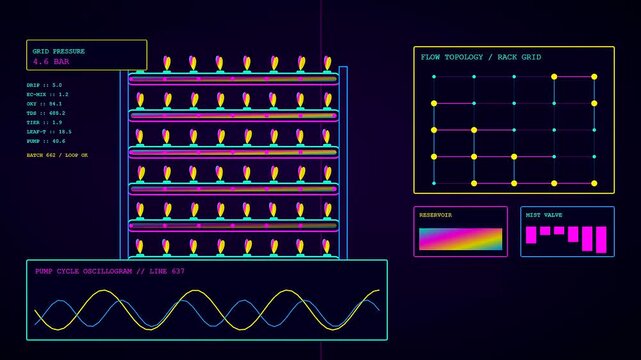
Digital displays showing vertical agritech monitoring systems with complex data nodes and flow topologies on dark screens depicting automated indoor farming cycles for future food production
00:06
HD
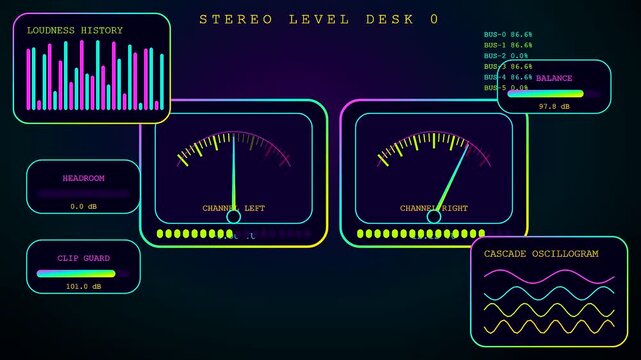
A digital decibel meter display shows flickering audio levels in three separate side by side panels while monitoring fluctuating frequency waves and sound signal amplitude data
00:06
HD
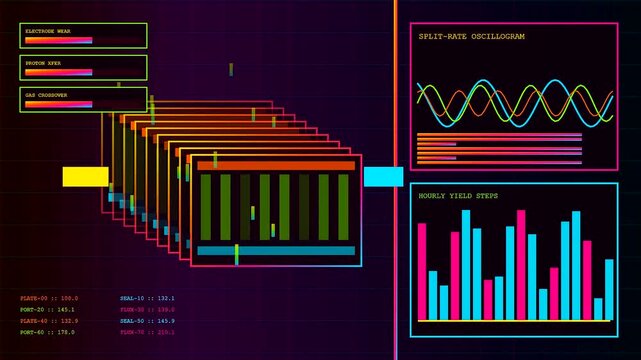
a modern hydrogen electrolysis system interface visual showing fluctuating wave patterns and bar graphs with vibrant neon data charts captured on a dark digital monitor
00:06
HD
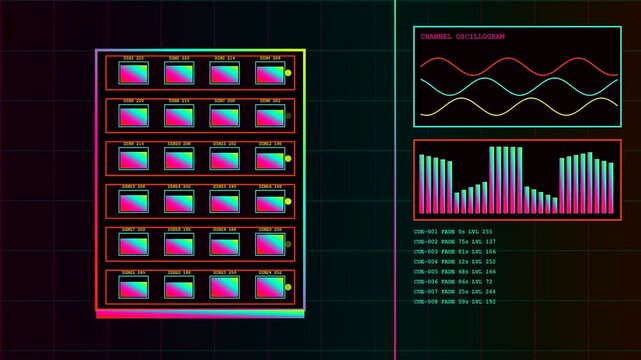
a colorful DMX controller interface displays fluctuating waveforms and digital level bars within a grid based computer terminal environment showcasing active lighting channel control adjustments
00:06
HD
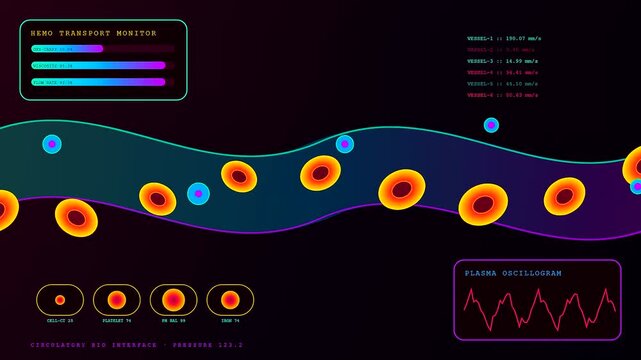
the digital bio interface shows flowing red blood cells moving through a vein while glowing data monitors track oxygen levels and velocity for medical research
00:06
HD
Audio signal on oscilloscope screen. Communication and electronics. Close up
00:25
HD
Digital oscillogram on the monitor. Electronic industry
00:12
HD