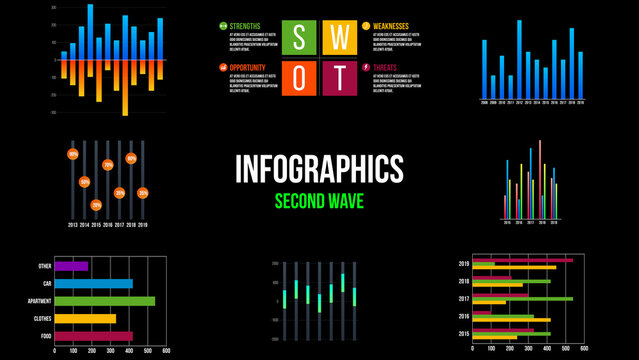
8 Infographics Elements

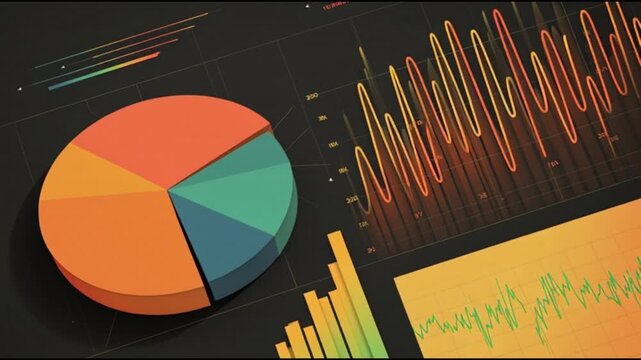
Bento Box Business Infographic Template For Dashboard Report, KPI Metrics, Data Visualization


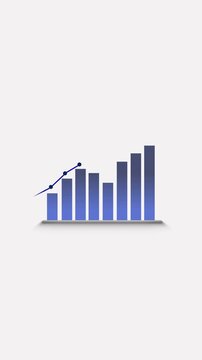
Gradient Graphic Bar Value Comparison Infographic

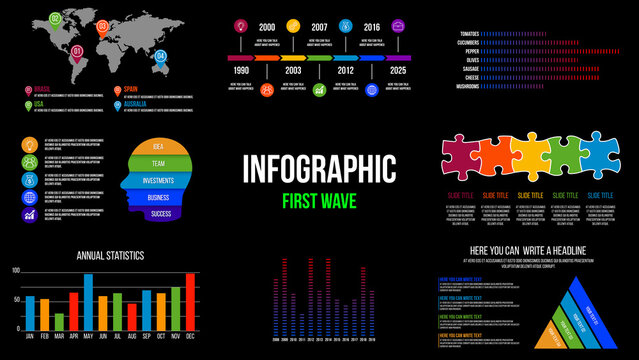
8 Infographics Elements


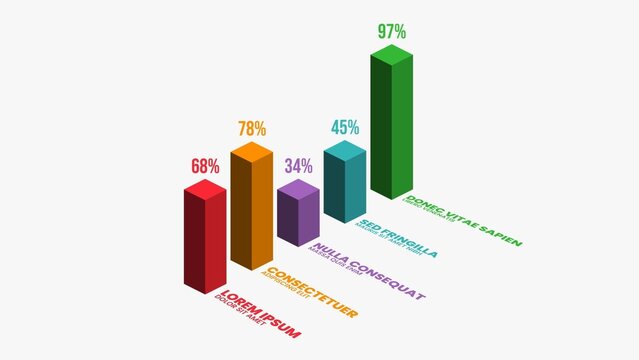
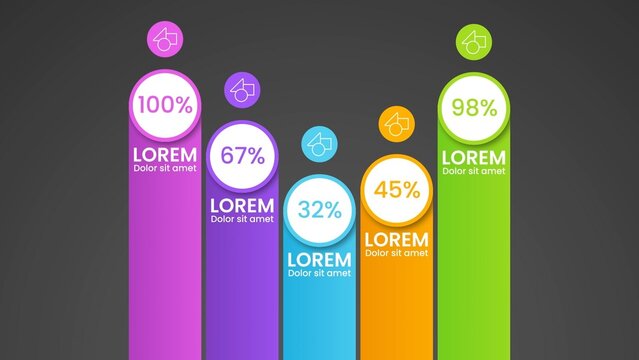
Clean Bar Graph Infographic Data Visualiser