암호 설정을 위한 링크가 다음으로 전송됨: 나중에 구매 기능을 이용하려면 암호가 필요합니다.
무제한 다운로드와 강력한 AI 편집 기능으로 제약 없이 창작해 보세요
새 필터 추가됨
정렬 기준

비디오에서 sequence chart에 관한 9,895개 결과

Guidance infographic 3 steps template animation. Information screen. Sequence options 4k video. Animated blank diagram visualization. Process layout empty design element. Motion graphics
00:12
HD
Stock market candlestick chart animation displays financial analytics. Market candlestick chart layout tracks corporate investment metrics. Chart sequence is sleek.
00:12
HD
Medical software displaying stress assessment metrics through changing digital face icons with fluctuating data graphs and bar charts on a dark blue glowing interface screen grid
00:06
HD
Digital displays showing pipeline automation sequences of robotic arms moving items between trays with glowing circular progress meters and data charts on a dark purple screen
00:06
HD
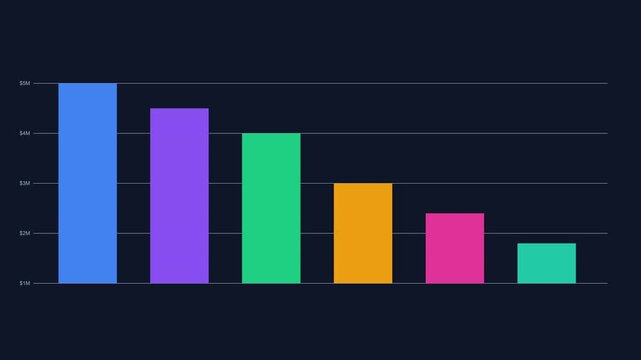
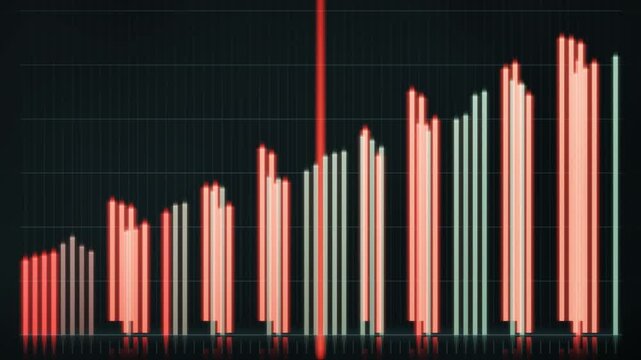
4K Animated Financial Bar Chart Growth with Colorful Columns on Dark Background
00:05
HD
Cinematic reveal of the prophecy title text on dark background
00:06
HD
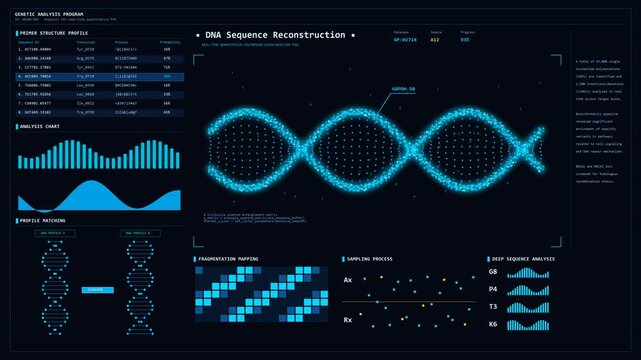
Bioinformatics HUD screen with 3D DNA sequence and PCR charts
00:24
HD
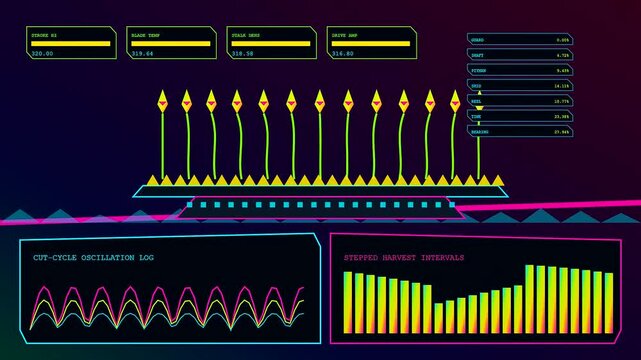
A sequence showing kinetic harvesting data visualization with glowing green plant icons and neon charts on a dark interface panel during a continuous digital monitoring session
00:06
HD
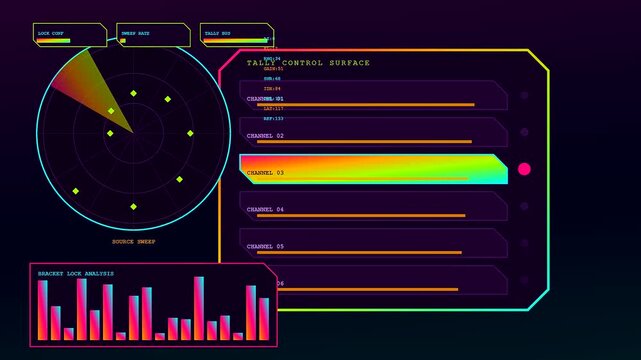
A digital broadcast switcher interface features rotating radar sweeping patterns with glowing neon light segments and bar charts shown in a sequence of three motion shots
00:06
HD
A sequence of frames showcasing a growing bar chart and upward-pointing arrow.
00:05
HD
Biotechnology DNA sequencing animation of rotating colorful double helix with glowing molecular bonds and scientific HUD data chart on dark background for genetics and bioinformatics research
00:15
HD
Process Flow Diagram with Arrows and Boxes Minimal Icon. Work flow Chart Symbol with Connected Steps. Flowchart Icon with Directional Arrows and Blocks .4K Motion Graphics.
00:10
HD
Dynamic motion of colorful bar chart visualization in digital data analysis video.
00:10
HD
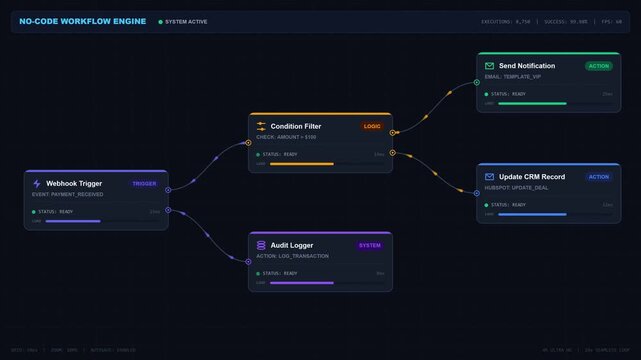
Automated workflow engine interface with digital logic flow and visual node programming builder
00:20
HD
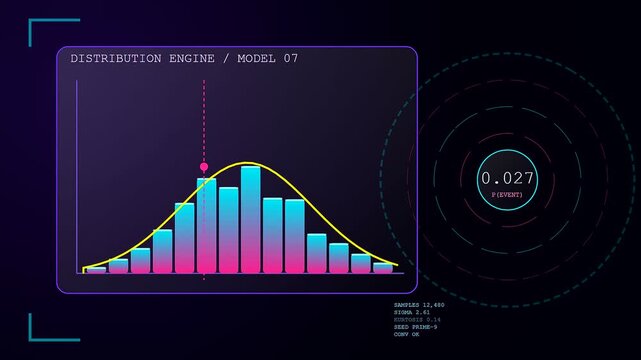
A sequence showing probability modeling metrics changing in three distinct analytical phases with glowing neon curves and bar charts inside a dark digital display system interface
00:06
HD
Animated five step timeline infographic with light blue circles and teal line on white background for business project presentation
00:10
HD
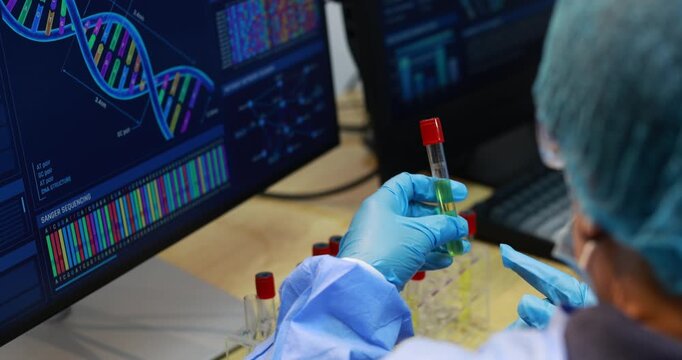
Scientists in a laboratory examine a sample vial while viewing dna sequence data and genetic charts on computer screens.
00:16
HD
Row of Wooden Blocks Decreasing in Height Like a Descending Bar Chart, Business Decline and Economic Recession Concept
00:05
HD
Minimalist Infographic Animation of Green Circular Center Element with Four Appearing Text Banners
00:10
HD
Isometric infographic template with four colorful database layers and numbered text boxes for business presentation workflow steps
00:08
HD
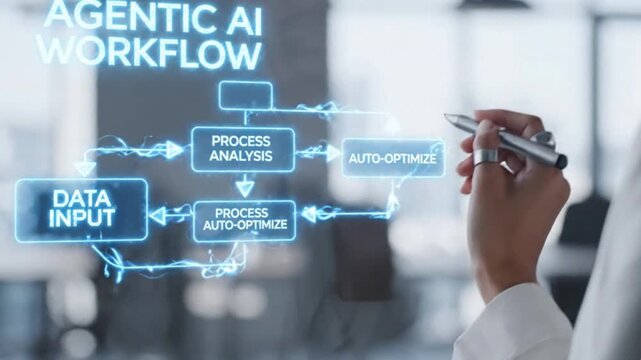
Agentic ai multi agent collaboration workflow diagram with data input process analysis and auto optimize concept for future technology modern office
00:08
HD
青と灰色の折れ線グラフが停滞と加速の違いで逆転する白背景の二系列比較アニメーション動画
00:08
HD
Digital impression data flows across a sequence of monitoring screens displaying glowing neon bar charts and metrics that illuminate the dark screen for analytic observation
00:06
HD
A biometric validate process showing digital hand scanning sequences displayed on a futuristic interface with bright neon lines and graphical charts moving across multiple screen panels
00:06
HD
Futuristic bio matrix user interface with genome sequencing charts
00:20
HD
Empathy driven social culture infographic circles animation. Community responsibility. Human centric brand principles. Flowchart dynamic presentation with 5 steps process. HD video, motion graphics
00:15
HD
A screen displaying dynamic pricing metrics with oscillating waveforms and bar charts updating in sequence to illustrate market fluctuations and complex data flow for analytical review
00:06
HD
Digital silicon security interfaces display dynamic blocks connected in a sequence within a glowing dark environment featuring changing data values and colorful linear progress charts
00:06
HD
a colorful bioinformatics interface featuring rotating circular neural network models and evolving bar charts presented as a three part sequence in a digital software display
00:06
HD
5 step infographic with colorful hexagons. 4K Video
00:10
HD
Soil sequencing displays appear on a dark interface showing rotating circular patterns with colorful glowing dots and vertical bar charts indicating progress during scientific analysis
00:06
HD
Algorithmic trading interface displaying dynamic candlestick charts with neon gradient data panels showing real time market fluctuations on a dark digital display monitor for finance analytics
00:06
HD
Dynamic motion of colorful bar chart animation illustrating data visualization trends in motion.
00:10
HD
4k Resolution Video: Futuristic HUD DNA Analysis Interface. Cyan Genome Scan Dashboard With Double Helix, Chromosome Data, Sequencing Charts And Genetic Panels Animating On Black Background
00:25
HD
DNA double helix rotating in futuristic HUD interface, genome sequence analysis screen with scanning ring, charts and data panels
00:12
HD
Animated Horizontal Timeline Infographic with Five Steps for Business Presentations
00:06
HD
Three trend lines drawing in sequence for multi series comparison
00:12
HD
Digital financial analytics display showing positive growth trajectory with fluctuating bar chart trends and data points in a modern software interface
00:08
HD
A digital sponsorship banner glows with vibrant neon metrics while changing data visualization charts populate the screen during this fluid and seamless motion graphics sequence
00:06
HD
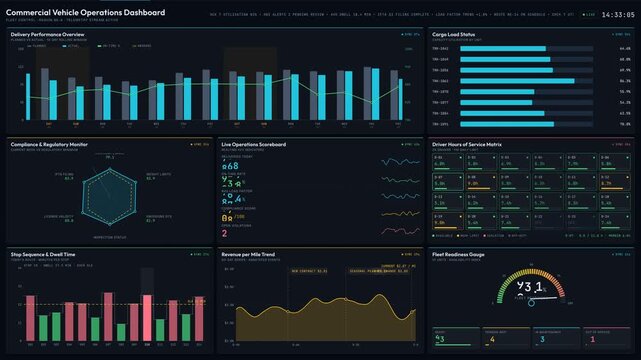
Explore a detailed commercial vehicle operations dashboard featuring a vibrant, information-rich interface with animated charts and KPIs for efficient fleet management and monitoring.
00:15
HD
Minimalist diagonal line chart with glowing blue nodes on a dark background
00:10
HD
Animated bar chart with glowing gradient columns filling upward in ascending growth sequence
00:15
HD
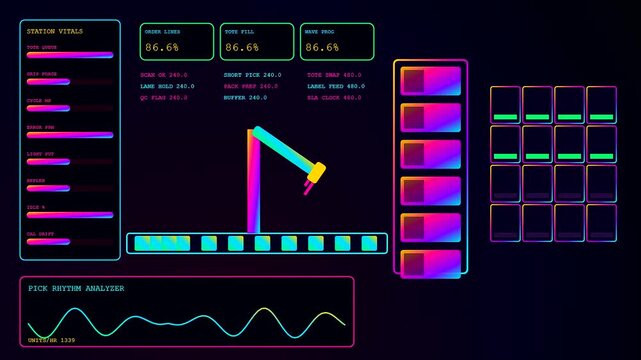
Industrial warehouse optimization monitoring software displays showing automated robotic pick and pack arm sequences with vibrant neon data charts on a dark digital interface screen system
00:06
HD
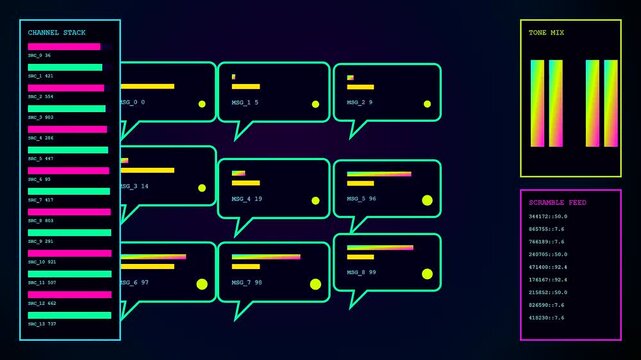
Digital displays showing sentiment analytics as dynamic graphic charts with glowing neon lines and colorful chat bubbles moving across three separate panels in a sequence
00:06
HD
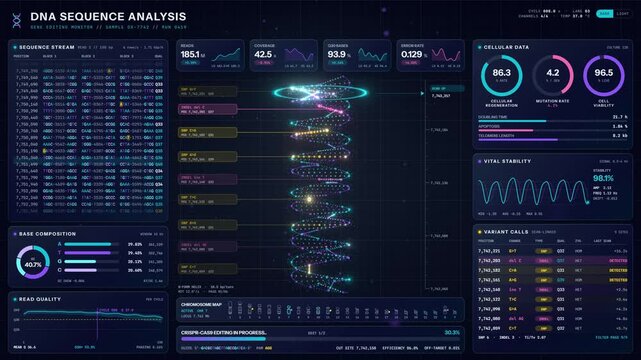
Futuristic DNA sequence analysis user interface with data charts
00:20
HD
Sorting Algorithm Bar Chart Visualization Glowing Bars Swapping Into Order Data Structure Seamless Loop in soft teal tones
00:10
HD
Digital displays showing agile backlog workflow automation sequences with animated flow charts and data monitoring panels in a dark vibrant neon blue and purple color scheme
00:06
HD
Monitoring system analytics with compute latency metrics presented in a dynamic glowing spiral interface with scrolling horizontal bar charts during a digital data processing sequence
00:06
HD
A digital bioinformatics interface displays active fluctuating signal parameters across triple side by side monitor screens featuring glowing neon line charts and numerical data entry sequences
00:06
HD
Animated Stock Candlestick Chart with Downward Trend
00:06
HD
A digital broadcast switcher interface displays complex data streams across multiple monitor panels featuring glowing neon charts pulse graphs and intricate flow maps in dark space
00:06
HD
A digital phishing alert display features multiple interactive monitoring dashboards with neon charts and stylized fish icons blinking in a sequence of simulated cyber attack activity
00:06
HD
Dynamic motion of growing digital bar chart representing data increase in a futuristic style.
00:10
HD
Animated Stock Market Candlestick Chart Sequence
00:15
HD
Wfall Chart Sequence Rising Numbers
00:05
HD
Animated infographic template featuring 3D cubes falling onto a surface. Layout for a corporate marketing presentation
00:10
HD
Animated 4 step infographic process timeline design. 4K Video
00:10
HD
Animated e-commerce dashboard showing shifting return rate percentages and customer lifetime value metrics in a professional digital interface for business analytics and marketing data performance
00:10
HD
A digital workflow map displaying complex administrative task progression in multiple sections with illuminated rectangular frames and neon glowing accents against a deep dark purple environment
00:06
HD
Animated sequence of bar chart frames showcasing data evolution and growth metrics.

00:15
HD
The glowing chart loops continuously in a seamless pattern against a dark background.
00:30
HD
Horizontal timeline infographic with five animated steps milestone roadmap presentation template
00:10
HD
Digital displays showing a stress assessment interface with human silhouette charts and data points updating in rhythmic sequence on a dark blue glowing computer screen
00:06
HD
a wage stream visualization displayed within three panel sequence shows glowing neon charts and metrics shifting across dark digital interface while processing financial data statistics
00:06
HD
Vertical sequence of green arrows pointing upwards on a black background representing growth progress success and upward movement in data charts
00:10
HD
High-tech industrial dashboard interface displaying automated production metrics, chemical tank levels, and system analytics for smart factory monitoring
00:10
HD
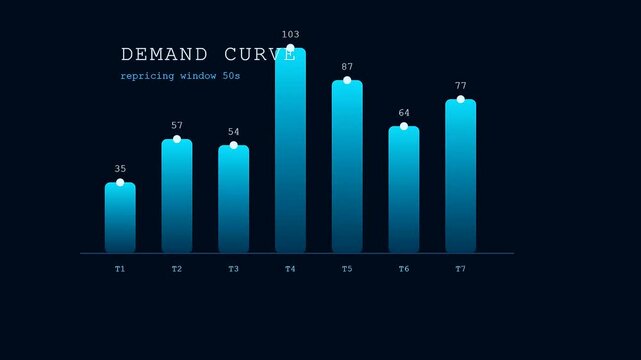
A sequence showing dynamic pricing analytics presented through multiple blue bar charts displaying shifting data trends set against a dark screen for financial market insights
00:06
HD
A digital data pipeline animation showing active information flow between two nodes with rhythmic bar charts pulsing along the dark screen in a smooth looping sequence
00:06
HD
A digital dmx controller display interface showing shifting waveform patterns plus oscillating sound bar charts in a continuous looping motion sequence across a darkened computer monitor
00:06
HD
Sorting Algorithm Bar Chart Visualization Glowing Bars Swapping Into Order Data Structure Seamless Loop in bright blue tones
00:10
HD
A digital display featuring crisp genome editing software shows neon glowing gene sequences and colorful data charts to visualize complex molecular biology research through screen interfaces
00:06
HD
Digital bar graph chart animation displaying fluctuating blue and white vertical metrics representing statistical data growth in motion loop video footage
00:09
HD
Animated startup launch infographic. Minimum viable product. Looped HD text chart template video on white with alpha channel transparency. Interactive animation with copy space and 4 step sequence
00:22
HD
Rotating digital DNA strand on futuristic display with infographics, charts and graphs. Analysis of DNA amino acids, molecules, neuronal activity and genes for medical research and science.
00:15
HD
Communication network concept. IoT (Internet of Things). Data analytics.
00:20
HD
On update candlestick chart elongating green bars and shrinking red bars visualizing market trend
00:12
HD
Business partners discussing financial charts during a meeting, captured in a slow-motion sequence emphasizing their collaboration and analysis
00:08
HD
Loopable: Genetic mapping DNA sequence analysis 3D abstract background with randomly changing DNA components and blue rays. Big genomic data analysis concept.
00:20
HD
Penetration testing progress visualized via digital interface as bright geometric blocks crumble within a dark simulated environment displaying data charts and radar circular graphs cycling sequence
00:06
HD
Analysis software activated by touch command on screen. DNA sequencing, laboratory analysis
00:13
HD
Neon Light 10 Seconds Countdown on black background.
00:11
HD
Five step process infographic with animated connecting lines and options presentation template
00:05
HD
Bioinformatic modeling displays dynamic digital patterns in a dark environment with shifting sequence alignment grids and vibrant bar charts showing real time data analysis trends
00:06
HD
Digital modular assembly shown in a graphical progression sequence featuring illuminated geometric shapes and rising bar charts across a dark blue screen interface for data visualization
00:06
HD
DNA code analysis visualization data, genome sequence ui screen, futuristic genetic engineering lab infographic interface, 3D biotechnology scan report dashboard, medical science technology backgound
00:20
HD
Abstract science analytic beautiful motion big data chart flow background perfect for text title information intro 4k uhd
00:16
HD
Digital displays showing hydrogen electrolysis data in a dynamic monitoring system with fluctuating charts and glowing interface panels presented as a continuous streaming information sequence
00:06
HD
An interactive poll visual sequence showing shifting hexagonal data nodes displayed on a dark glowing interface screen with rotating scan radar circles and colorful bar charts
00:06
HD
Digital ai accountability frameworks displayed through animated purple holographic shields and circular radar interfaces on a dark screen representing modern software monitoring and data systems
00:06
HD
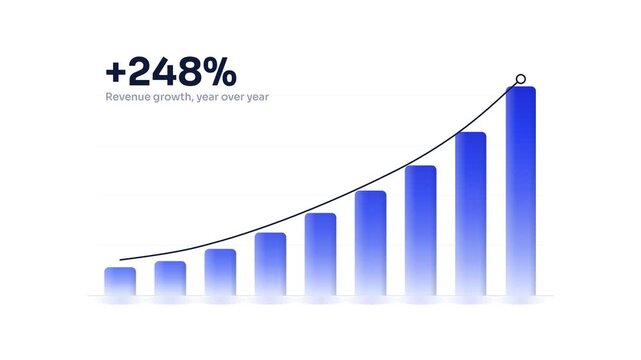
Animated bar chart sequence showing revenue growth rising from zero to 248 percent with blue gradient bars and upward trend line
00:10
HD
top ten countdown, neon light numbers from 10 to 1, laser ray appears on black background and fly forward,
00:27
HD
Man as gladiator raising sword in ancient roman arena with cheering crowd. Warrior in plumed helmet and armor preparing strike. Historical battle reenactment documentary footage.
00:08
HD
Animated MVP launch infographic. Product development. Lean startup. Looped HD info chart template video on white with alpha channel transparency. Interactive flowchart animation with 4 step sequence
00:22
HD
Professional Doctors Analyzing DNA Structure, genes and genetic disorders, science. DNA Strand molecule close up animation with infographics on futuristic transparent screen.
00:11
HD
Detailed digital interface of futuristic DNA analysis process. Human DNA sequence monitor. High quality medical HUD. Perspective view of cold blue futuristic medical glass screen with out of focus eff
00:30
HD
candlestick chart being displayed over dark grid, showing neon purple teal bars and trend lines
00:12
HD
A digital screen displaying algorithmic trading charts with shifting colorful data squares and neon glowing wave patterns representing financial market oscillations in a modern software interface
00:06
HD
Medical ECG EKG monitor with heartbeat cyan line in close-up, seamlessly loop footage. Cardiac impulse sequence on medical grid screen
00:10
HD
United Kingdom map with Administrative Units, Airports and Roads. Blue. This video is entirely loopable and also has 2 loopable sequences from frame 80 to 460 and from  frame 461 to 804.
00:29
HD
Displaying recovery analytics in a digital dashboard interface showing changing fluid levels and wave charts on a dark screen representing modern medical software user interface
00:06
HD