암호 설정을 위한 링크가 다음으로 전송됨: 나중에 구매 기능을 이용하려면 암호가 필요합니다.
무제한 다운로드와 강력한 AI 편집 기능으로 제약 없이 창작해 보세요
새 필터 추가됨
정렬 기준

비디오에서 scatter plot에 관한 4,386개 결과

Blue scatter plot with points forming clusters, data analysis visualization loop, transparent background
00:08
HD
Data Analysis: Residual Scatter Plot for Model Evaluation
00:05
HD
Digital line graph tracks upward moving corporate revenue. Interactive line graph demonstrates successful financial forecasting. Economic growth concept with corporate line graph.
00:10
HD
A scatter plot of blue data points against a dark background with a trend line
00:10
HD
Modern Digital Dashboard with Data Visualization and Interactive Controls
00:07
HD
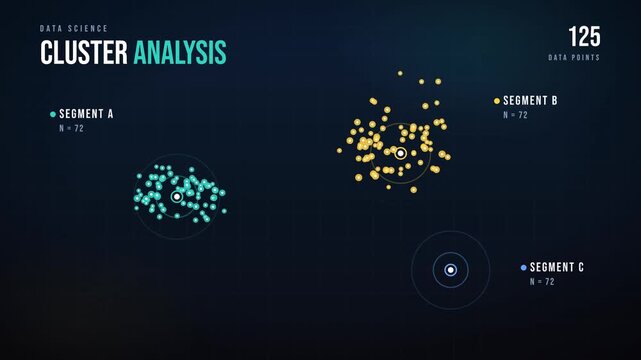
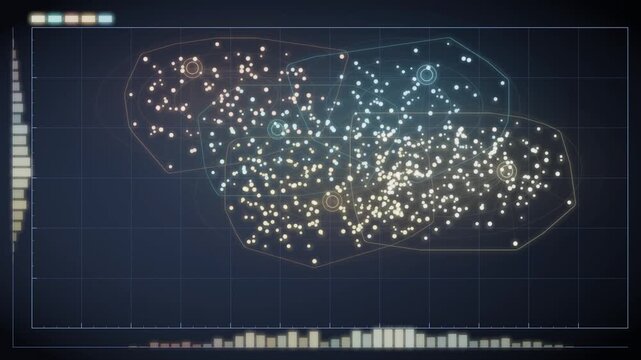
Abstract Scatter Plot Point Cloud Clustering Into Colored Groups Data Visualization Seamless Loop in vibrant indigo tones
00:10
HD
Neural Rhythms & Performance: Correlated Brain Activity Visualized
00:05
HD
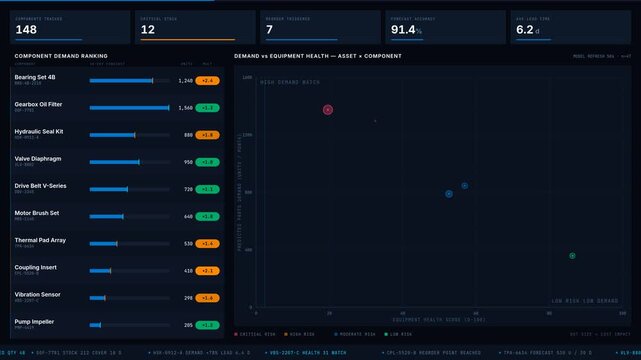
A dark-mode spare parts dashboard showcasing predicted component demand based on equipment health, featuring scatter plots and KPI metrics for effective inventory management.
00:15
HD
Data visualization scatter plot graph showing statistical analysis and research trends
00:10
HD
Colored data point clusters with centroids on beige 3D scatter plot
00:30
HD
Data regression analysis chart showing trend line fitting over scatter plot points for statistical modeling and financial forecasting
00:10
HD
Scatter plot dots clustering into colored groups data visualization infographic
00:12
HD
Data Clusters Forming in Animated Scatter Plot Visualization
00:05
HD
Scatter plot dots converging into trend line on black background
00:05
HD
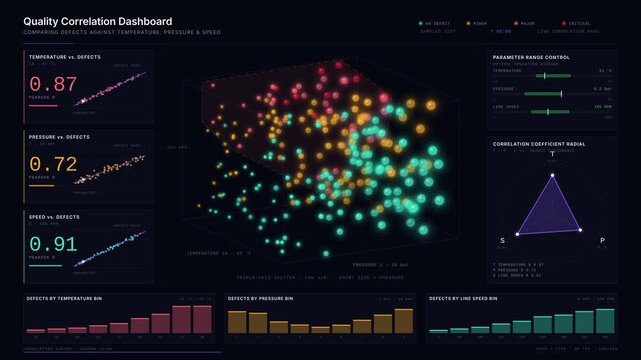
Explore a comprehensive Quality Correlation Dashboard showcasing defects against temperature, pressure, and speed with stunning 3D scatter plots and vibrant color coding.
00:15
HD
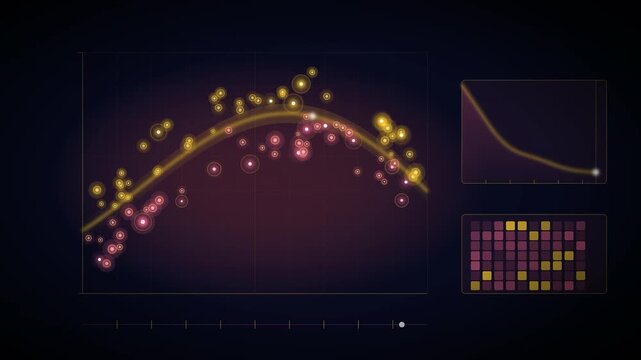
Amber scatter plot falling trend analysis animation dark
00:08
HD
Dynamic motion of a scatter plot with a trend line illustrating high correlation in animated data visualization.
00:10
HD
Abstract scatter plot data visualization with glowing neon dots on dark grid background
00:05
HD
Dynamic machine energy dashboard showcasing equipment ranked by consumption per unit with animated bar chart and scatter plot for performance analysis.
00:15
HD
Data analytics dashboard animation, area chart, donut gauge, bar graph and scatter plot building up on dark blue UI screen
00:12
HD
Black scatter plot with points forming clusters, data analysis visualization loop, transparent background
00:08
HD
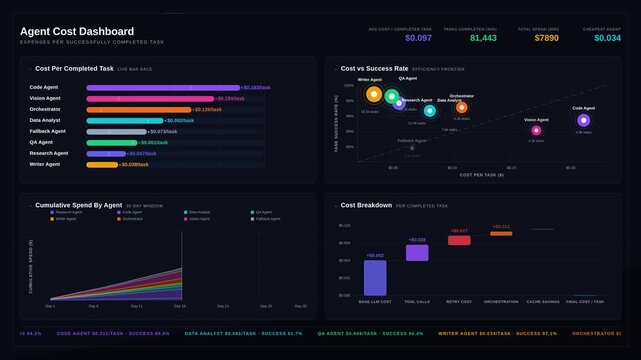
A dynamic agent cost dashboard visualizing expenses per completed task with animated bar graphs and scatter plots in a high-tech interface design. for commercial creative technology and business use.
00:15
HD
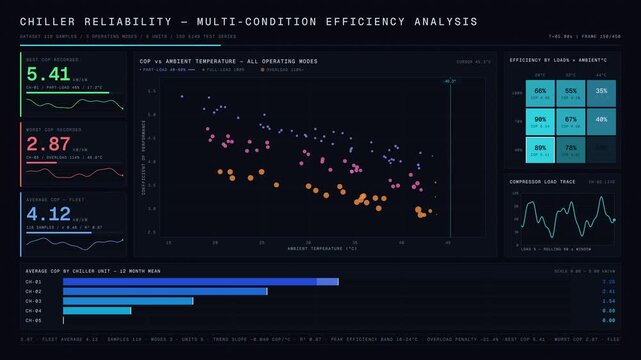
Analyze chiller reliability with an efficiency dashboard showcasing performance across operating conditions featuring interactive scatter plots and heatmaps.
00:15
HD
A minimalist scatter plot showing data points on a dark background curve
00:10
HD
Animated Scatter Plot Showing Data Points Forming a Downward Curve on a Graph.
00:12
HD
Abstract Scatter Plot Point Cloud Clustering Into Colored Groups Data Visualization Seamless Loop in rich blue tones
00:10
HD
Glowing constellation scatter plot network animation seamless loop, glassmorphism data science and neural network background
00:15
HD
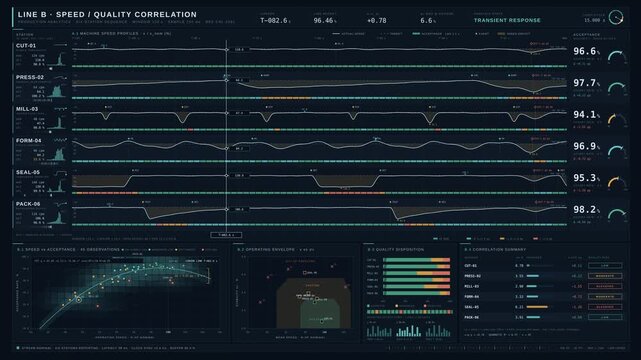
4K production line dashboard comparing machine speeds and quality acceptance rates with waveforms and scatter plots in dark blue interface for commercial creative technology and business use.
00:15
HD
Orang Scatter Plot Appear Animation Loop Background
00:10
HD
Financial Risk Scatter Plot Animation
00:06
HD
Dynamic Growth Curve Ascending Graph Animation Showing Data Progression Over Time In A Dark Blue Digital Background
00:20
HD
Minimalist abstract scatter plot graph with floating data points and labels
00:06
HD
Animated Scatter Plot with Colorful Data Points
00:08
HD
Research data analysis motion graphics, scatter plot with regression trend line and magnifying glass scanning data points, heatmap, histogram and progress rings, scientific statistics dashboard, text
00:12
HD
Anomaly detection interface displaying cluster data metrics with multiple graphical panels showing circular scatter plots and digital scan information on a dark glowing monitor screen
00:06
HD
An advanced scrap analytics dashboard visualizing process deviations linked to waste through detailed scatter plots, control charts, and correlation matrices in vibrant colors.
00:15
HD
Animated dot scatter plot forming data patterns. Digital particles visualizing big data.
00:10
HD
Futuristic AI energy optimization control center with glowing data analytics and autonomous decision dashboard in 4K. professional stock footage for technology, business, and editorial use.
00:15
HD
Scatter Plot Regression Analysis Chart Seamless Loop
00:15
HD
Correlation Strength Visualization: Animated Scatter Plot Dynamics
00:05
HD
Beige scatter plot with points forming clusters, data analysis visualization loop, transparent background
00:08
HD
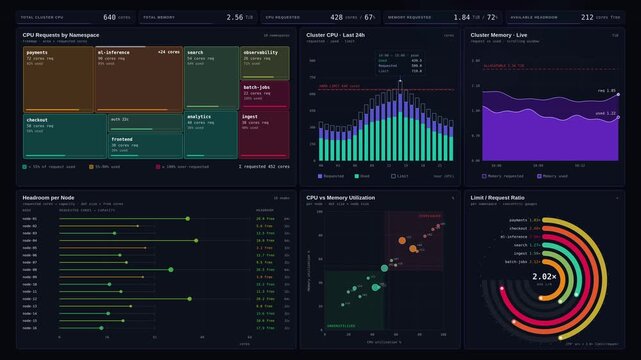
Premium 4K dark mode cluster capacity dashboard animation visualizing CPU memory requests limits and headroom with animated data charts and KPI counters on indigo background.
00:15
HD
Holographic analytics platform panel with a heatmap scatter plot and gauges over purple bokeh
00:22
HD
Minimalist scatter plot graph with white dots on a solid black background
00:10
HD
Premium 4K looping AI executive portfolio dashboard animation featuring KPI ticker, project scatter plot, budget burn rate, and roadmap timeline in dark luxury style.
00:15
HD
Abstract Scatter Plot Point Cloud Clustering Into Colored Groups Data Visualization Seamless Loop in vibrant violet tones
00:10
HD
Explore a Business Intelligence Analytical Workspace showcasing a three-panel layout with a scatter plot, collapsible tree menu, and detailed data breakdown on a clean white background.
00:15
HD
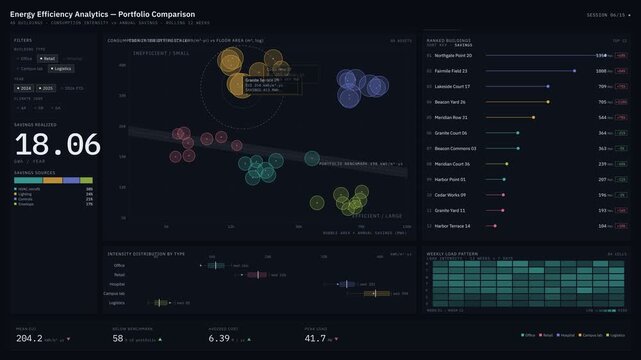
Energy efficiency analytics dashboard features a bubble scatter plot comparing building consumption intensity and savings, with interactive elements and dynamic visualizations.
00:15
HD
Green Scatter Plot Appear Animation Loop Background
00:10
HD
ESG Sustainable Finance Clean Tech Scatter Plot Growth Line Graph Loop L-Shape Copy Space
00:10
HD
Financial Risk Scatter Plot Wave Cascade Animation
00:06
HD
Animated bar chart and scatter plot data visualization for business growth analysis and financial market trends animation 4k
00:10
HD
Animated Scatter Plot Diagram With Teal Trend Line
00:08
HD
Multivariate scatter plot correlation and clustering engine analytical dashboard seamless loop animation
00:15
HD
Tiny dark grey particles drift in a curved stream as a seamless loop
00:10
HD
Dynamic Scatter Plot Matrix Showing Big Data Analytics and Statistical Trends Motion
00:20
HD
Global Data Network Analytics Dashboard with Emerald Nodes and Animated Scatter Plot Charts
00:10
HD
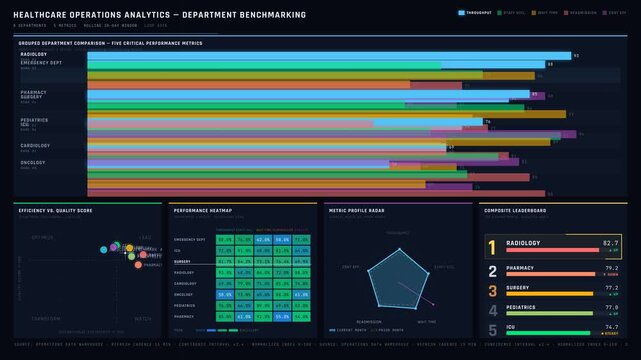
A sophisticated dark-mode healthcare operations analytics dashboard visualizes comparative performance metrics across hospital departments with clear data visualization and animations.
00:15
HD
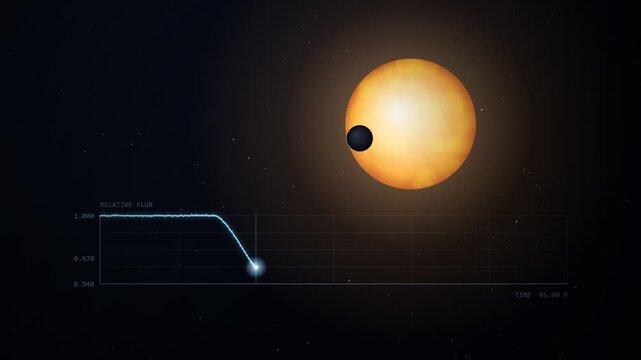
Exoplanet Transit Across Star With Light Curve Plotting Animation
00:15
HD
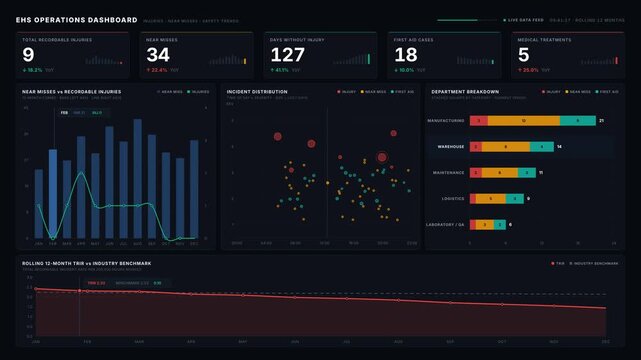
An engaging EHS operations dashboard showcasing injuries, near misses, and safety trends with animated metrics and charts in a dark mode interface for effective data visualization.
00:15
HD
White scatter plot with points forming clusters, data analysis visualization loop, transparent background
00:08
HD
A river flows between dense riverside trees with scattered rural buildings and agricultural plots on either side.
00:19
HD
Machine Learning Model Fitting A Curve To Scatter Data While Loss Chart Descends Seamless Loop
00:12
HD
A smooth blue wave line representing a trend through scattered data points
00:10
HD
Top view of engineer drink coffee and thinking about house plan at meeting table with equipment and safety helmet scatter around. Aerial view of stressful manager looking at blueprint. Alimentation.
00:17
HD
Abstract Scatter Plot Point Cloud Clustering Into Colored Groups Data Visualization Seamless Loop in subtle cobalt tones
00:10
HD
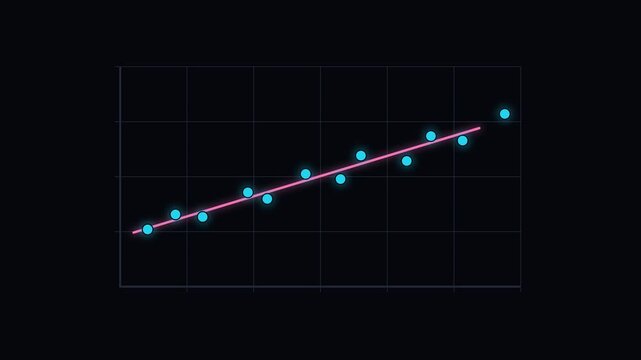
Cyan scatter plot dots with rising trend line on dark background
00:08
HD
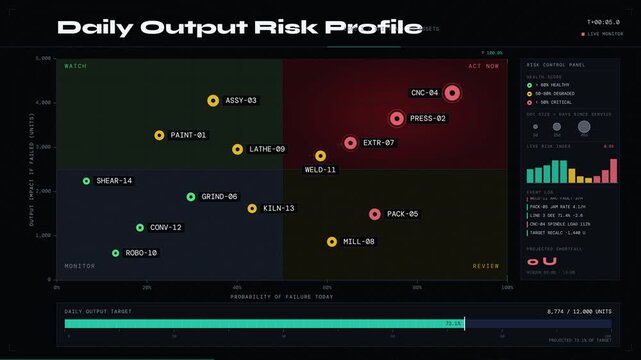
Visualize production risks with a dynamic dashboard showcasing machines threatening daily output targets through an animated scatter plot and color-coded health indicators.
00:15
HD
Blue Scatter Plot Appear Animation Loop Background
00:10
HD
Business data visualization with circular progress and scatter plots
00:10
HD
Finance Risk Data Scatter Plot with Pulsing Radial Effects
00:06
HD
Scattered data point cluster rotating within a 3D wireframe grid space
00:10
HD
Data Correlation Analysis and Multivariable Scatter Plot Clusters
00:10
HD
Abstract digital scatter plot with green data points on dark grid
00:24
HD
Correlation analysis scatter plot chart animation dark ui
00:10
HD
Scatter plot points converging to trend line animation
00:08
HD
Abstract digital scatter plot on a dark background with curved lines
00:10
HD
Abstract digital scatter plot showing linear and vertical data trends
00:10
HD
Clean animated scatter plot cloud finding in blue and cyan on a bright white background. Seamless looping 4K dashboard motion graphics with free space for text, ideal for business presentations, produ
00:07
HD
2D Scatter Plot Data Visualization with Sequential Blue and Orange Points and Emerging Linear Trendline
00:05
HD
Pink scatter plot with points forming clusters, data analysis visualization loop, transparent background
00:08
HD
A scatter plot visualization displaying data correlation on a dark background
00:10
HD
Machine Learning Model Fitting A Curve To Scatter Data While Loss Chart Descends Seamless Loop
00:12
HD
Data analytics scatter plot with trend line: financial growth and statistical analysis visualization animation 4k
00:10
HD
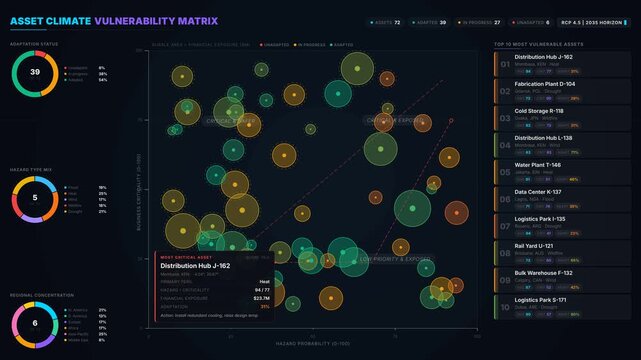
Animated 4K climate vulnerability dashboard featuring a dynamic bubble scatter plot matrix, risk frontier lines, and live data visualization panels on a dark background.
00:15
HD
Abstract Scatter Plot Point Cloud Clustering Into Colored Groups Data Visualization Seamless Loop in bright teal tones
00:10
HD
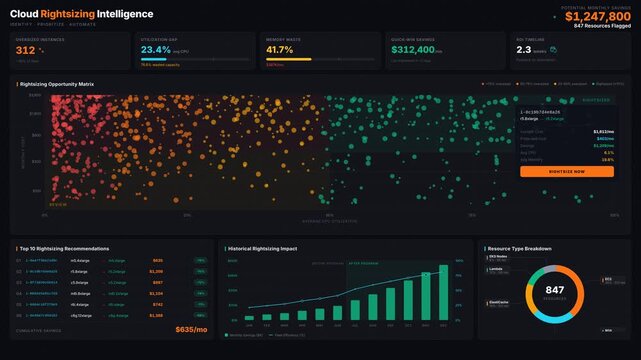
Premium 4K dark mode cloud rightsizing dashboard animation showing oversized resources, utilization gaps, and savings opportunities with dynamic charts and data.
00:15
HD
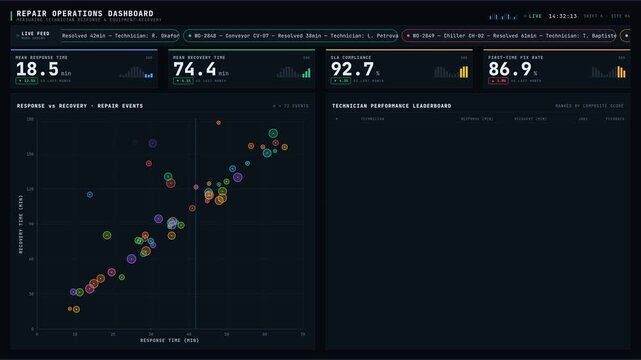
A modern dark-mode repair operations dashboard showcasing technician response metrics and equipment recovery performance with colorful KPI cards and a scatter plot layout.
00:15
HD
Cyan Scatter Plot Data Distribution Animation
00:10
HD
Animated Business Dashboard – KPI Analytics Data Visualization Motion Graphics 4K Dark UI
00:15
HD
Financial Risk Scatter Plot Progressive Reveal
00:06
HD
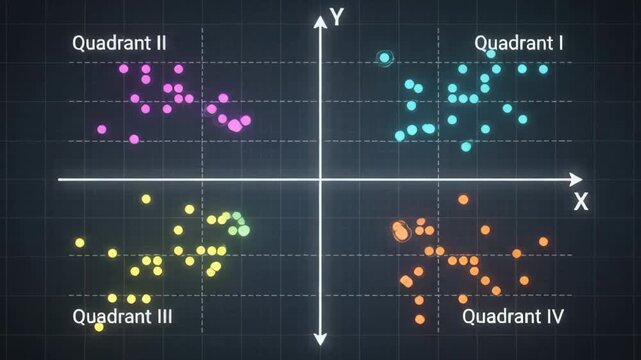
Colorful scatter plot graph illustrating mathematical Cartesian coordinate system with four distinct quadrants on a dark grid
00:09
HD
Rotating 3D Embedding Space Where a Query Finds the Nearest Points and Ranks Results, Vector Search Loop
00:08
HD
Cluttered Office Desk Covered with Colorful Sticky Notes and Organizing Chaos
00:10
HD
Investment analysis scatter plot chart animation dark ui
00:10
HD
A dynamic video showcasing a scatter plot of multicolored data points on a white background, with camera zooming out to reveal intricate patterns. Data clusters and disperses, illustrating variability
00:10
HD
Dynamic data visualization dashboard with scatter plot and heatmap
00:15
HD
A scatter plot chart displays several white dots of varying size positioned along an axis grid representing simple data distribution analysis view
00:10
HD
A video of architect use measurement tools and pencil to measure blueprint. Architect design house construction on a table at studio, with architectural plan scattered around. Focus hand. Delineation.
00:11
HD
Tilted scatter plot with green data points trending up seamless loop
00:20
HD