암호 설정을 위한 링크가 다음으로 전송됨: 나중에 구매 기능을 이용하려면 암호가 필요합니다.
무제한 다운로드와 강력한 AI 편집 기능으로 제약 없이 창작해 보세요
새 필터 추가됨
정렬 기준

비디오에서 increase and decrease에 관한 19,768개 결과

Automated hedge management optimizing investment strategies, using financial technology and analytical data for profit generation and risk reduction in complex market environments
00:17
HD
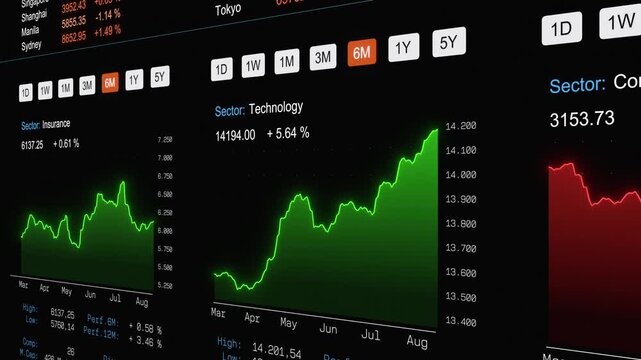
Technology stock index chart moves up, global markets data from Frankfurt, Tokyo and New York. Trading board, financial markets information, prices, market data, business and investment strategy.
00:10
HD
Weather condition level indicator scale. Low normal & high meter infographic animation on black background. Showing high weather condition level color gauge indicator for climate and atmospheric.
00:10
HD
Hygiene level indicator scale. Low normal high meter infographic animation on white background. Showing high hygiene level color gauge indicator for personal health and wellness monitoring.
00:10
HD
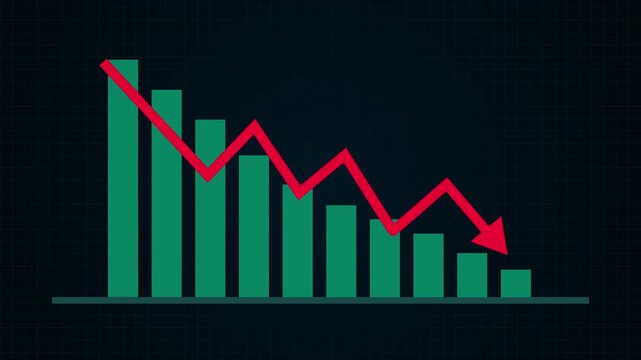
Bad Economy Recession Graph Chart Animation 2d Animation with Alpha Matte
00:16
HD
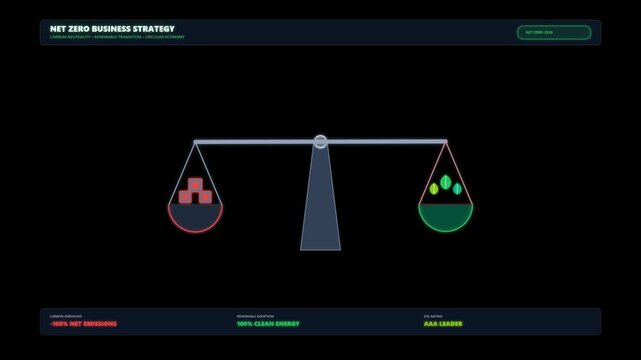
Net Zero Business Strategy Concept: Balancing Economy and Environment with Scales Animation
00:06
HD
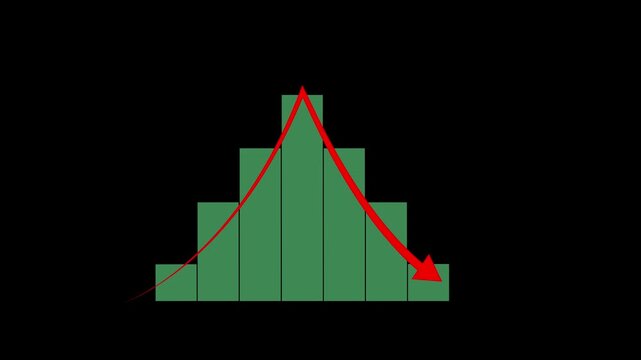
Neon purple and white jagged line graph with arrow pointing up on black background Keywords.A arrow pointing downwards with a white visual impact effect on a black background.
00:12
HD
Dental, face or kid in house with toothbrush, cavity prevention or oral care in child growth. POV, flare or girl in bathroom with tool, bacteria reduction or hygiene routine in childhood development.
00:10
HD
Simple Line Graph and Bar Chart Icon.
00:07
HD
Luminous blue neon bar chart with clear downward trend line indicating financial decline
00:10
HD
A business team engages in strategic planning and analysis using financial charts and digital overlays, capturing global market trends in a modern office setting. Raster
00:12
HD
Business growth concept in graph chart showing marketing sales profit increasing to future target . growing business concept animation on black background. 4k video
00:10
HD
Zoom in and out animation the shopping basket symbol. Large black symbol in the center and four small symbols around. Seamless looped 4k animation on white background
00:12
HD
Abstract 3D number 1944 text animation floating against a deep black void offering a vibrant and modern visual for the year with a sense of digital energy. 4k motion video.
00:10
HD
Glowing neon line graph downwards against black background animation. Stock market losses and descending trading graph and downward arrows recession
00:10
HD
Neon pink color GDP Growth Animation with Rising Arrow Graph  4k video
00:10
HD
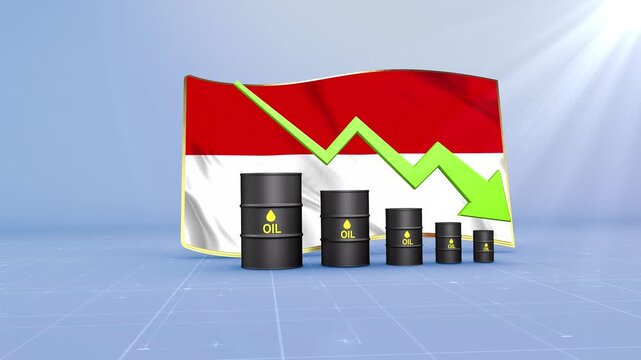
Morocco Oil Prices Decline with Oil Barrels, Gold Coins and Downward Green Arrow, 3D Economic and Financial Market Concept
00:11
HD
Search bar animation "How to save money fast". Personal finance concept
00:08
HD
trans fat level indicator scale. Low normal & high meter infographic animation. Showing high trans fat level color gauge indicator. on a black background 4k animation video
00:10
HD
Maximizing corporate savings strategies via smart interconnected database frameworks and automated systems
00:17
HD
Market oversaturation concept illustrated by surging competition. Increasing product or service availability. And a corresponding decrease in demand
00:17
HD
Circular economy concept with sustainable industry
00:07
HD
Selenium level indicator scale. Low normal & high meter infographic animation on black background. Showing high selenium level color gauge indicator for nutrition and antioxidant health monitoring.
00:10
HD
North Korea economic bar chart graph showing decreasing downturn with national Flag 3D animation on black background.
00:16
HD
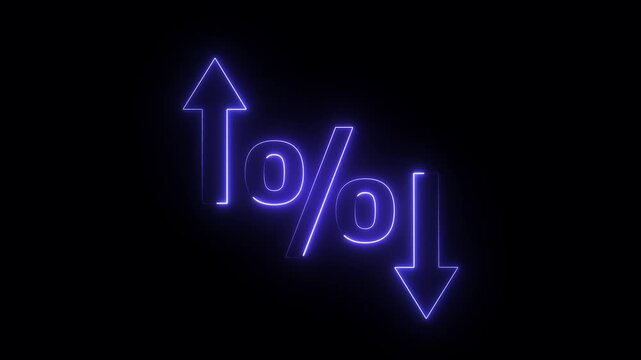
A glowing blue neon graphic featuring a percentage sign (%). It is flanked by a upward-pointing arrow on the left and a downward-pointing arrow on the right against a dark background.
00:10
HD
Glowing neon green animated line graph illustrating a downward market trend on black background. 4K Video motion graphic animation
00:10
HD
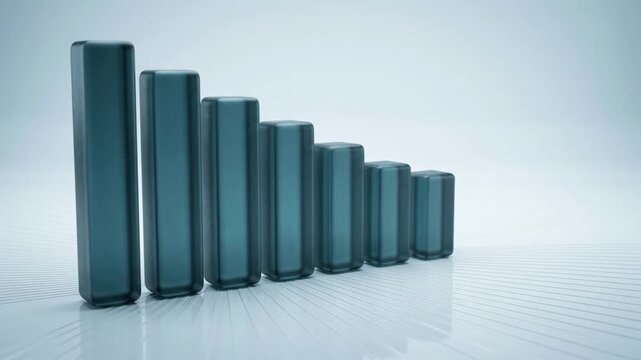
3D blue descending bar chart visualizing financial decline data metrics and economic market trends for professional business analysis presentation
00:10
HD
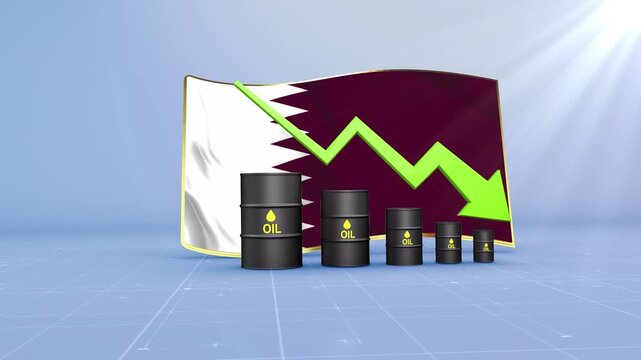
Qatar Oil Price Falling with Oil Barrels Downward Green Arrow and 3D Financial Data Visualization Graphs for Economy and Business Concept
00:11
HD
Money increases icon, dollar rate increase stretching arrow up icon .Glowing up arrow with dollar sign. Glowing neon line of dollar sign icon and up arrow isolated on transparent.Business growth
00:10
HD
Business data visualization concept with glowing blue and graphs on dark background for finance and optical light technology presentations.4k motion graphics video animation
00:10
HD
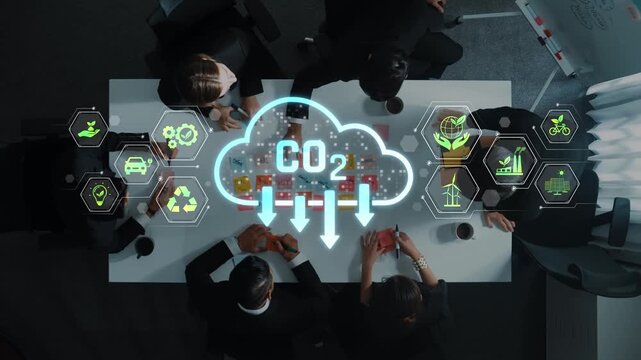
A top view of a business meeting displaying professionals engaged in discussions on sustainability, accompanied by digital infographic elements on carbon emissions. Raster
00:20
HD
Digital stock market trading data grid animation with moving financial numbers and price charts for business presentation and background loop
00:20
HD
Red arrows falling downward motion graphics for economic loss and financial failure concept loop.
00:17
HD
Abstract decrease icon on white background. Reduce cost concept with dollar and down arrow animation.
00:10
HD
Bar chart animation displays declining columns with a downward arrow on dark. Financial market loss reflects on this bar chart. Negative economic data marks chart.
00:07
HD
Forty percent discount sign represented by colorful plastic numbers on wet ground during rain
00:18
HD
Italy Oil Prices Decline with Oil Barrels, Gold Coins and Downward Green Arrow, 3D Economic and Financial Market Concept
00:11
HD
Speaker icon and volume slider animation for music, audio, sound, mute and volume control interfaces. Ideal for media players, apps and digital UI designs.
00:05
HD
Down curve arrow animation, Falling prices concept arrow animation.
00:15
HD
Modern Dashboard with Financial Charts Graphs and Data Analytics Business Growth Overview
00:10
HD
Photosynthetic algae feedstock concept visualizing sustainable alternative fuel development, renewable bioenergy production, and a circular economy for ecological responsibility
00:17
HD
Percentage Signs FLOATING Alpha Channel Discount Overlay Animated 3D percentage signs float move through space on transparent background alpha. Useful for discounts sales finance interest rates taxes
00:15
HD
Animated business bar chart showing a positive upward trend before a sudden economic crisis causes the market to crash, representing financial recession, bankruptcy, and investment failure
00:10
HD
Down business arrow decline investment and trading loss economic recession video.
00:07
HD
As focal length decreases, a yellowing lobed leaf rests among grass and fallen autumn foliage.
00:15
HD
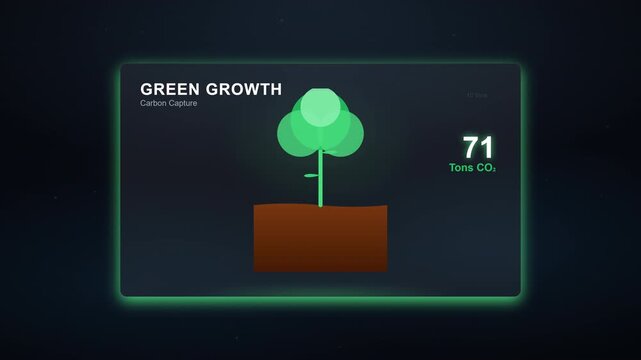
Carbon sequestration digital animation showing tree growth reducing atmospheric emission levels for an environmental sustainability project motion graphics video clip
00:12
HD
Success trend animation with green arrow moving upward step by step, with video animation.
00:10
HD
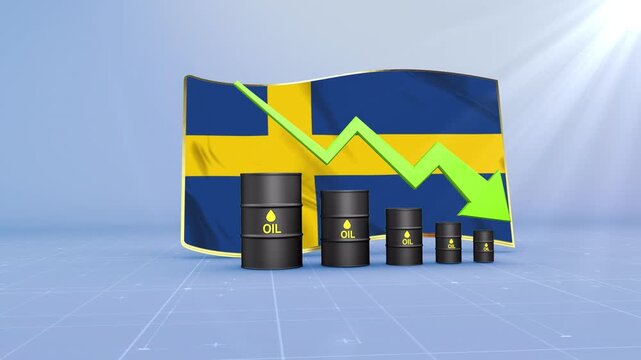
Sweden Oil Price Falling with Oil Barrels Downward Green Arrow and 3D Financial Data Visualization Graphs for Economy and Business Concept
00:11
HD
glowing neon Percentage growth and decline icon with up and down arrows. financial, business, and statistical analysis. Up and down percentage arrows icon.
00:10
HD
inflation Increased product sales growth basket market or consumer price index concept shopping cart with food increase with arrow graph on the coin inflation.4k motion graphics video animation
00:06
HD
Futuristic Robot Hand Presenting Growth Stats and Projections for Net Zero Goals from 2023 to 2050 with Graphs and Icons Representing Sustainability Sigmoid
00:10
HD
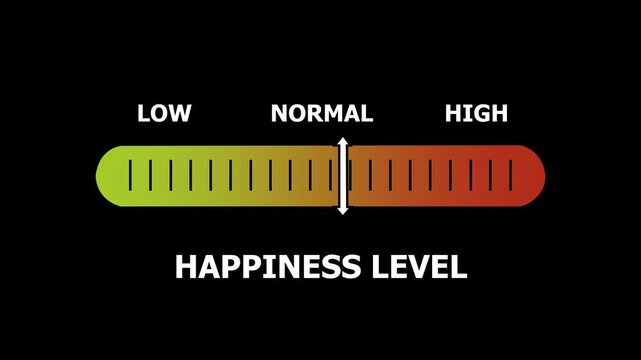
happiness level indicator scale. Low normal & high meter infographic animation. Showing high happiness level color gauge indicator. on a black background 4k animation video
00:10
HD
Animated down graph icon designed in flat icon style, business or finance concept icon graph against a black background
00:10
HD
Minimalist Animated Bar Chart Displaying Business Financial Data Growth Concept Isolated on Black
00:08
HD
profit index level indicator scale. Low normal high meter infographic animation on black background. Showing high pressure level color gauge indicator.4k animation video
00:10
HD
Cryptocurrency trading. Bitcoin stock graphic. Bitcoin mining and Finance banking management concept, oil and Money trading, Digital trade platform. Profit and loss graph. Online trading
00:16
HD
Bangladesh Oil Prices Decline with Oil Barrels, Gold Coins and Downward Green Arrow, 3D Economic and Financial Market Concept

00:11
HD
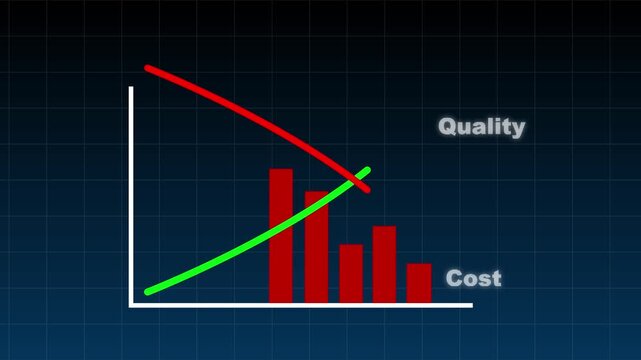
Improving Quality While Reducing Costs Concept Showing Rising Quality Performance and Declining Operational Expenses for Greater Efficiency, Productivity, Profitability and Business Competitiveness
00:10
HD
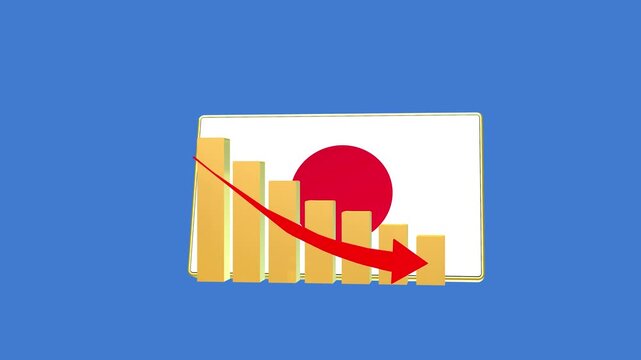
Japan economic bar chart graph showing decreasing downturn with national Flag 3D animation on black background.
00:16
HD
Glowing quality and cost control concept on transparent background. Successful organization strategy and management quality control. Percentage icon of quality with up arrow and cost with down arrow
00:10
HD
Business process showing an overhead changeover concept for cost reduction, financial management, and resource allocation, optimizing expense management and economic efficiency
00:17
HD
Animated Bar Chart Data Growth Report Growth Statistics Analysis
00:06
HD
graph chart up down business statistics
00:12
HD
Alert bubbles appearing right, floating left to laptop, grouping, drifting up, fading, showing buzz
00:12
HD
Danger level indicator scale. Low Normal High meter infographic animation on black background. Animation showing high danger level color gauge indicator for safety and risk monitoring
00:10
HD
Difficulty level indicator scale. Low normal high meter infographic animation on black background. Showing high difficulty level color gauge indicator for skill assessment and performance monitoring.
00:10
HD
Red, arrow, pointing, down, with, black, outline, motion, graphic, on, Alpha channel, isolated, directional, indicator, downward, trend, decrease, negative, growth, download, icon.
00:07
HD
Tunisia Oil Price Falling with Oil Barrels Downward Green Arrow and 3D Financial Data Visualization Graphs for Economy and Business Concept
00:11
HD
Candles of the stock market, price falls. Falling prices of securities. Loss of assets in equities stock. Decreasing trend showing unsuccessful performance and losses failure due to economic crisis
00:20
HD
Minimalist line graph illustrating Q4 profitability margin a financial data visualization on a dark background for business analysis and reports
00:08
HD
Business professionals analyzing real estate market trends with smartphone and tablet, symbolizing mortgage rates and property investment strategies Sigmoid
00:10
HD
Futuristic dollar countdown timer animation, glowing dollar symbol integrated with a circular countdown display, numbers decreasing smoothly from 0 to 70
00:10
HD
Simple Line Graph Showing Decline.
00:07
HD
 4K Ultra High Unemployed Workers Number US
00:21
HD
Neon cyan color GDP Growth Animation with Rising Arrow Graph  4k video
00:10
HD
Animated dollar coins decreasing from a stack
00:10
HD
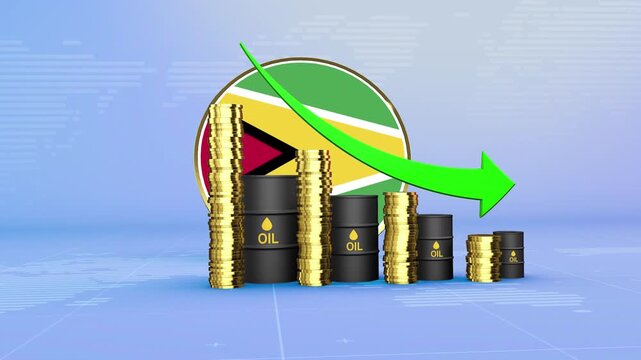
Guyana Oil Prices Decline with Oil Barrels, Gold Coins and Downward Green Arrow, 3D Economic and Financial Market Concept
00:11
HD
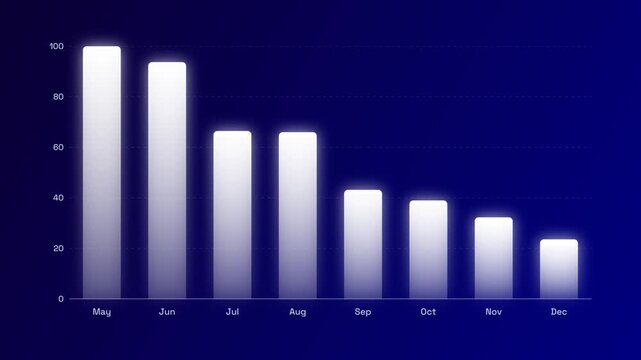
Glowing white data bar chart showing declining monthly performance metrics
00:07
HD
Green Document Icon with Downward Arrow Growing in Size with Smooth Cinematic Motion Isolated on white background
00:05
HD
Animated bar graph chart data business finance growth success statistics minimalist black white abstract motion graphics presentation template financial report infographic visualization economic.
00:08
HD
Organic food waste materials like apple cores, bread, and vegetable scraps are collected for composting, recycling them into nutrient rich soil and promoting sustainable living
00:17
HD
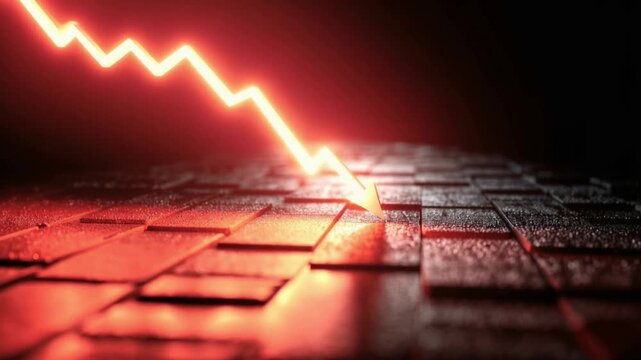
A glowing red graph line plummets downwards, symbolizing financial crisis, economic recession, or a sharp decline in market value. ..Created with Generative AI, not depicting real subjects.
00:10
HD
flyby of the camera through the red-blue rings with glowing lines on a black background. looped abstract animated screensaver background. endless tunnel. 3d render
00:10
HD
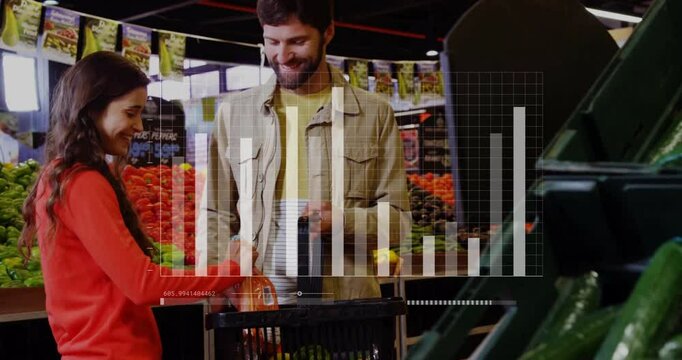
Shopping in grocery store, couple with basket over bar chart animation
00:12
HD
Business leaders discuss implement environmental sustainability strategies net zero carbon goals corporate responsibility using ESG reports data at meeting
00:14
HD
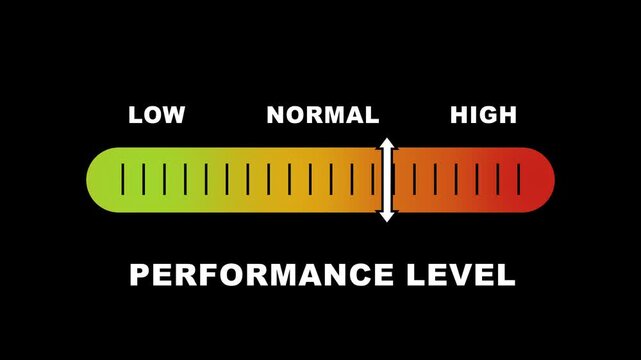
Performance level indicator scale. Low normal & high meter infographic animation on bblackbackground. Showing high performance level color gauge indicator for business productivity efficiency and work
00:10
HD
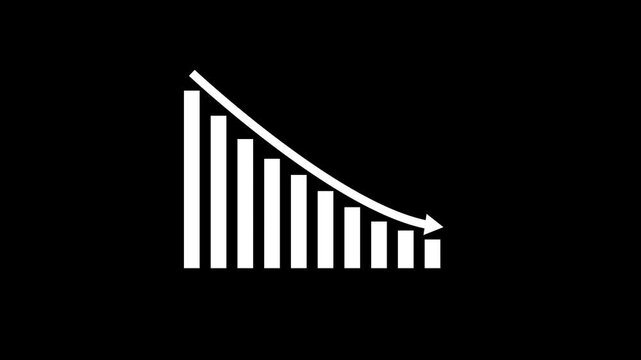
Declining business bar chart with downward arrow representing falling sales, reduced revenue, financial losses, market decline, decreasing performance.financial loss icon.
00:10
HD
Monaco Oil Price Falling with Oil Barrels Downward Green Arrow and 3D Financial Data Visualization Graphs for Economy and Business Concept
00:11
HD
Animated Financial Bar Chart Analytics Display Green Screen
00:10
HD
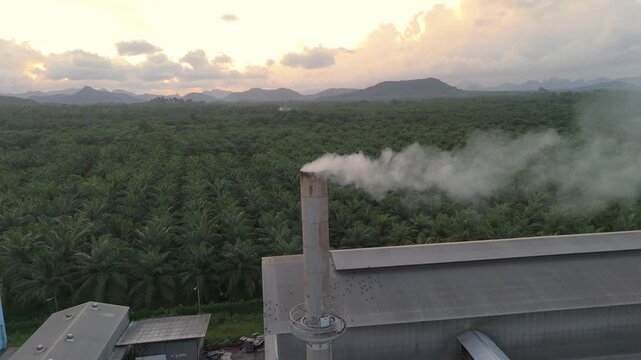
Aerial view sunset with clean air exhaust pipe for air pollution reduction. Economic growth, industrial energy, Environment sustainability. Business and technology development nature. Factory Palm oil
00:16
HD
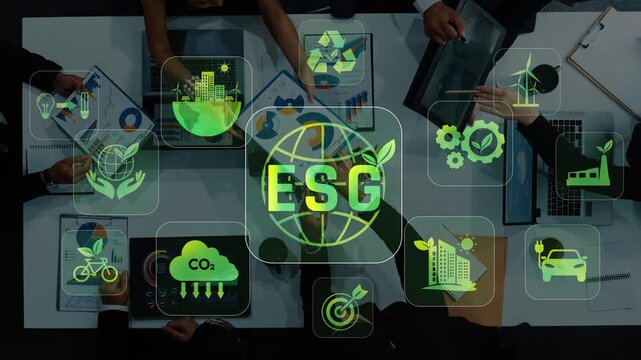
A diverse team collaborates on ESG strategies, surrounded by digital icons representing critical sustainability and governance concepts in a modern office setting. Raster
00:12
HD
Business progress metrics displayed in circular charts during a clean studio presentation with soft lighting
00:46
HD
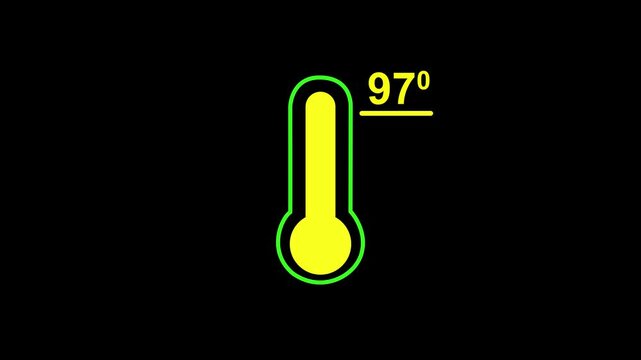
Neon glowing medical thermometer icon animation. That's indicates weather temperature 97 degree increase or decline. Thermometer equipment showing hot or cold weather.
00:10
HD
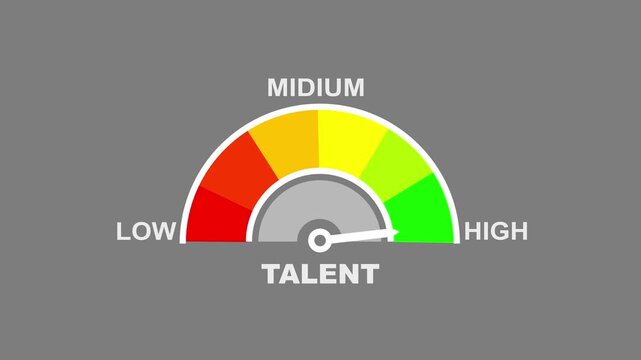
A colorful gauge talent levels from low to with a needle pointing towards medium on a black background. talent level text or word low and medium to high meter concept.
00:10
HD
Sales Growth Gauge Meter Indicating Normal Level on White Background indicator measurement
00:10
HD
Business graph chart with upward trend arrow red color animation on black background.
00:10
HD
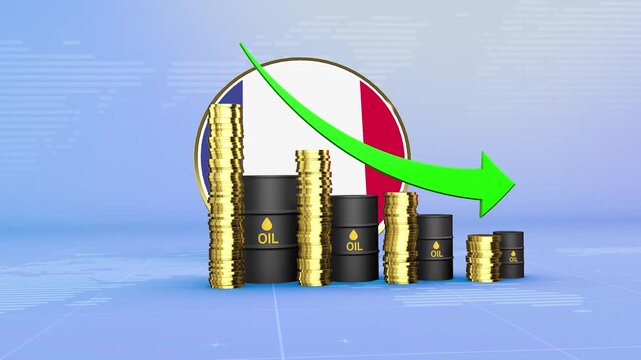
France Oil Prices Decline with Oil Barrels, Gold Coins and Downward Green Arrow, 3D Economic and Financial Market Concept
00:11
HD
Close up female hands checking temperature radiator and adjusting thermostat knob to increase or decrease heat output, energy efficiency and comfort. Heating period in house. High payments and savings
00:11
HD
Aerial view of a large solar farm adjacent to a cultivated field.
00:08
HD
Creativity Meter Animation: Track and Compare Creativity from Low to High Levels with Dynamic Increasing/Decreasing Gauge for Data Visualization, Performance Insights, and Motion Graphics
00:10
HD