암호 설정을 위한 링크가 다음으로 전송됨: 나중에 구매 기능을 이용하려면 암호가 필요합니다.
무제한 다운로드와 강력한 AI 편집 기능으로 제약 없이 창작해 보세요
새 필터 추가됨
정렬 기준

비디오에서 increase and decrease에 관한 19,768개 결과

Stock market price display abstract
00:07
HD
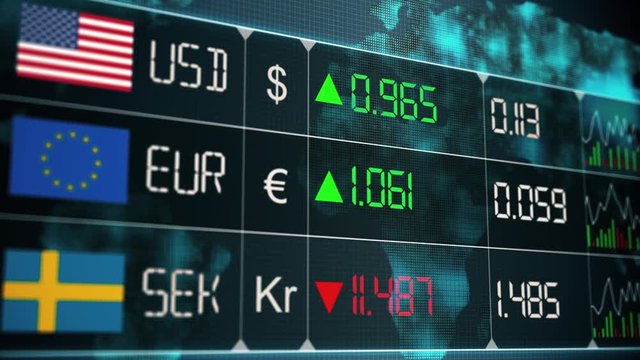
Evolution of currencies in the world market with up and downs of Swedish krona, Euro, US dollar. Currency market with green and red digital animation of prices in financial and ecomonic crisis
00:20
HD
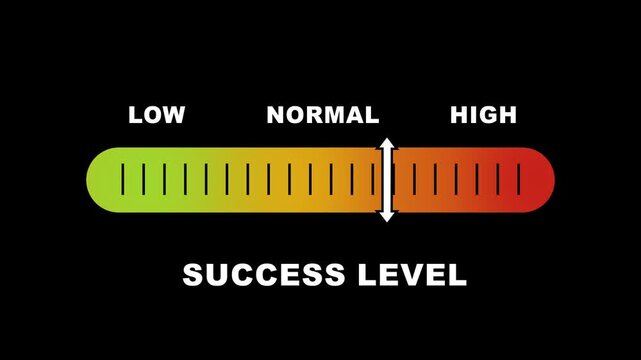
Success level indicator scale. Low normal & high meter infographic animation on black background. Showing high success level color gauge indicator for goal achievement and performance monitoring.
00:10
HD
Bright white 3D number 2020 text animation floating against a deep black void offering a vibrant and modern visual for the year with a sense of digital energy.
00:10
HD
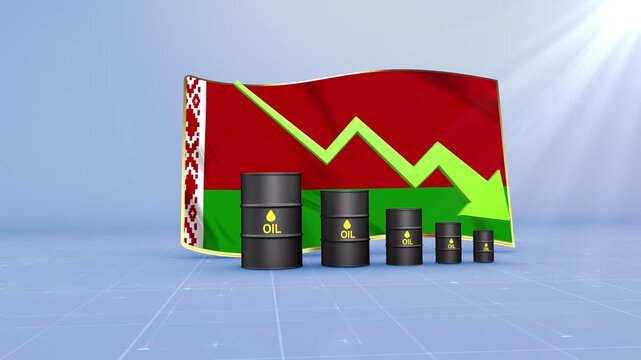
Belarus Crude Oil Price Drop with Oil Barrels Downward Green Arrow and 3D Financial Data Visualization Graphs for Economy and Business Concept
00:11
HD
Golden thirty percent discount emblem with blue rim on black background with subtle particles sale
00:07
HD
City Implements Bike Lanes and Pedestrian Zones in Urban Makeover Generative AI
00:10
HD
A business professional collaborating with farmers to build a joint business. Supporting farmers, mutual relationships, and business dependence. Economies of scale and cost reduction.
00:10
HD
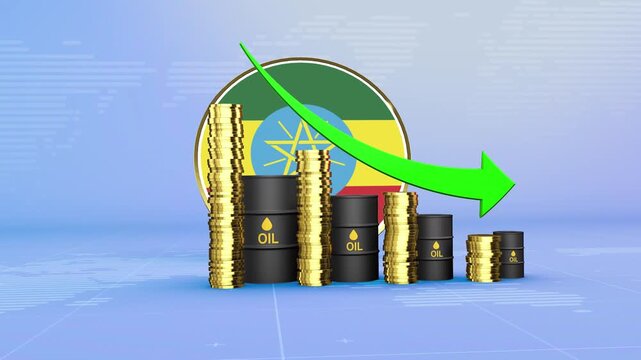
Ethiopia Oil Prices Decline with Oil Barrels, Gold Coins and Downward Green Arrow, 3D Economic and Financial Market Concept
00:11
HD
Magnifying glass reveals sparkling percentage symbol detail on dark surface.
00:08
HD
White color Down business graph icon animation on background. Bad Economy Recession Graph Chart.
00:06
HD
Touch press. Index finger, decrease, increase, approximation, Scrolling, click, arrow, sensor. Pressing concept. One line drawing animation. Motion design. Animated technology logo. Video 4K
00:10
HD
Lots of percent symbols in motion. A lot of different percent symbols in motion on a white background. Footage video
00:10
HD
High Performance Gauge Indicator Animation. Speedometer Icon with arrow Indicate high level
00:10
HD
Glowing neon line business graph chart icon animation background. business graph chart arrow icon neon glowing royal arrow . 4k animation video .
00:06
HD
Hand offering machinery, like a lawnmower, the financial concept of leasing and rent, with symbols representing business, property, and growth on a white background
00:17
HD
Animated dollar sign filling with green liquid representing 80 percent progress financial growth concept dark background with subtle green lines
00:06
HD
Financial loss concept illustration showing a downward trend arrow pointing at a stack of cash and a golden coin representing economic decline and market volatility
00:05
HD
Cost reduction concept animation, corporate business efficiently save cost and company resources by reduction of unnecessary expenses.
00:10
HD
Climate change , Global warming is expected to increase certain types of clouds in certain places and decrease them in others.
00:28
HD
Canadian flag on a digital screen with stock market charts, representing the global environment for Canada's financial landscape.
00:10
HD
Business mergers and acquisitions concept. Share acquisition, asset business acquisition, amalgamation. Business review and development model. The abbreviation M and A on icon background animation
00:15
HD
Net zero emission , carbon neutral concept. Net zero greenhouse gas emissions target. Climate neutral long term strategy 2050 with net zero digital growth chart and infographic on green nature backgro
00:10
HD
Circular economy concept for future business growth and environmental sustainability and reduce pollution.Net zero and carbon neutral concept.Concept day earth Save the world save environment.
00:15
HD
Senegal Oil Price Falling with Oil Barrels Downward Green Arrow and 3D Financial Data Visualization Graphs for Economy and Business Concept
00:11
HD
Zoom in and out animation the sea turtle symbol. Large black symbol in the center and four small symbols around. Seamless looped 4k animation on white background
00:12
HD
Data trend comparison with test results and percentage arrows indicating industry performance shifts and financial analysis results
00:05
HD
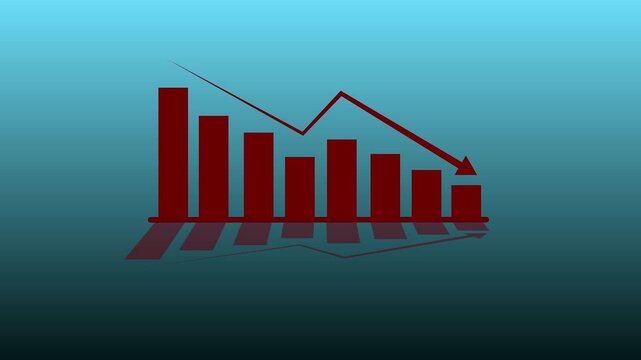
Business decline bar chart animation with falling line graph and shadow effects on transparent background. Indicate revenue decline, financial loss, negative growth
00:06
HD
Montenegro Oil Prices Decline with Oil Barrels, Gold Coins and Downward Green Arrow, 3D Economic and Financial Market Concept
00:11
HD
Video footage of stack of coins, increasing in height, symbolizing growth, wealth, and financial success
00:10
HD
Close up screen with trading information, stock market data, bid ask price and chart. Screen, investment, stock exchange, growth, strategy, prices up and down, risk , chance.
00:08
HD
Asian business team discussion reusable product in office,start up eco-friendly business,environmental protection,sustainable business model,ESG strategy,team meeting,people work at home concept
00:13
HD
A red and blue graph with many lines going up and down.
00:10
HD
abstract Business growth and success arrow, growing business chart animation. 4k motion graphics animation.
00:10
HD
Video with the phrase Feel the Music in Spanish, animated word by word with letter spacing reduction and sharp zoom transitions, delivered in four background and outline versions.
00:12
HD
Red neon arrow showing downward or decreasing market trend on black grid background. Futuristic glowing line graph indicating decline, negative growth, or decreasing analytics statistics concept.
00:06
HD
A professional using a laptop with a focus on cost reduction. The scene showcases essential financial analytics with glowing icons, emphasizing technology in business success. Qubit
00:14
HD
Green Bar Chart Showing Financial Decline with Stacked Coins and Upward Arrow finance. Stacked coins on green bars showing financial decline with upward arrow overlay, graph.
00:12
HD
Red Percentage Symbols Falling Against a Dark Black Background discount sale
00:10
HD
Animated down graph icon, Bar graph fall down with arrow moving animation. Stock Market Decline, Bar Graphs Falling chart.
00:11
HD
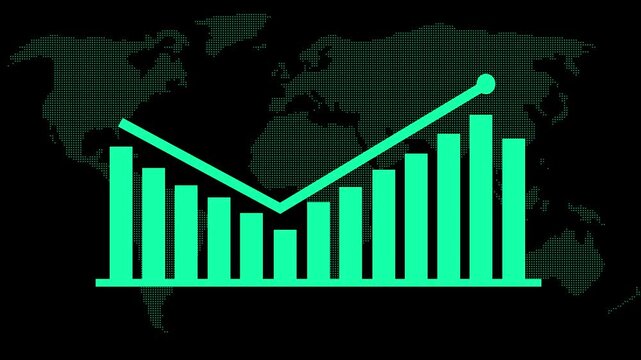
Animated bar chart showing decline and growth, data visualization with gradient bars, financial performance, statistics
00:10
HD
The businessman is shocked by the high interest rates. High tax deductions. Economic downturns, banking policy, taxation, and monetary regulation topics. Financial stress and rising borrowing costs
00:09
HD

A stock market chart with the Russian and American flags on either side, indicating crossroads in global economic trends between Russian and America.
00:10
HD
A business professional works diligently on a laptop, focusing on data analysis for effective cost reduction strategies. The modern office environment emphasizes efficiency and innovation
00:10
HD
Pakistan Oil Price Falling with Oil Barrels Downward Green Arrow and 3D Financial Data Visualization Graphs for Economy and Business Concept
00:11
HD
Leveraging carbon pricing to drive emission reductions and investment in low carbon technologies
00:05
HD
Neon Line Graph Arrow Downwards Against Black .Abstract neon line arrow down business graph.4k video animated.
00:13
HD
Quality control and company cost reduction. Cost and quality control concept. Successful organization strategy and management.
00:10
HD
Iraq Oil Prices Decline with Oil Barrels, Gold Coins and Downward Green Arrow, 3D Economic and Financial Market Concept
00:11
HD
Businessman showing light bulb with ESG icons and virtual tree. Net zero greenhouse gas emissions target. Climate neutral long term strategy. Ecological, renewable energy and save environment concept.
00:15
HD
Front view stock market screen with market data, trading volume, prices and percentage changes. Investment strategy, analyzing, data spreadsheet, financial figures, trading board, exchange information
00:12
HD
business team discussion reusable product in office,start up eco-friendly business,environmental protection,sustainable business model,ESG strategy,sustainability,team meeting,ESG Report concept
00:12
HD
Digital interface big data analytics, futuristic information dashboard, data visualization, technology, AI, innovation. Technology background, Business Statistics, Market Data Infographics Layout
00:20
HD
Abstract 3D number 1991 text animation floating against a deep black void offering a vibrant and modern visual for the year with a sense of digital energy. 4k motion video.
00:10
HD
Green buildings with lush trees surround urban offices, blending sustainability and modern technology. Perfect harmony of nature and architecture, promoting eco-friendly and sustainable city living.
00:10
HD
Three-word text animation featuring Find Something New with sequential word reveal, spacing reduction effect, and zoom transition in 3840x2160 format.

00:12
HD
Zoom in and out animation the top symbol. Large black symbol in the center and four small symbols around. Seamless looped 4k animation on white background
00:12
HD
graph chart up down business statistics
00:10
HD
Interest rate increase arrow animation.Financial, business, and statistical analysis.
00:10
HD
Business graph chart with down trend  arrow red color animation on black background.
00:05
HD
Cost cuts motion background, with animated red, arrows for business, finance presentations
00:08
HD
Glowing neon line House under protection icon with up arrow isolated on black background. a glowing light drawing a neon outline of houses decreasing in size. House, home building. 4K animation Video.
00:10
HD
Business Analytics Dashboard Motion Graphic with Growth Statistics
00:10
HD
Up And Down Arrow Icon
00:10
HD
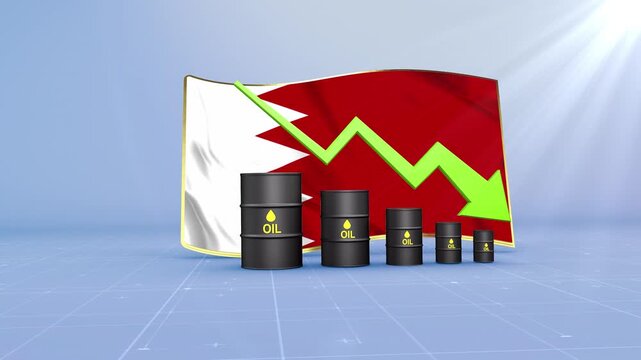
Bahrain Crude Oil Price Drop with Oil Barrels Downward Green Arrow and 3D Financial Data Visualization Graphs for Economy and Business Concept
00:11
HD
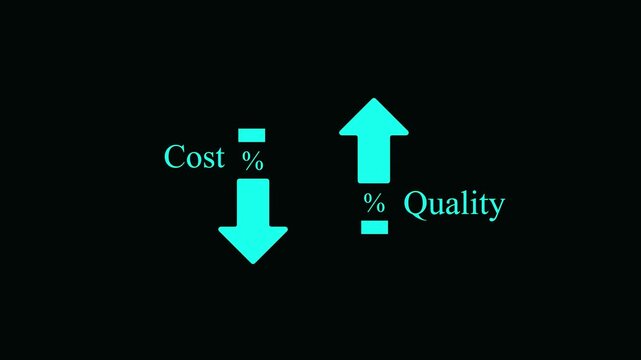
Cyan downward arrow for cost and upward arrow for with percentage symbols on a solid black background for business performance analysis
00:10
HD
Business decline bar chart animation with falling line graph and shadow effects on transparent background. Indicate revenue decline, financial loss, negative growth
00:06
HD
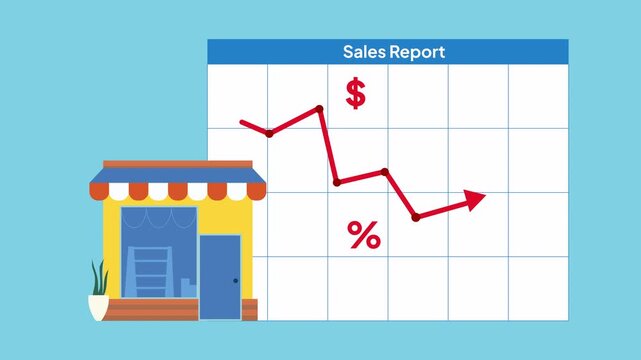
Animation of small business sales report showing a decreasing red arrow graph, decreasing purchasing power due to inflation, economic concept
00:15
HD
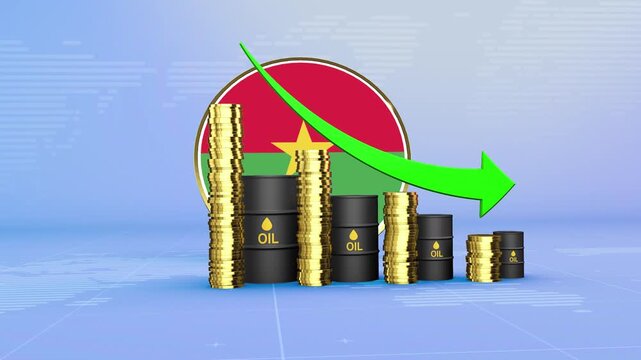
Burkina Faso Oil Prices Decline with Oil Barrels, Gold Coins and Downward Green Arrow, 3D Economic and Financial Market Concept
00:11
HD
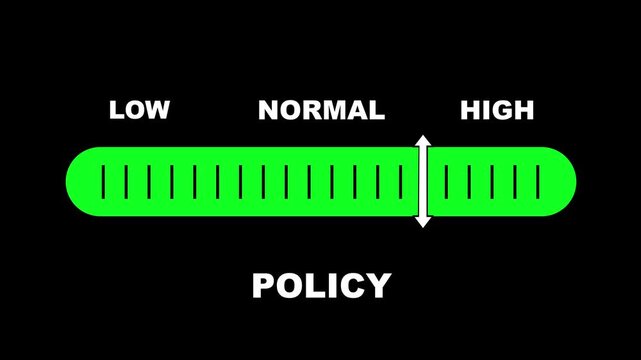
Policy level indicator scale. Low normal & high meter infographic animation on black background. Showing high policy level color gauge indicator for business governance and management analysis.
00:10
HD
Glowing blue business bar chart with downward arrow and declining line curve. Symbolizing revenue drop, financial loss, negative growth, market downturn 4K
00:07
HD
Glowing neon Percentage icon, quality control growth graph, and cost reduction animation with growth graph and cost reduction Percentage quality with up arrow, cost with down arrow.
00:10
HD
White hand drawn arrows for editing.
00:09
HD
White line graph showing a peak and decline on grid. White line graph for business data and trend. Digital white line graph animation for report.
00:06
HD
Wellness Level Text or Word Low and Medium to High Meter Concept Animation on Black Background and Blue Screen
00:58
HD
the phrase Multiply Your Money in Spanish, animated word by word with spacing reduction and sharp zoom transitions, available in four background and outline versions.
00:12
HD
Animated Security Status Meter.Measure Security Levels from Low to High with Dynamic Increasing and Decreasing Gauge, Ideal for Data Visualization, Performance Tracking, and Motion Animation
00:10
HD
Self-drawing of a falling graph of finances on a white background. Animation with a curve crisis indicators of losses. 4k business graphics with alpha channel.
00:10
HD
Declining bar chart with downward trend, Blue bar chart with falling line graph decline in business data, finance performance and analytics animation
00:07
HD
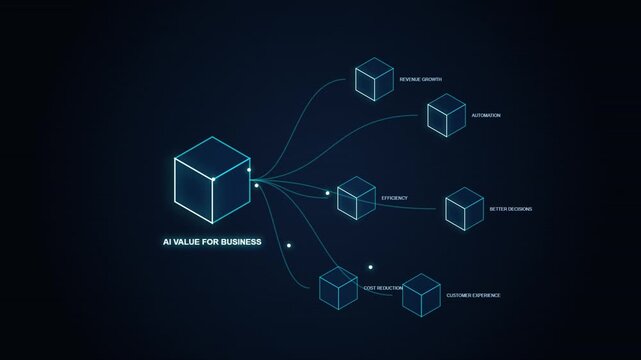
AI Value for Business diagram illustrating AI benefits such as automation, cost reduction, revenue growth, efficiency, customer experience - technology isometric infographics
00:10
HD
AI supports net zero goals via virtual assistant insights, AI-based green strategies, and artificial intelligence for climate-aware business planning. Kernel
00:12
HD
Zoom in and out animation the horning prohibited symbol. Large black symbol in the center and four small symbols around. Seamless looped 4k animation on white background
00:12
HD
Two curved arrows pointing in opposite directions minimal animation
00:06
HD
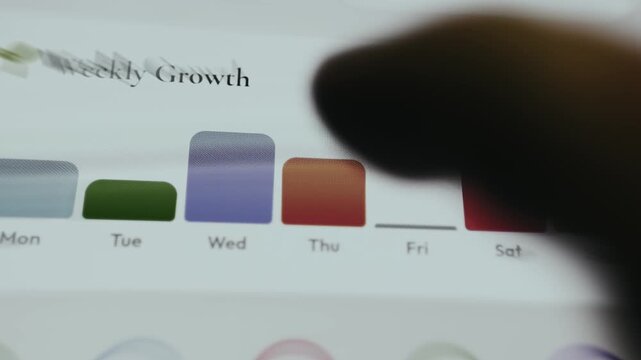
Bar chart titled Weekly Growth, tracking data from Monday through Sunday
00:14
HD
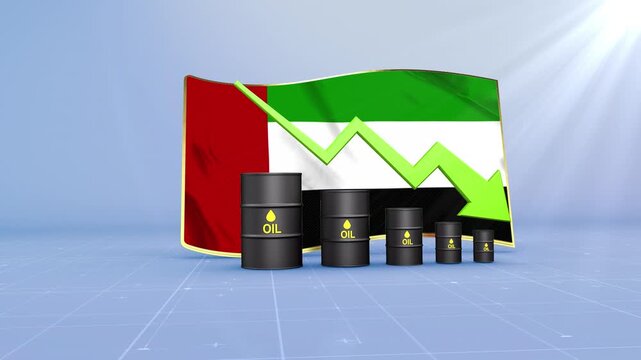
United Arab Emirates Oil Price Falling with Oil Barrels Downward Green Arrow and 3D Financial Data Visualization Graphs for Economy and Business Concept
00:11
HD
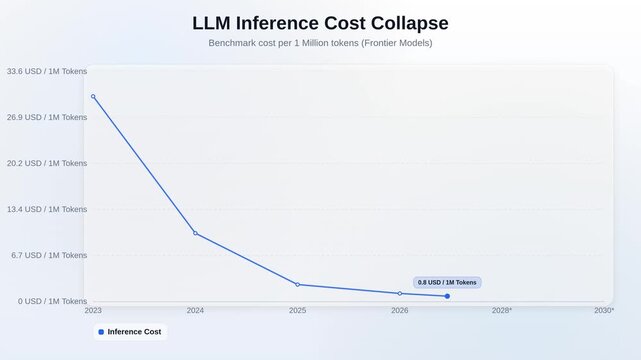
LLM Inference Cost Collapse Light Line Chart 4K Motion Graphic
00:10
HD
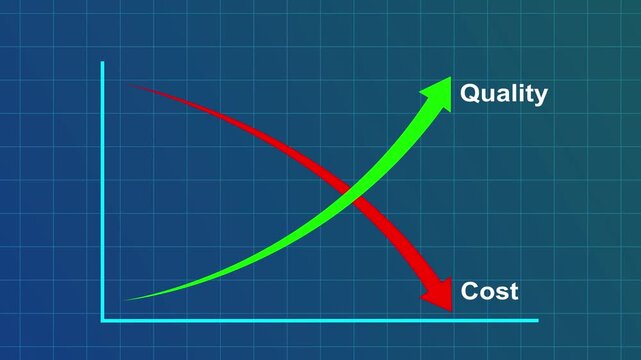
Business chart illustrating improving quality and cost reduction with green upward and red downward arrows.Motion graphics of concept
00:07
HD
Oil wave text on liquid price increase 3D text, beautiful bright word 3D animation
00:05
HD
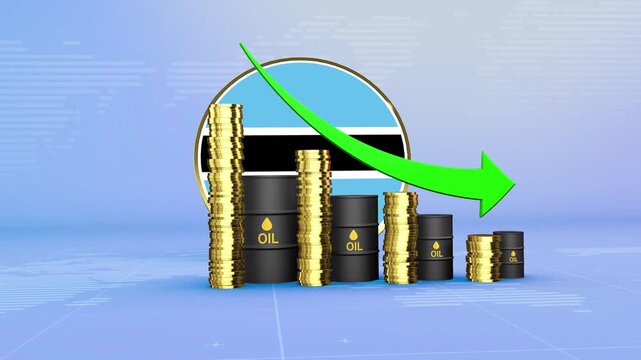
Botswana Oil Prices Decline with Oil Barrels, Gold Coins and Downward Green Arrow, 3D Economic and Financial Market Concept
00:11
HD
Money reduction icon. Dollar currency price drop concept. circle with down arrow moving animation.4k video
00:06
HD
Rising arrow transparent channel. arrow rising transparent channel, business growth arrow and graph chart, Business line arrow.
00:07
HD
Quality control and cost reduction concept, Cost and quality control concept, Successful organization strategy and management, Cost and quality comparisons are indicate arrow on dark background.
00:10
HD
Business cost reduction strategy represented by a balance scale weighing income against diminishing expenses.
00:10
HD
Business leaders discuss implement environmental sustainability strategies net zero carbon goals corporate responsibility using ESG reports data at meeting
00:13
HD
Two Red Bull Figures Face Off Beneath a Fluctuating Red Stock Market Chart in a Dimly Lit Setting Displaying Bear Market
00:08
HD
A wooden box filled with food scraps, fruits, vegetables, and autumn leaves arranged for composting. Highlights sustainable waste management, organic farming and environmental awareness.
00:12
HD
Animated Goal Achievement Gauge: Visualize Goal Completion from Low to High Levels with Dynamic Meter, Comparison Metrics, Performance Insights, and Motion Animation
00:10
HD
Computer screen displaying a graph with sharp decline in financial market against red and green background, A graph depicting a sharp decline in financial markets with no end in sight
00:08
HD
profit icon
00:06
HD
POV to screen of the stock market price feeding display on computer screen. Price of stock of thailand market while market opening.Stock price changing.
00:13
HD