암호 설정을 위한 링크가 다음으로 전송됨: 나중에 구매 기능을 이용하려면 암호가 필요합니다.
무제한 다운로드와 강력한 AI 편집 기능으로 제약 없이 창작해 보세요
새 필터 추가됨
정렬 기준

비디오에서 increase and decrease에 관한 19,768개 결과

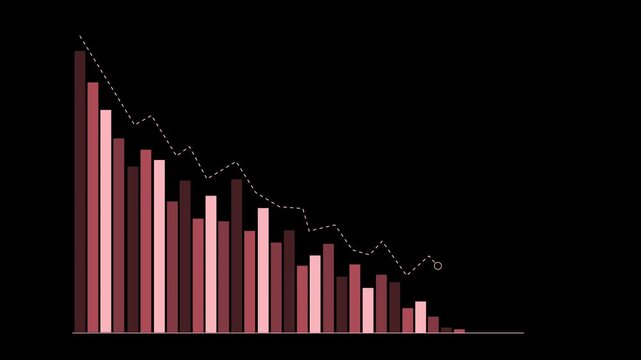
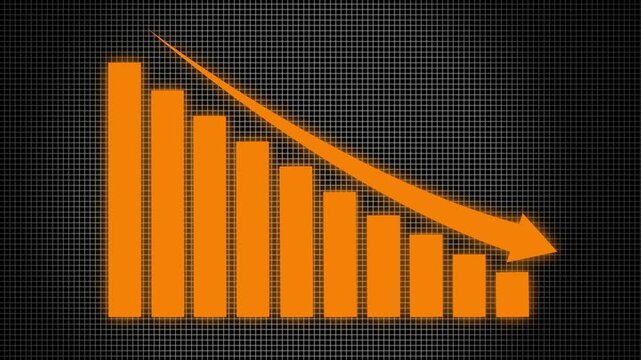
Outline bar chart animation reveals downward falling fiscal columns. Financial economic loss reflects across the outline bar chart. Negative corporate investment data marks the bar chart.
00:12
HD
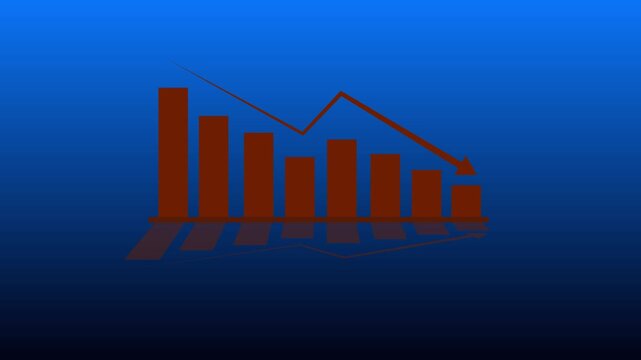
Animation showing downward blue arrow over bar graph indicating financial decline
00:14
HD
Zoom in and out animation the phone handset symbol. Large black symbol in the center and four small symbols around. Seamless looped 4k animation on white background
00:12
HD
Bright white 3D number 2041 text animation floating against a deep black void offering a vibrant and modern visual for the year with a sense of digital energy.
00:10
HD
A visual representation of teamwork focused on sustainability, showcasing icons of carbon reduction, recycling, and green initiatives in a corporate meeting setting. Raster
00:15
HD
Financial Chart: An abstract depiction of financial market trends, symbolized by stylized green and red candlesticks against a solid blue backdrop.
00:10
HD
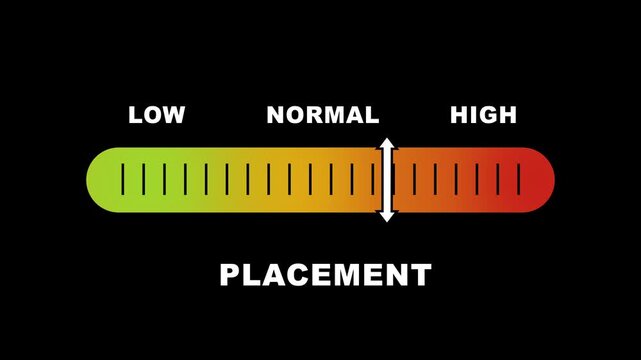
Placement level indicator scale. Low Normal High meter infographic animation on black background. Animation showing high placement level color gauge indicator for job, task, or performance monitoring.
00:10
HD
Animated bar and line graphs showing financial market trends and business growth, 4K UHD footage cinematic animation, fit for corporate data dashboard and financial reporting presentations.
00:07
HD
Two curved arrows pointing in opposite directions minimal animation
00:06
HD
placement level indicator scale. Low normal & high meter infographic animation. Showing high placement level color gauge indicator. on a white background 4k animation video
00:10
HD
Churn Rate Percentage Decrease Animation on Green Screen Background.
00:06
HD
Cryptocurrency trading. Bitcoin stock graphic. Bitcoin mining and Finance banking management concept, oil and Money trading, Digital trade platform. Profit and loss graph. Online trading
00:13
HD
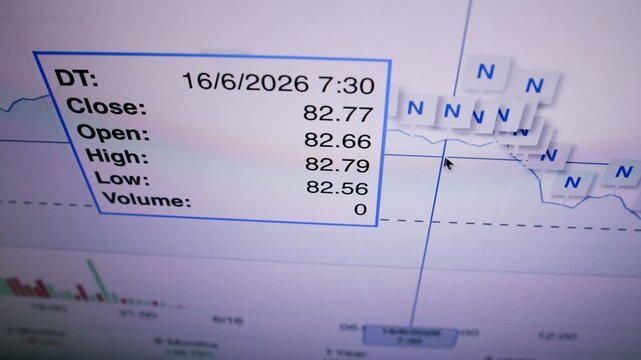
Close-up trading monitor with index charts, currency and sector data, stock market information. Device screen, business data, trading board, prices, trading volume, investment, financial markets.
00:12
HD
Hand holding a glowing infinity symbol representing circular economy concept
00:08
HD
Screen Time Regulation Word Cloud
00:11
HD
Business spending optimization concept strategic financial planning, budget management, and cost reduction strategies for increased profits and resource allocation
00:17
HD
Economic graph animation going down with an arrow isolated on white background
00:10
HD
Asian business team discussion reusable product in office,start up eco-friendly business,environmental protection,sustainable business model,ESG strategy,team meeting,people work at home concept
00:10
HD
Close-up of hands typing on laptop. Digital arrow points downward with 'COST %' text. Shows focus on budgeting or financial reduction. Ideal for business, finance
00:10
HD
thermometer temperature animation rising and falling
00:10
HD
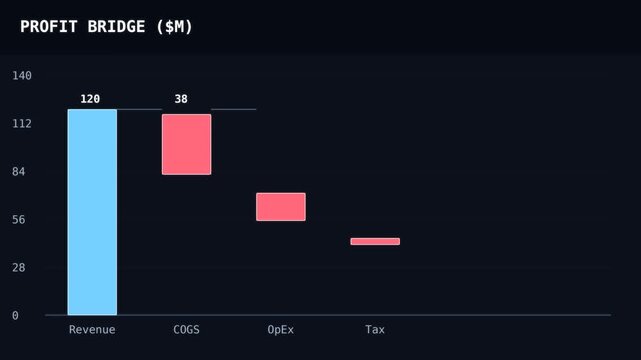
Profit bridge waterfall chart moving from revenue through costs to net profit with connectors. Illustrative financial graphic for business reports.
00:10
HD
White dashed line graph with dots on black background chart data
00:10
HD
Abstract decrease icon on black background. Dollar rate down looped icon. Reduce costs sign and symbol. Motion graphics of concept. animation
00:06
HD
Bright white 3D number 2023 text animation floating against a deep black void offering a vibrant and modern visual for the year with a sense of digital energy.
00:10
HD
Armenia Crude Oil Price Drop with Oil Barrels Downward Green Arrow and 3D Financial Data Visualization Graphs for Economy and Business Concept
00:11
HD
A powerful visual representation of teamwork and commitment towards achieving net zero emissions, showcasing hands supporting a green globe amidst environmental icons and elements. Raster
00:15
HD
22 Percent Decline Animation
00:06
HD
Carbon footprint reduction highlights climate responsibility with clean energy and sustainability data to lower emission impact and promote greener future through informed emission data analysis
00:05
HD
New Zealand Oil Prices Decline with Oil Barrels, Gold Coins and Downward Green Arrow, 3D Economic and Financial Market Concept
00:11
HD
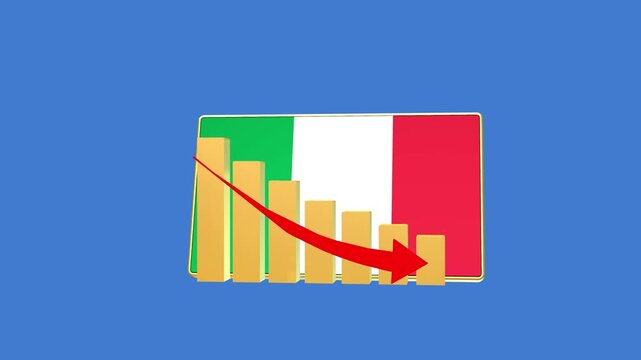
Italy economic bar chart graph showing decreasing downturn with national Flag 3D animation on black background.
00:16
HD
Three word kinetic typography sequence displaying Make Content Viral with sequential letter spacing reduction and sharp zoom transition
00:12
HD
Cryptocurrency trading. Bitcoin stock graphic. Bitcoin mining and Finance banking management concept, oil and Money trading, Digital trade platform. Profit and loss graph. Online trading
00:12
HD
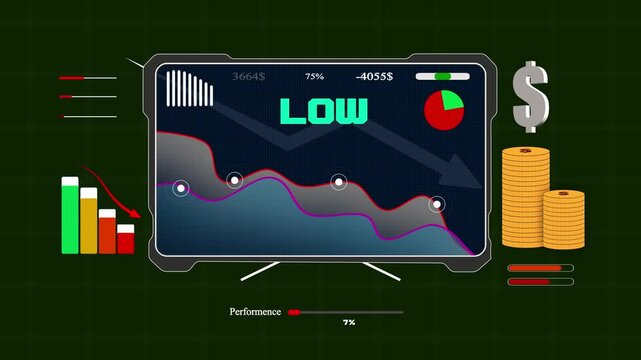
An electronic monitor showcasing low financial growth trends and negative returns for corporate market analysis presentations
00:15
HD
Placement level indicator scale. Low Normal High meter infographic animation on black background. Animation showing high placement level color gauge indicator for job, task, or performance monitoring.
00:10
HD
Global financial bar and line graph with world map background chart finance
00:11
HD
Pricing discount controls concept a digital strategy for managing promotions, coupons, and sales, optimizing financial adjustments for products and services
00:17
HD
Zoom in and out animation the shopping bag symbol. Large black symbol in the center and four small symbols around. Seamless looped 4k animation on white background
00:12
HD
Bar Chart and Line Chart Down Graph
00:08
HD
Futuristic dollar countdown timer animation, glowing dollar symbol integrated with a circular countdown display, numbers decreasing smoothly from 0 to 80
00:10
HD
Financial stock market chart showing downward price trend
00:08
HD
Sulfur dioxide level indicator scale. Low normal & high meter infographic animation on black background. Showing high sulfur dioxide level color gauge indicator for Air quality environmental pollution
00:10
HD
Abstract glowing neon swipe arrow. 4k animation. Down to up neon line arrow direction animation. Neon line raising business arrow on black background.on black backgraund .HD video animation.
00:10
HD
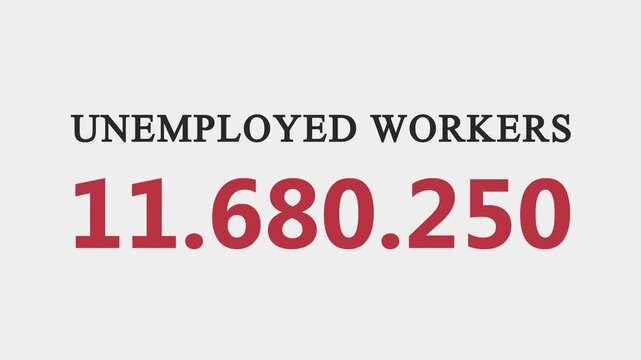
 4K Ultra High Unemployed Workers Number US
00:30
HD
Abstract 3D number 1960 text animation floating against a deep black void offering a vibrant and modern visual for the year with a sense of digital energy. 4k motion video.
00:10
HD
Ireland Oil Price Falling with Oil Barrels Downward Green Arrow and 3D Financial Data Visualization Graphs for Economy and Business Concept
00:11
HD
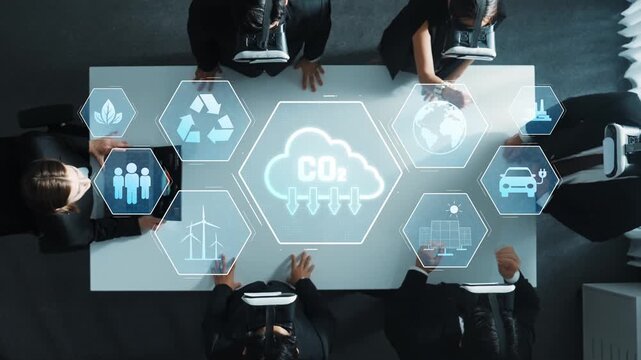
A corporate team gathers for a strategic meeting focused on climate change, utilizing digital tools to visualize and discuss solutions for reducing CO2 emissions and promoting sustainability. Raster
00:15
HD
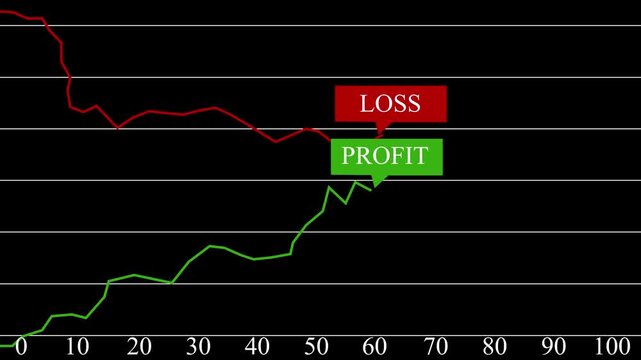
Trading Profit and Loss Icon Animation on Black Background. Stock Market Up and Down Arrows, Financial Growth, Investment and Trading Symbol Motion Graphics.4K Video.Trading Profit and Loss Indicator.
00:10
HD
graph chart up down business statistics report
00:09
HD
Panama Oil Prices Decline with Oil Barrels, Gold Coins and Downward Green Arrow, 3D Economic and Financial Market Concept
00:11
HD
Percentage Progress Bar Loading Concept, Digital Data Flow, Financial Growth, UI Element
00:10
HD
Operational efficiency and resource management concept featuring productivity icons, streamlined logistics, and performance enhancement tools for enterprise
00:15
HD
Close-up stock market data, filled orders, bid and ask prices, trading volume. Stock exchange information, moving up and down, trading board, financial markets, analyzing.
00:12
HD
Iran economic bar chart graph showing decreasing downturn with national Flag 3D animation on black background.
00:16
HD
Efficiency level indicator scale. Low normal & high meter infographic animation on white background. Showing high efficiency level color gauge indicator for Performance and productivity monitoring.
00:10
HD
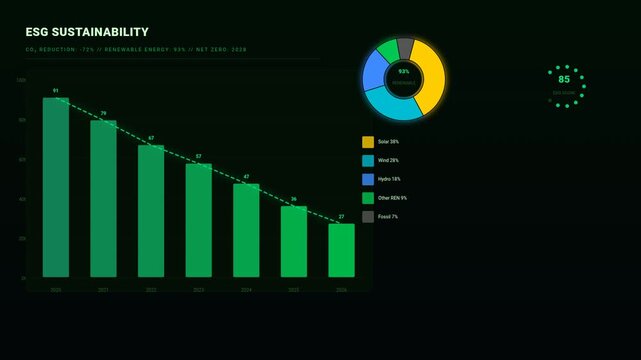
ESG Sustainability Dashboard Showing CO2 Reduction And Renewable Energy Metrics
00:15
HD
Child friendly therapy play addressing developmental needs, using a robot assistant, stress reduction, and educational abacus activities for effective rehabilitation
00:17
HD
Zoom in and out animation the package box symbol. Large black symbol in the center and four small symbols around. Seamless looped 4k animation on white background
00:12
HD
response level indicator scale. Low normal & high meter infographic animation. Showing high response level color gauge indicator. on a black background 4k animation video
00:10
HD
Thermometer Temperature Increase Decrease Animation Clinic Weather in 4k animation -5 degree temperature animation with alpha channel in transparent background
00:10
HD
Digital bar chart lines compare market volatility trends using dual arrows. Financial analysis software modules look crisp across this grid monitor bar chart framework. Data charts update.
00:10
HD
Financial dashboard animation showing a downward trend with graphs and charts, indicating a stock market crash, economic recession, business failure, and financial crisis on a futuristic interface
00:10
HD
Glowing blue neon continuous line forming up and down arrows isolated on black background, perfect for finance, trade, and data exchange concept.
00:10
HD
Radiation level indicator scale. Low normal & high meter infographic animation on black background. Showing high radiation level color gauge indicator for environmental and safety monitoring.
00:10
HD
Bright white 3D number 2047 text animation floating against a deep black void offering a vibrant and modern visual for the year with a sense of digital energy.
00:10
HD
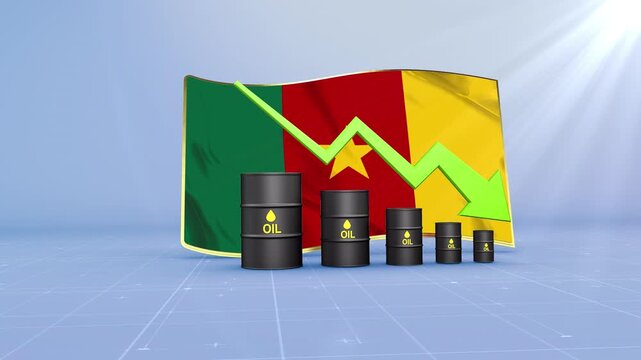
Cameroon Crude Oil Price Drop with Oil Barrels Downward Green Arrow and 3D Financial Data Visualization Graphs for Economy and Business Concept
00:11
HD
Individuals collaborating on sustainability strategies with a laptop, colorful charts, and CO2 representation, highlighting the importance of climate action efforts. Raster
00:12
HD
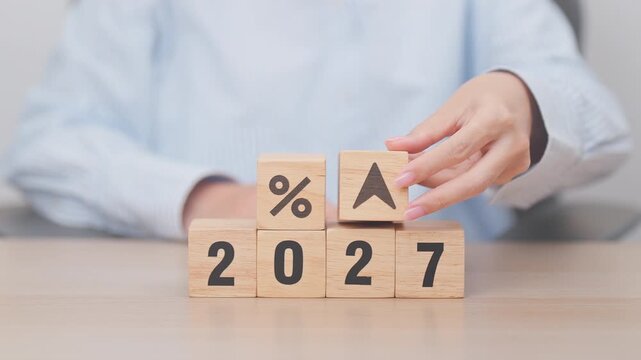
2027 New year with change to UP and Down arrow. Interest rate, GDP, stocks market, financial, deflation and Inflation, mortgage, debt, Loan and Economic Recession
00:09
HD
budget planning icon and Business structure of network, financial forecasting tools, expense optimization strategies, cost reduction methods, investment management solutions
00:10
HD
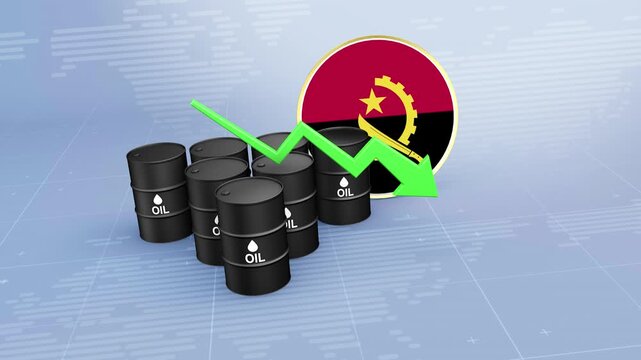
Angola Crude Oil Price Decline with Oil Barrels and Downward Green Arrow
00:11
HD
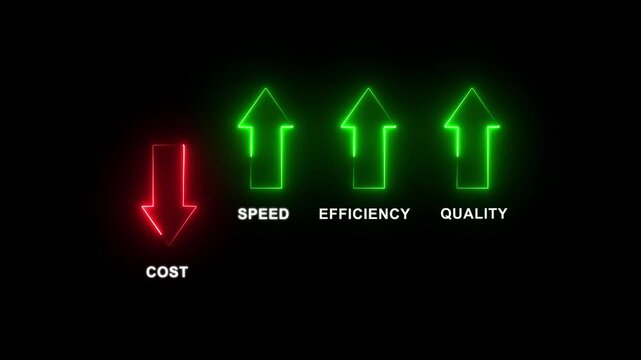
Businessman reduces cost while boosting speed efficiency and quality with digital interface animation on a black background. Motion graphics of quality and cost control concept
00:10
HD
Quality control and company cost reduction. Cost and quality control concept. Successful organization strategy and management.
00:10
HD
Declining bar chart with downward trend, Blue bar chart with falling line graph decline in business data, finance performance and analytics animation
00:07
HD
Business decline bar chart animation with falling line graph and shadow effects on transparent background. Indicate revenue decline, financial loss, negative growth
00:06
HD
Danger level indicator scale. Low Normal High meter infographic animation on black background. Animation showing high danger level color gauge indicator for safety and risk monitoring
00:10
HD
white business graph chart growth up down or signal on black background with alpha channel. Business up and down signal concept.
00:07
HD
Business concept customer loyalty, client acquisition, and analytics of leaving customers, showing customer lifecycle management and marketing strategy for improvement
00:17
HD
Zoom in and out animation the database symbol. Large black symbol in the center and four small symbols around. Seamless looped 4k animation on white background
00:12
HD
Informational graphic presents Boost vs Drain on a split screen. Text colors subtly change over a light gray background, focusing on a critical concept
00:06
HD
Mobile Network Signal Strength Animation
00:15
HD
Bar chart for declining business performance by month. the curve shows a downward move .chart graph animation, 4k arrow is making downfall on a grid ...
00:10
HD
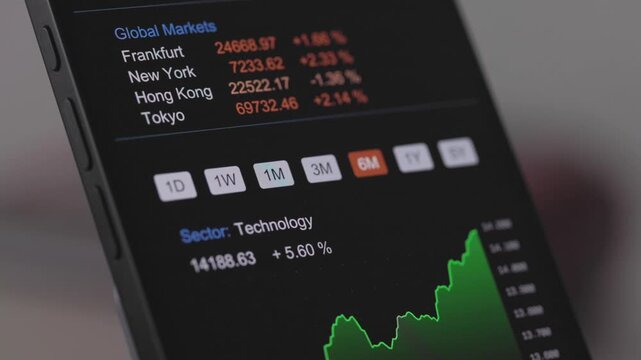
Smartphone screen shows rising technology stock index, markets data from Frankfurt, Tokyo and New York. Trading board, financial markets, prices, volatile markets, investment strategy.
00:12
HD
Currency fluctuation icon featuring money with upward and downward arrows. Visual representation of exchange rate movement and financial market changes.
00:10
HD
Animated financial bar chart and line graph showing data trends on a dark purple background
00:08
HD
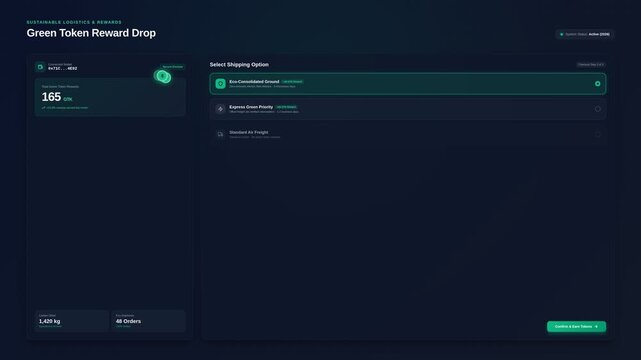
Digital interface with logistics shipping options carbon offset token rewards, for sustainable supply chain management, carbon footprint reduction, eco-friendly business operations
00:20
HD
Kyrgyzstan Oil Price Falling with Oil Barrels Downward Green Arrow and 3D Financial Data Visualization Graphs for Economy and Business Concept
00:11
HD
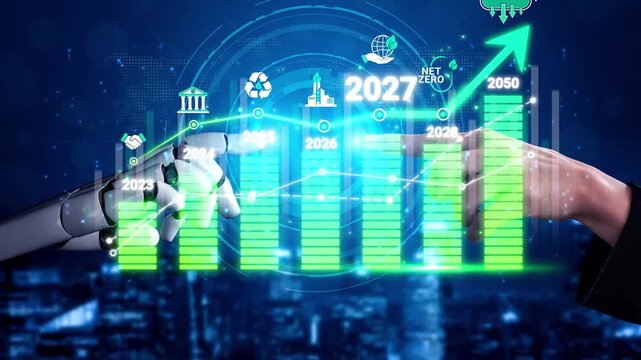
Futuristic Business Growth with Robot and Human Hands Over Graph Representing Sustainable Development Goals and Environmental Progress from 2023 to 2050 Sigmoid
00:10
HD
Cartoon Piggy Bank Animation with Laptop Displaying Decreasing Financial Chart and Dropping Coins for Business Loss and Budget Crisis Concept.
00:07
HD
Profit growth icon, abstract financial icon, rising dollar graph, growth graph silhouette, business icon, financial icon
00:10
HD
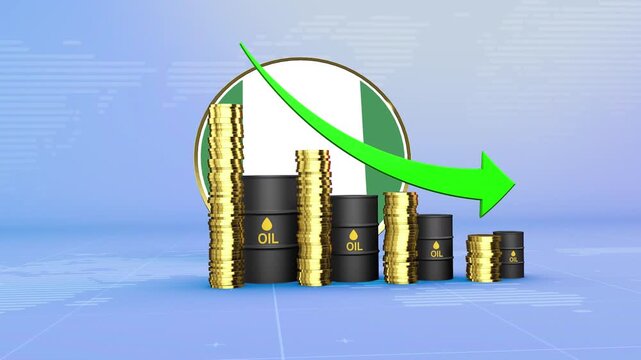
Nigeria Oil Prices Decline with Oil Barrels, Gold Coins and Downward Green Arrow, 3D Economic and Financial Market Concept
00:11
HD
Neon BUY and SELL arrow icon Understanding Market Trends The Dynamics of Buying and Selling in Financial .Stock exchange trading, forecast signal to Sell, falling share price, bearish stock market .
00:10
HD
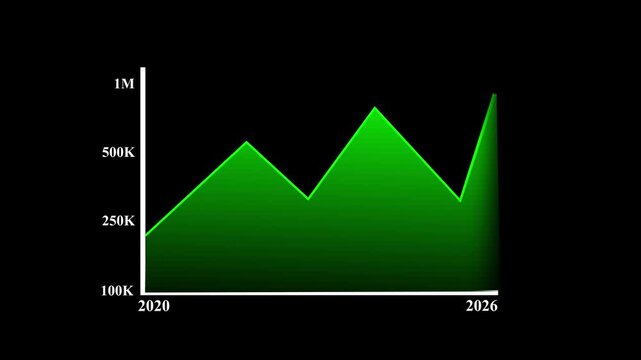
Green chart rises and falls over a four year period
00:08
HD
Growing Line Graph Animation. Neon Line Going Upward and Downward Showing Progress
00:05
HD
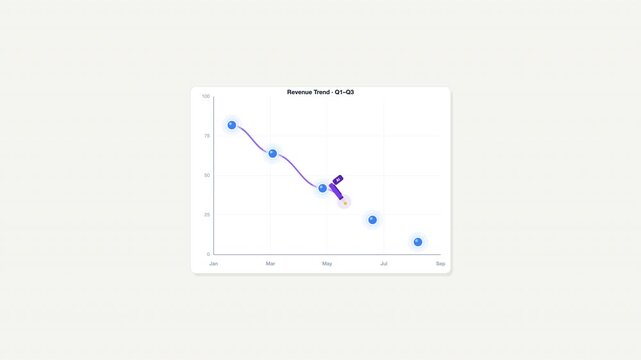
Revenue trend 6m line chart with blue circles and purple wavy line. Suitable for financial presentations, reports, and data analysis projects.

00:10
HD
CO2 reduction icon on green leaf, Reduce CO2 emission concept.
00:10
HD
Cost control and quality improvement concept. Red bar chart with line graph showing cost reduction and improving quality. Successful business strategy, efficiency, product optimization and management
00:06
HD
Natural streamlining process involves automating tasks, optimizing schedules, and managing data for improving business operations and achieving efficient workflows
00:17
HD
graph chart up down business statistics
00:07
HD
England economic bar chart graph showing decreasing downturn with national Flag 3D animation on black background.
00:16
HD
Neon green dollar coin stack with downward arrow animation for financial growth and savings concepts
00:10
HD
Man hand adjusting smart thermostat temperature on wall from 23 to 26 and 25 degree. Digital climate control and energy saving concept for modern home automation
00:08
HD