암호 설정을 위한 링크가 다음으로 전송됨: 나중에 구매 기능을 이용하려면 암호가 필요합니다.
무제한 다운로드와 강력한 AI 편집 기능으로 제약 없이 창작해 보세요
새 필터 추가됨
정렬 기준

비디오에서 increase and decrease에 관한 19,768개 결과

Acceleration Word Cloud
00:11
HD
blood sugar level indicator scale. Low normal high meter infographic animation on black background. Showing high pressure level color gauge indicator.4k quality animation video
00:10
HD
Luxembourg Oil Prices Decline with Oil Barrels, Gold Coins and Downward Green Arrow, 3D Economic and Financial Market Concept
00:11
HD
Loss prevention plan concept strategic financial management, risk reduction, profit increase, and business growth through calculated actions and analysis
00:17
HD
Italy Oil Price Falling with Oil Barrels Downward Green Arrow and 3D Financial Data Visualization Graphs for Economy and Business Concept
00:11
HD
Financial Market Decline and Economic Downturn Falling Dollar Value, Decreasing Wealth, Shrinking Investment Returns, Lower Asset Prices, and Increasing Financial Risk
00:10
HD
Bar chart and line graph icon showing financial data trend analysis and business performance animation
00:10
HD
US dollar coin inflation rise and fall value financial animation HD 4K
00:12
HD
Hands typing on laptop with green energy icons and symbols illustrating sustainable technology and eco-friendly practices in modern workspace. Cipher
00:10
HD
Purple bar chart showing downward trend with arrow graph. Financial loss chart for corporate performance failure metrics. Digital bar chart animation for network alert.
00:12
HD
Business graph. loss graph direction. damage business graph. down business graph icon. business or finance concept icon animation.
00:07
HD
glowing neon Global business analyzing concept with trade. Financial figures and charts showing a downward trend, business crash and economic collapse 4k video animation.
00:10
HD
Dynamic Promotional Banner Featuring a Fifty Percent Discount Offer for Modern Digital Marketing Campaigns and Online Retail Sales Events
00:10
HD
Glowing neon line graph downwards against black background animation. Stock market losses and descending trading graph and downward arrows recession
00:10
HD
A graph is plotted against a lime-yellow background; the green elements, which represent gains, are trending upward and are marked with arrows, while the red elements, representing losses, are positio
00:10
HD
Cost and quality control concept. Successful organization strategy and management. Quality control and company cost reduction, neon 4k video.
00:10
HD
Carbon capture and offset icon depicting green plant sprout growing out of co2 cloud symbol vector
00:15
HD
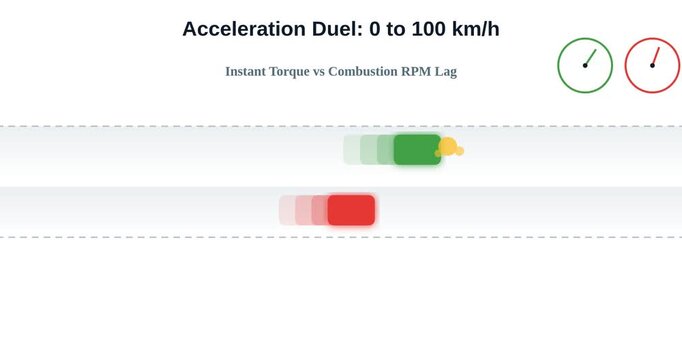
acceleration race
00:10
HD
Illicit trade of Opioids tramadol and oxycodone or oxy is significant public health danger. Supplies contaminated with potent synthetic fentanyl. Counterfeit pills increases risk of fatal overdose.
00:17
HD
Digital Data Visualization with Bar Charts Blue and Orange Bars on Dark Background
00:10
HD
Candles of the stock market, price falls. Falling prices of securities. Loss of assets in equities stock. Decreasing trend showing unsuccessful performance and losses failure due to economic.
00:10
HD
Professional HTML and SVG animated vertical bar chart featuring ten red bars showing a declining trend and an orange downward diagonal arrow on a solid chroma key green background.
00:10
HD
Libya Oil Prices Decline with Oil Barrels, Gold Coins and Downward Green Arrow, 3D Economic and Financial Market Concept
00:11
HD
Market index fund investment strategy involving financial analysis, portfolio management, and monitoring market trends for passive income growth and long term asset accumulation
00:17
HD
Liechtenstein Oil Price Falling with Oil Barrels Downward Green Arrow and 3D Financial Data Visualization Graphs for Economy and Business Concept
00:11
HD
Interest rate and dividend. business financial investment, business growth, income, motion graphic of marketing and profit concept.
00:10
HD
Red rectangular stamp with the word WARNING in distressed white font on a white background
00:06
HD
Hand drawn white zigzag arrow moving upward and downward on a dark background. 4K horizontal video
00:06
HD
Modern digital representation of artificial intelligence with quality and cost indicators over a keyboard, showcasing technology and innovation in business analytics Sigmoid
00:10
HD
Bar chart animation with earth globe. Bar chart global financial growth data. Bar chart international business analytics graphic on black background for trade.
00:07
HD
Mental Health First Aid Word Cloud
00:11
HD
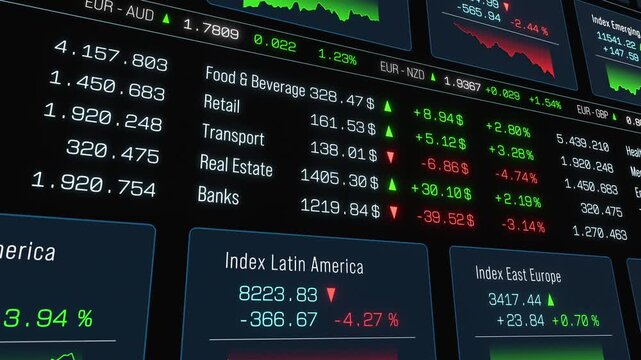
Close-up trading screen with index charts, currency and sector data, stock market information. Business, trading board, computer screen, prices, trading volume, investment, financial markets.
00:10
HD
word LOSS dips letter by letter as a red downward graph line draws beneath it and ends in a descending arrow. Useful for financial loss with a transparent alpha channel for compositing
00:08
HD
Red bar chart with line graph showing cost reduction and improving quality.. growing business concept.
00:10
HD
Global business line animation. Abstract glowing neon line business graph growth arrow to down arrow.  loss, and negative trends on a dark, abstract background
00:10
HD
carbon monoxide level indicator scale. Low normal & high meter infographic animation. Showing high carbon monoxide level color gauge indicator. on a white background 4k animation video
00:10
HD
Animated Stress Level Gauge Infographic Illustrating Mental Health Tension and Overwhelm
00:07
HD
Minimalist bar chart animation showing declining business trends
00:10
HD
25 percent off discount badge isolated on dark background.
00:06
HD
Zoom in and out animation the map symbol. Large black symbol in the center and four small symbols around. Seamless looped 4k animation on white background
00:12
HD
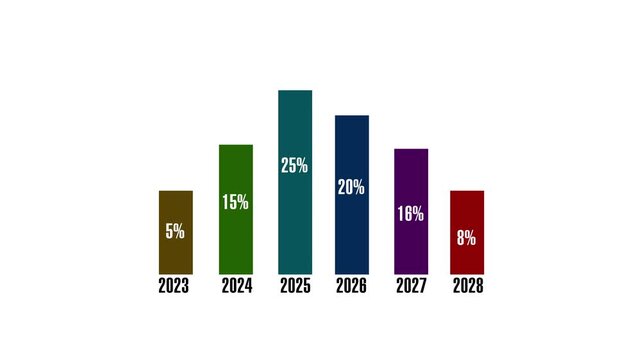
Annual bar chart animation tracks multi year percentage growth data. Corporate financial progress metrics update the bar chart. Long term investment success drives this bar chart.
00:06
HD
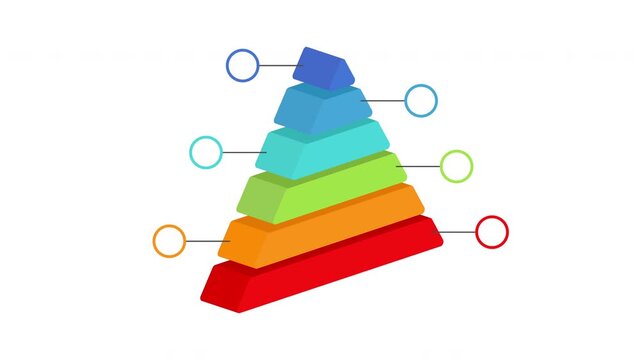
Commercial infographic animated 3D pyramid consisting of 6 blocks
00:07
HD
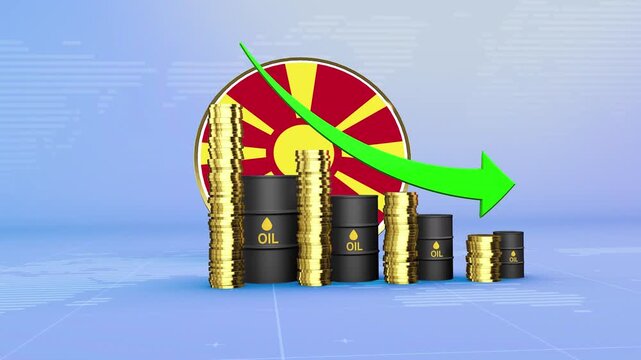
Macedonia Oil Prices Decline with Oil Barrels, Gold Coins and Downward Green Arrow, 3D Economic and Financial Market Concept
00:11
HD
Business concept visualizing human resource management, assessing employee potential, analyzing productivity metrics, and optimizing labor allocation for efficient organizational development
00:17
HD
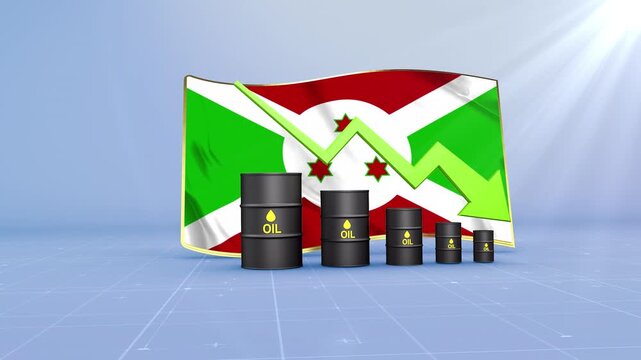
Burundi Crude Oil Price Drop with Oil Barrels Downward Green Arrow and 3D Financial Data Visualization Graphs for Economy and Business Concept
00:11
HD
Thyroxine Level Gauge Increasing and Decreasing Indicating Metabolic Activity Animation
00:19
HD
Modern line graph displays falling investment market trends. Technical line graph monitors negative corporate revenue data. Financial crisis concept with digital line graph.
00:10
HD
Volume Level Control Animation with Speaker Sound Wave, Plus and Minus Buttons on Soft Peach Background
00:09
HD
Business professionals engage with mobile devices while showcasing a timeline for carbon neutrality from 2026 to 2050, emphasizing commitment to sustainability and innovation. Raster
00:15
HD
Bar Chart, Profit Down, financial decline trend line chart, Economic crisis, recession, inflation, decrease graph. Bar chart Profit down. Concept of economic crisis, recession, inflation.
00:10
HD
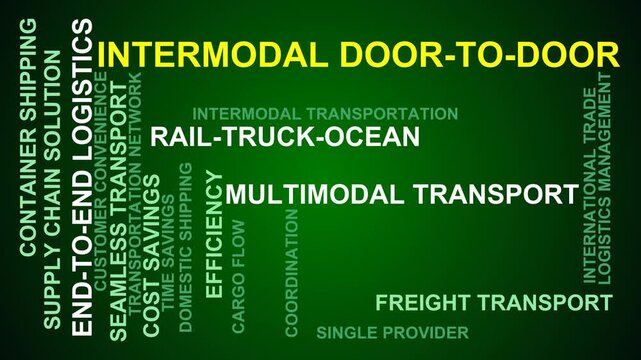
Intermodal Door-To-Door Word Cloud
00:11
HD
Abstract increase icon on black background. Dollar rate up looped icon. Reduce costs sign and symbol. motion video 4k quality..
00:06
HD
Financial Stock Market Graph Showing Upward and Downward Trends with Data Analysis
00:15
HD
Finance fund stocks price increase and decrease charts arrow up and down, ticker display. table grid Stock exchange screen number with financial trade index rates
00:20
HD
Business Bar Chart Growth Report Data Visualization On White Background
00:10
HD
Green arrow pointing down over a dollar sign icon on a black background
00:10
HD
stroke level indicator scale. Low normal & high meter infographic animation. Showing high stroke level color gauge indicator. on a white background 4k animation video
00:10
HD
Stamina level indicator scale. Low Normal High meter infographic animation on black background. Animation showing high stamina level color gauge indicator for fitness and endurance monitoring.
00:10
HD
Close up of moving digital Business Growth Financial Trading Chart and Stock Market Data Animation looping Seamless Motion Background. Business stock data concept
00:27
HD
Churn rate Blue fintec KPI dashboard card showing customer loss percentage, decrease indicator and trend chart. Animated motion graphics component for subscription analytics, SaaS reports, retention
00:10
HD
Futuristic dollar countdown timer animation, glowing dollar symbol integrated with a circular countdown display, numbers decreasing smoothly from 0 to 30,
00:10
HD
Business analytics trend arrow growth indicator overlay
00:10
HD
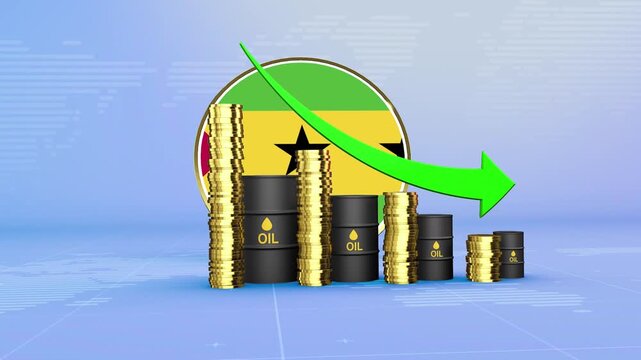
Sao Tome and Principe Oil Prices Decline with Oil Barrels, Gold Coins and Downward Green Arrow, 3D Economic and Financial Market Concept
00:11
HD
Bright white 3D number 2002 text animation floating against a deep black void offering a vibrant and modern visual for the year with a sense of digital energy.
00:10
HD
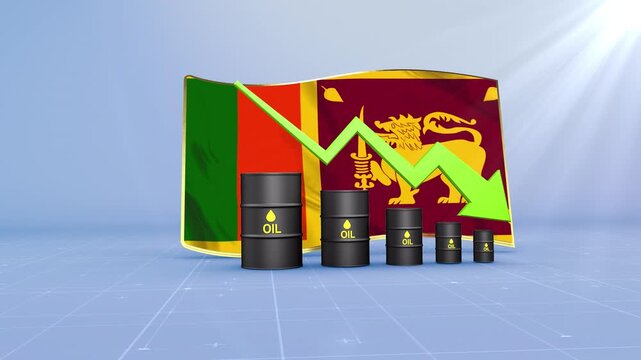
Sri Lanka Oil Price Falling with Oil Barrels Downward Green Arrow and 3D Financial Data Visualization Graphs for Economy and Business Concept
00:11
HD
Red chart background glows with financial data. White and orange candlesticks show market movements. Green and yellow lines track rising and falling trends
00:10
HD
Neon Celsius thermometer displayed temperature 45 degree. Digital Temperature Meter Display 45°C. That's indicates weather temperature 45 degree increase or decline.4k video.
00:10
HD
Downward zigzag arrow symbolizing decline loss or falling trend animation
00:05
HD
Digital Concept of Real Estate Market with Keyboard and Percentage Sign, Showing Trends in Housing Prices and Economic Data Analysis Sigmoid
00:10
HD
New Arrivals Discount Offer Precision Quality Advertisement.
00:15
HD
Personal Expense Word Cloud
00:11
HD
Integration concept with connected business systems, seamless data flow, workflow automation and modern corporate technology infrastructure visualization.
00:12
HD
Graphic displaying financial market trends with an upward revenue arrow, currency investing hand, rising coins, and a downturn risk with a dollar sign decrease and warning flame
00:17
HD
Growth medium, text, word level concept. 4K video. on transparent background.
00:10
HD
Zigzag line with a downward arrow falling trend loss decline and negative business direction animation
00:06
HD
Selenium level indicator scale. Low normal & high meter infographic animation on black background. Showing high selenium level color gauge indicator for nutrition and antioxidant health monitoring.
00:10
HD
Minimalist Animated Graph Showing Business Growth and Decline
00:08
HD
Animation of business graph on black background. 4k video
00:10
HD
winrate level indicator scale. Low normal & high meter infographic animation. Showing high winrate level color gauge indicator. on a black background 4k animation video
00:10
HD
Arrow up business graph icon animation. Increasing business growth chart animation. Going up business graph concept.
00:07
HD
Sales funnel infographic showing lead conversion and cost reduction
00:06
HD
Animated text effect showing the phrase “PROFIT DECLINE,” with the word “DECLINE” in bold red. Represents business loss, financial downturn, or reduced earnings.
00:06
HD
Afghanistan Crude Oil Price Decline with Oil Barrels and Downward Green Arrow
00:11
HD
Bright white 3D number 2039 text animation floating against a deep black void offering a vibrant and modern visual for the year with a sense of digital energy.
00:10
HD
Guinea Oil Price Falling with Oil Barrels Downward Green Arrow and 3D Financial Data Visualization Graphs for Economy and Business Concept
00:11
HD
Three word kinetic typography sequence displaying Clients Who Repeat with sequential letter spacing reduction and sharp zoom transition
00:12
HD
White downward arrow for cost and upward arrow for with percentage symbols on a solid black background for business performance analysis
00:10
HD
Concentrated urine, a dark yellow to amber urinary fluid with elevated solute concentration, increased specific gravity, and reduced water content studied in renal and clinical physiology
00:06
HD
Glowing green neon continuous line forming up and down arrows isolated on black background, perfect for finance, trade, and data exchange concept.
00:10
HD
Red downward arrow and bar chart showing decline in business finance with economic downturn on desk, financial loss symbolized by downward graph in modern office environment
00:10
HD
Increase counting numbers 0 to 50k digital clock or timer display with decimal point.4k motion graphics video animation
00:10
HD
glowing neon Percentage growth and decline icon with up and down arrows. financial, business, and statistical analysis. Up and down percentage arrows icon.
00:10
HD
Dynamic Line Graph Finance and Economy Animation.
00:20
HD
Finance fund stocks price increase and decrease charts arrow up and down, ticker display. table grid Stock exchange screen number with financial trade index rates
00:20
HD
Animated Bar Graph Data Visualization with Rising and Falling Columns on Grey Background
00:10
HD
Wellness level indicator scale. Low normal & high meter infographic animation on black background. Showing high wellness level color gauge indicator for health and lifestyle monitoring.
00:10
HD
Red Arrow Moving Downward on White Grid Background Representing Economic Recession or Financial Loss
00:08
HD
Zigzag line with a downward arrow falling trend loss decline and negative business direction animation
00:06
HD
climate justice level indicator scale. Low normal & high meter infographic animation. Showing high climate justice level color gauge indicator. on a black background 4k animation video
00:10
HD
Asian business team discussion reusable product in office,start up eco-friendly business,environmental protection,sustainable business model,ESG strategy,team meeting,people work at home concept
00:15
HD