암호 설정을 위한 링크가 다음으로 전송됨: 나중에 구매 기능을 이용하려면 암호가 필요합니다.
무제한 다운로드와 강력한 AI 편집 기능으로 제약 없이 창작해 보세요
새 필터 추가됨
정렬 기준

비디오에서 decrease arrow에 관한 13,054개 결과

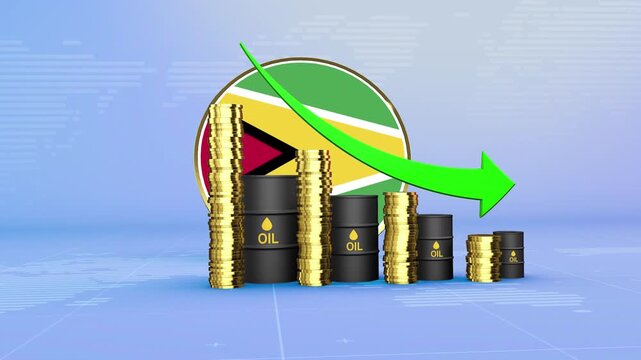
Guyana Oil Prices Decline with Oil Barrels, Gold Coins and Downward Green Arrow, 3D Economic and Financial Market Concept
00:11
HD
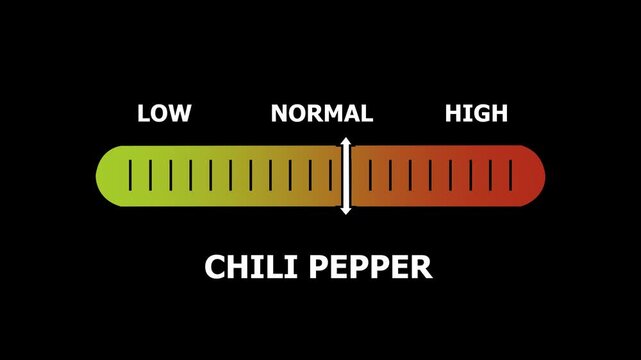
chili pepper level indicator scale. Low normal & high meter infographic animation. Showing high chili pepper level color gauge indicator. on a black background 4k animation video
00:10
HD
Project failure concept featuring a declining bar chart and downward arrow. Suitable for business loss, poor performance, financial decline, and project risk concepts.
00:10
HD
Animation of up and down business graph icon. business or finance loss concept icon diagrams showing a steady increase in profits. future target suitable for business development direction
00:06
HD
A colorful gauge COMPLIANCE' with a needle pointing towards the middle indicating a medium level of adherence to rules or standards against a stark black background. compliance text or word...
00:10
HD
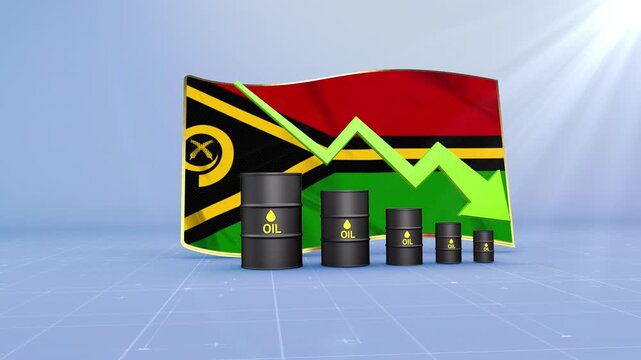
Vanuatu Oil Price Falling with Oil Barrels Downward Green Arrow and 3D Financial Data Visualization Graphs for Economy and Business Concept
00:11
HD
Recession trends on a digital display screen showing global business decline and negative financial performance for annual reports
00:15
HD
Abstract increase icon on green background. Dollar rate up looped icon. Reduce costs sign and symbol. 4k video animation
00:06
HD
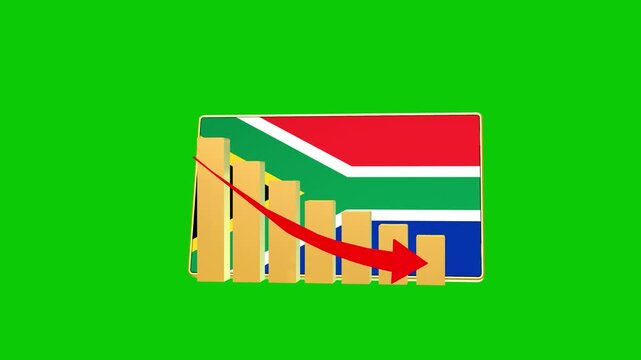
South Africa economic bar chart graph showing decreasing downturn with national Flag 3D animation on black background.
00:16
HD
Bright green neon line showing a downward trend bar chart with a dollar coin symbol and a downward pointing arrow on a black background
00:10
HD
Dollar price declining, man with a magnifying glass, recession inflation concept
00:11
HD
Business decline graph animation financial market downtrend
00:06
HD
Business decline bar chart animation with falling line graph and shadow effects on transparent background. Indicate revenue decline, financial loss, negative growth
00:06
HD
A neon yellow clipboard displays gold bars with a downward pointing arrow and the word GOLD
00:08
HD
Financial professional assisting clients in minimizing currency exchange costs, symbolizing cheaper international money transfers and optimizing transaction strategies for better value
00:17
HD
Fire danger level indicator scale. Low normal & high meter infographic animation on black background. Showing high fire danger level color gauge indicator for safety and risk monitoring.
00:10
HD
Abstract decrease icon on white background. Rupee rate down looped icon.black reduce costs sign and symbol.rupee icon
00:08
HD
Neon Blue Bar Chart Falling Down with Dollar Sign and Arrow
00:10
HD
Financial Decline: Oil Market Instability and Economic Crisis
00:05
HD
Vertical red bar on both side features downward pointing arrow animation isolated on black background
00:07
HD
Ivory Coast Oil Prices Decline with Oil Barrels, Gold Coins and Downward Green Arrow, 3D Economic and Financial Market Concept
00:11
HD
decreasing bar chart animation with downward arrow loop footage
00:06
HD
Minimalist outline animation of eco friendly reusable bag fabric packaging loop arrows icon drawing on and fading out. Features a clean pop up style in 3 color setups.
00:12
HD
Collaborative Effort to Solve Housing Market Challenges with Puzzle Pieces and Graph Indicators of Declining Trends in Real Estate Sigmoid
00:15
HD
Flat Design Infographic Illustrating Birth Rate Decline Using Descending Bar Chart and Colorful Baby Symbols,with Downward Arrow.  Demographics, Population Change, Fertility Statistics
00:05
HD
Oman Oil Price Falling with Oil Barrels Downward Green Arrow and 3D Financial Data Visualization Graphs for Economy and Business Concept
00:11
HD
An electronic monitor showcasing low financial growth trends and negative returns for corporate market analysis presentations
00:15
HD
Down arrow business graph chart animation. Loss business graph icon animation. Going down graph chart animation 4k animation on white background
00:08
HD
Neon line CO2 atmosphere build-up, climate change CO2 reduction needed concept. Alpha included CO2 Emission Reduction Cloud Icon with Arrows and Label
00:10
HD
Downward moving animated curved arrow in violet colour
00:15
HD
Abstract increase icon on green background. Dollar rate up looped icon. Reduce costs sign and symbol. 4k video animation
00:10
HD
Speedometer icon animation with green circular gauge. Speedometer icon data monitoring. Speedometer icon interface graphic on black.
00:12
HD
Abstract neon business graph.business decrease Bar chart growth analysis with upward trend projection sand market trends.
00:10
HD
3D Business Statistics Bar Chart with Downward Arrow Showing Financial Decline, Falling Revenue, Market Loss and Negative Growth Data Visualization on Green Screen
00:05
HD
Business administration is tracking and monitoring expenses, analyzing financial data with a calendar, and managing budgeting processes for effective financial control
00:17
HD
A simple animated bold red downward arrow icon on a vibrant green screen, indicating download or drop.
00:12
HD
Glowing graph with upward arrow labeled "QUALITY" and downward arrow labeled "COST" on a dark background. Symbol of business strategy, pricing, production, efficiency, and trade-off between quality
00:10
HD
Hand gesture shows cost reduction. Person in blue shirt over wooden table. Arrow points down with cost percent text. Ideal for financial presentations
00:05
HD
99 Percent Business Loss Counter Animation from 0 to -99 with Down Arrow Indicator in 4K, Negative Growth, Financial Decline, Revenue Drop and Market Performance Motion Graphic, -99% on Transparent
00:07
HD
Gold Euro Coin Value Decrease Down Arrow Animation on Navy Blue Background for European Finance Crash
00:12
HD
Bahamas Crude Oil Price Decline with Oil Barrels and Downward Green Arrow
00:11
HD
life expectancy level indicator scale. Low normal & high meter infographic animation. Showing high life expectancy level color gauge indicator. on a black background 4k animation video
00:10
HD
A yellow neon outline depicts a gear puzzle pieces a bar graph and a downward arrow against a black backdrop
00:08
HD
Animated Calculator with Money Bag and Cash Stacks - Transparent
00:10
HD
Zinc level indicator scale. Low normal & high meter infographic animation on black background. Showing high zinc level color gauge indicator for nutrition and immune health monitoring
00:10
HD
Denmark Oil Price Falling with Oil Barrels Downward Green Arrow and 3D Financial Data Visualization Graphs for Economy and Business Concept
00:11
HD
White chalk down arrow doodle on textured green background
00:08
HD
Falling Bar Chart Icon with Downward Arrow on Green Screen
00:10
HD
Business growth concept in graph chart animation on black background. Statistics bars columns growth, positive increase chart. Increase graph icon suitable for business and finance concepts
00:08
HD
Hippiness Meter Animation.Measuring Hippiness from Low to High Levels.Increasing and Decreasing Gauge from low to high Levels, Comparison Indicator for  perfomance,Data Visualization
00:10
HD
Focus level indicator scale. Low normal high meter infographic animation on black background. Showing high focus level color gauge indicator.
00:10
HD
Dynamic Real Estate Mortgage Rate Alert Notification Looping Animation
00:05
HD
Arrow pointing downwards showing Stock market crisis. Stock market crash.Stock market decline. Financial crisis. Arrow of decreasing economy on the graph.
00:10
HD
3D Business Statistics Bar Chart with Downward Arrow Showing Financial Decline, Falling Revenue, Market Loss and Negative Growth Data Visualization on Green Screen
00:05
HD
Engine rpm speed meter Performance speedometer concept Loop animation with Alpha Channel
00:10
HD
Business growth concept in graph chart showing marketing sales profit increasing to future target . growing business concept. Clean Hi-tech style technology chart
00:10
HD
Abstract graphic illustrating a continuous downward trend, featuring a decreasing bar chart, diagonal line, and multiple descending arrows, symbolizing reduction
00:05
HD
Cost wording on decrease money with down arrow. Cost Management, Economy recession, low budget, Effective business, black 4k
00:10
HD
Food additive level indicator scale. Low normal high meter infographic animation on black background. Showing high food additive level color gauge indicator for nutrition and food safety monitoring.
00:10
HD
White outline of a shopping bag with a recycling symbol on a black background
00:06
HD
Georgia Oil Prices Decline with Oil Barrels, Gold Coins and Downward Green Arrow, 3D Economic and Financial Market Concept
00:11
HD
fire danger level indicator scale. Low normal & high meter infographic animation. Showing high fire danger level color gauge indicator. on a white background 4k animation video
00:10
HD
Darkened newspaper headlines announce financial crisis fears
00:15
HD
Minimal flat illustration of an orange human icon with a dollar symbol and a downward arrow, representing income decrease, salary reduction, financial loss, expense growth, or business decline on
00:10
HD
Ammonia level indicator scale. Low normal & high meter infographic animation on black background. Showing high ammonia level color gauge indicator for air quality and chemical safety monitoring.
00:10
HD
Andorra Crude Oil Price Drop with Oil Barrels Downward Green Arrow and 3D Financial Data Visualization Graphs for Economy and Business Concept
00:11
HD
Financial Market Crash and Economic Recession Animation with Falling Graph and Money Bag
00:10
HD
Business decline bar chart animation with falling line graph and shadow effects on transparent background. Indicate revenue decline, financial loss, negative growth
00:06
HD
Financial planning showing secure budgeting, expense tracking, and strategic analysis for business optimization and fiscal responsibility
00:17
HD
Animated insulin level meter decreasing from normal to low level. low insulin, hormone imbalance and diabetes
00:07
HD
Abstract increase icon on green background. Dollar rate up looped icon. Reduce costs sign and symbol. 4k video animation
00:06
HD
financial loss and market downturn concept video,bearish market trend financial analysis,business decline financial loss market downturn graph chart concept 4k vbideo.
00:10
HD
Glowing neon line of dollar sign icon. Dollar rate decrease icon animation . Money symbol with stretching arrow down. Rising prices. Business cost sale icon.
00:10
HD
Dynamic power scale gauge animation with moving needle indicating performance levels and progress metrics
00:07
HD
A computer screen displaying the text “Profit and Loss” and illustrations of gears
00:12
HD
Rising Falling Graph Animation Green Screen
00:06
HD
A decline button and a downward red arrow animation on a green screen background.
00:15
HD
Negative business outcomes tracked on a computer interface to help investors evaluate asset value shifts and profit drops
00:15
HD
Laptop Screen Displays Falling Coins and Downward Arrow Icon.
00:08
HD
Digital bar chart lines compare market volatility trends using dual arrows. Financial analysis software modules look crisp across this grid monitor bar chart framework. Data charts update.
00:10
HD
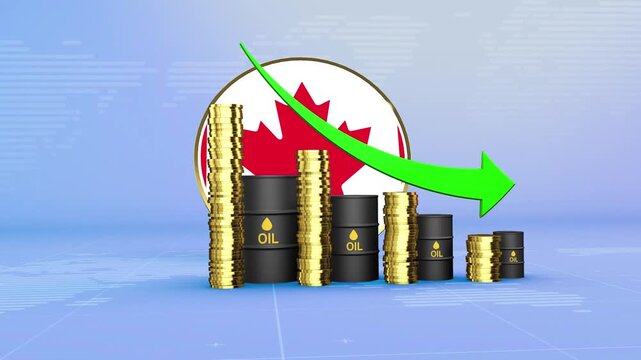
Canada Oil Prices Decline with Oil Barrels, Gold Coins and Downward Green Arrow, 3D Economic and Financial Market Concept
00:11
HD
Business loss falling down with dollar icon, black background. financial graph chart. Financial crisis and dollar loss diagram with downfall arrow. motion graphic video..
00:10
HD
Price reduced. Contour drawing business text animation with arrow, direction. Continuous line word. Isolated message on white. Video 4k object illustration self-drawing. Minimalist continuous line dra
00:07
HD
Happiness level indicator scale. Low normal & high meter infographic animation on black background. Showing high happiness level color gauge indicator for emotional well-being and mental health.
00:10
HD
Carbon dioxide indicator scale. Low Normal High meter infographic animation on black background. Showing high carbon dioxide level color gauge indicator for air quality and environmental monitoring.
00:10
HD
Yemen Oil Price Falling with Oil Barrels Downward Green Arrow and 3D Financial Data Visualization Graphs for Economy and Business Concept
00:11
HD
Declining Online Store Sales Concept with Smartphone, Packages, Warning Sign and Downward Arrow
00:06
HD
Business decline bar chart animation with falling line graph and shadow effects on transparent background. Indicate revenue decline, financial loss, negative growth
00:06
HD
Capital market downturn exposure concept with financial charts, percentage symbol, dollar sign, falling arrows, and currency, reflecting investment risks and economic fluctuations
00:17
HD
Energy price fluctuations displayed on gas stove with dynamic graphics
00:15
HD
neon two direction arrow icon animated video
00:07
HD
C O2 Emissions Reduction Concept with Neon Cloud and Upward Trend Line from 2010 to 2040 co2 emissions
00:10
HD
Glowing neon line of dollar sign icon. Dollar rate decrease icon animation . Money symbol with stretching arrow down. Rising prices. Business cost sale icon.
00:10
HD
Animated price trend whit Bitcoin financial concept with two arrows  one up and one down. Suitable for cryptocurrency trends, financial market analysis, investments.
00:06
HD
Flat Black & White Download Icon Set – Vector Arrows, Buttons & Symbols for UI Design, Website Elements, Business Apps & Tech Communication Interfaces
00:10
HD
Business efficiency concept, how much a company or organization can produce as it relates to time, cost and quality. Businessman shows animated workflow efficiency icon on virtual screen.
00:15
HD
Negative chart graph animation, red arrow is making a downfall on a grid background, dollar coin, bag
00:05
HD
Blue Hand Drawn Down Arrow Doodle Animation 4K - Sketch Style Decrease Download Indicator for Business Infographic Alpha Channel Motion
00:10
HD
Selenium level indicator scale. Low normal & high meter infographic animation on black background. Showing high selenium level color gauge indicator .
00:10
HD
Animated lifesty compear Meter – Increasing and Decreasing Gauge from Good to Best Levels, Comparison Indicator for  Data Visualization,  perfomance, and Motion Graphic Reports
00:10
HD