암호 설정을 위한 링크가 다음으로 전송됨: 나중에 구매 기능을 이용하려면 암호가 필요합니다.
무제한 다운로드와 강력한 AI 편집 기능으로 제약 없이 창작해 보세요
새 필터 추가됨
정렬 기준

비디오에서 decrease arrow에 관한 13,054개 결과

Negative red line graph falling down due to low prices and market recession. Concept of crisis, crash, risk and economy danger. Downtrend dynamic chart of prices drop. 4k Motion graphic
00:10
HD
Innovation Meter Animation: Measure and Compare Innovation from Low to High Levels with Dynamic Increasing and Decreasing Gauge for Data Visualization, Performance, and Motion Graphics
00:10
HD
Iceland Oil Price Falling with Oil Barrels Downward Green Arrow and 3D Financial Data Visualization Graphs for Economy and Business Concept
00:11
HD
A downward trending graph line with petals falling across a blue backdrop
00:08
HD
Animated green down graph icon designed in flat icon style. Finance, Business Info graphic animation on black background. 4k video
00:10
HD
Falling Chart with Arrow Animation, Animated Financial Crisis Chart with Trend Line Graph, Down business graph icon animation on black background.footage of Graph showing fluctuate downward trend.4k
00:10
HD
Countdown Clock Motion Graphics with Smooth Time Reduction Visualization
00:12
HD
selective focus market decline warning with red negative indicators
00:05
HD
Decreasing financial costs for currency exchange and banking services, opportunities for saving money and improving financial efficiency
00:17
HD
trans fat level indicator scale. Low normal & high meter infographic animation. Showing high trans fat level color gauge indicator. on a white background 4k animation video
00:10
HD
nutrition score level indicator scale. Low normal high meter infographic animation on black background. Showing high pressure level color gauge indicator.4k quality animation video
00:10
HD
Belarus Oil Prices Decline with Oil Barrels, Gold Coins and Downward Green Arrow, 3D Economic and Financial Market Concept
00:11
HD
Bar chart graph data animation displays falling financial sales lines. Chart graph monthly performance grid features a downward trend arrow. Data animation layout loops perfectly for video.
00:12
HD
Line art success graph icon animation. Finance and business, Financial report. Financial analysis icon. Animated line growth and decrease diagram.
00:05
HD
Neon purple money bag with downward arrow icon symbolizing financial loss economic downturn
00:08
HD
Decrease in profit on a digital monitor showing steady financial decline for maintaining long term corporate budget adjustments
00:15
HD
Business decrease reporting. Business risk animation video
00:09
HD
Solar radiation level indicator scale. Low normal & high meter infographic animation on white background. Showing high solar radiation level color gauge indicator for weather and climate monitoring.
00:10
HD
Green bar graph animation dynamic stock market decline recession financial crisis data visualization. Dynamic green bar graph chart stock market decline financial crisis recession downward arrow.
00:06
HD
Purple Down Arrow Animation with Downward Directional Indicator Movement on Green Screen Chroma Key Seamless Loop Motion Graphics
00:10
HD
Reddish- Orange Neon Outline of Bar Chart with Upward Trend and Downward Arrow on Black Background graph
00:10
HD
Animated Goal Achievement Gauge: Visualize Goal Completion from Low to High Levels with Dynamic Meter, Comparison Metrics, Performance Insights, and Motion Animation
00:10
HD
Bahamas Crude Oil Price Drop with Oil Barrels Downward Green Arrow and 3D Financial Data Visualization Graphs for Economy and Business Concept
00:11
HD
Cloud with downward arrows line icon animation 4k video. Carbon emission reduction, air pollution, and environmental sustainability animated icons. Black and white icon with transparent background
00:08
HD
Red down arrow icon animation
00:05
HD
Animated dollar coins decreasing from a stack
00:10
HD
Businessmen crowd forming arrow shape pointing up, back view, hd, against Green Screen
00:30
HD
Financial Growth Line Graph with Dollar Symbol Business Profit Concept with on a white background,4k video animation.
00:10
HD
Business people collaborating and aiming for environmental sustainability goals, achieving zero emissions, and reducing carbon footprint through strategic planning and action
00:17
HD
battery level indicator scale. Low normal & high meter infographic animation. Showing high battery level color gauge indicator. on a black background 4k animation video
00:10
HD
Animated arrow bouncing slide to down
00:10
HD
Albania Crude Oil Price Decline with Oil Barrels and Downward Green Arrow
00:11
HD
Businesswoman's hand holding plastic bottle icons with arrows
00:10
HD
Graph going Up and Down sign with green and red arrows vector. Flat design vector illustration concept of sales bar chart symbol icon with arrow moving down and sales bar chart with arrow moving up.
00:10
HD
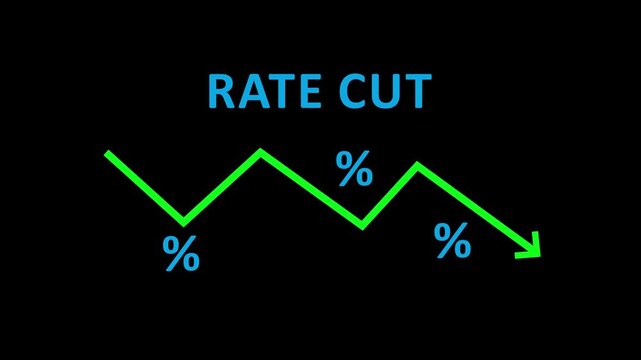
Rate cut graphic with downward trending green line and percentage symbols on black background interest rate
00:07
HD
Inflation indicators on a digital display screen showing rising economic pressure and capital purchasing drops
00:15
HD
Green recycling symbol with three arrows forming triangle for environmental sustainability and waste reduction, water drop purity and freshness white surface reflecting nature ecology and green
00:08
HD
Quality control and company cost reduction. Balancing Quality and Cost in Strategic Decision Making for Optimal Business Performance and Sustainability.4k video
00:10
HD
Red downward arrow and bar chart animation over cloudy sky background
00:15
HD
Businessman Using Digital Tablet to Analyze Real Estate Market Trends with House Icon and Percentage Decrease Symbol Against Abstract Background Sigmoid
00:10
HD
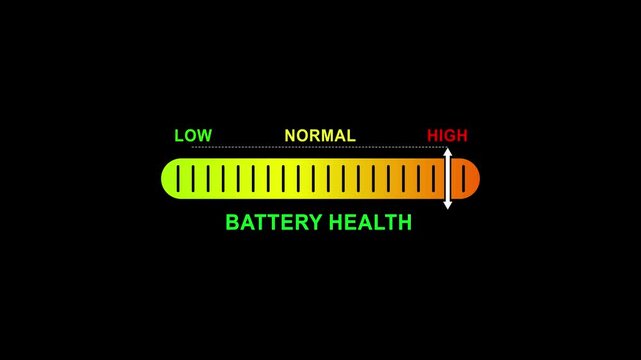
battery health level indicator scale. Low normal high meter infographic animation on black background. Showing high pressure level color gauge indicator.4k animation video
00:10
HD
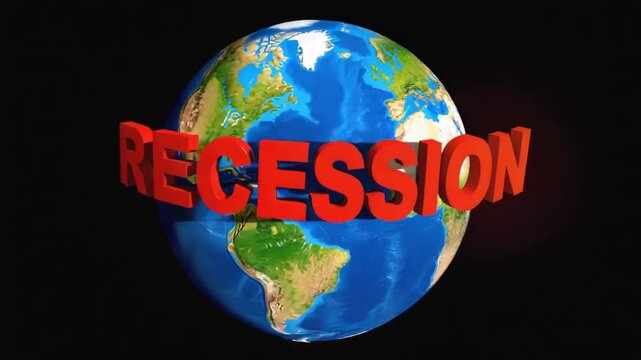
Recession in the world.
00:05
HD
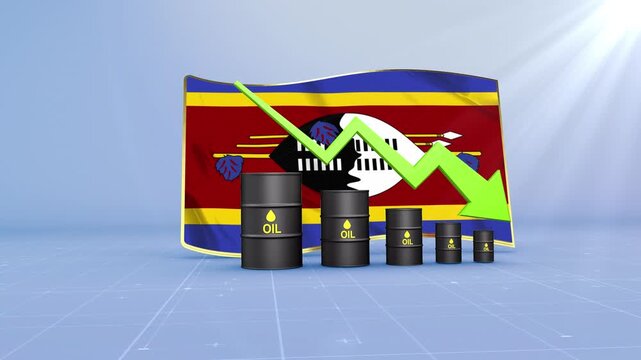
Swaziland Oil Price Falling with Oil Barrels Downward Green Arrow and 3D Financial Data Visualization Graphs for Economy and Business Concept
00:11
HD
Neon CO2 Reduction Animation on Dark Background, Glowing Carbon Dioxide Cloud with Downward Arrows, Environmental Sustainability Concept, Digital Eco-Friendly Motion Graphic for Climate Awareness
00:07
HD
Falling Silver Prices with Declining Silver Bars, Downward Arrow and Stock Market Graph
00:10
HD
Shiny purple 3d arrow icon pointing down next to a bar chart symbol representing financial decline or loss
00:05
HD
Falling Chart with Arrow Animation, Animated Financial Crisis Chart with Trend Line Graph, Down business graph icon animation on black background.footage of Graph showing fluctuate downward trend.4k
00:10
HD
Percentage growth and decline icon with up and down arrows. financial, business, and statistical analysis. Up and down percentage arrows icon. Perfect for reports and dashboards
00:06
HD
Global population decreasing consumption of natural resources, impacting industry and the environment by reducing the need for new materials and promoting sustainable practices
00:17
HD
probability level indicator scale. Low normal & high meter infographic animation. Showing high probability level color gauge indicator. on a white background 4k animation video
00:10
HD
A green leafy symbol with a triangle pointing to the right
00:07
HD
Niger Oil Prices Decline with Oil Barrels, Gold Coins and Downward Green Arrow, 3D Economic and Financial Market Concept
00:11
HD
Awareness level indicator scale. Low normal & high meter infographic animation on black background. Showing high awareness level color gauge indicator for knowledge, safety, and health monitoring.
00:10
HD
 Animated down graph icon designed in flat icon style, business or finance concept icon. Finance, Business Info graphic animation, Bar graph.
00:08
HD
Urgency level indicator scale. Low normal & high meter infographic animation on black background. Showing high urgency level color gauge indicator for task priority time management and workflow.
00:10
HD
Employee Efficiency Level Meter Animation: Measure and Display Efficiency from Low to High with Dynamic Increasing and Decreasing Gauge for Data Visualization, Performance, and Motion Graphics
00:10
HD
Reuse level indicator scale. Low Normal High meter infographic animation on black background. Showing high reuse level color gauge indicator.
00:10
HD
Neon business graph animation.
00:10
HD
Down Arrow Direction and Navigation Symbol Animation Green Screen Background. 4K Resolution
00:10
HD
Declining Bar Graph with Downward Arrow Representing Financial Loss and Economic Downturn.
00:11
HD
brand value level indicator scale. Low normal high meter infographic animation on black background. Showing high pressure level color gauge indicator.4k animation video
00:10
HD
Icon animation green download arrow pointing down on green rectangle, suitable for financial market analysis, stock market trends, and economic decline concept designs.
00:07
HD
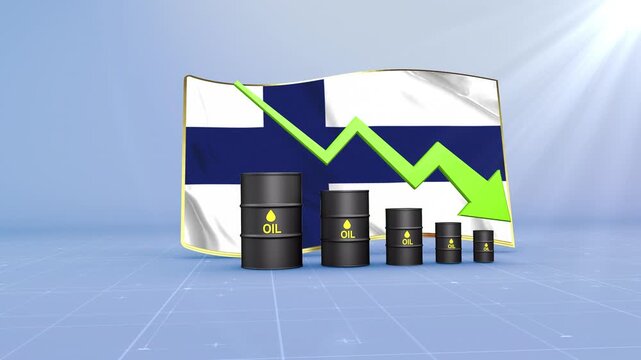
Finland Oil Price Falling with Oil Barrels Downward Green Arrow and 3D Financial Data Visualization Graphs for Economy and Business Concept
00:11
HD
Red bar chart going down motion graphic animation business decline problem income reduction
00:05
HD
Hands Typing on Keyboard with House Icon and Percentage Decrease Graphic Representing Real Estate Market Trends and Analysis Sigmoid
00:10
HD
Blue dotted arrow forming a loop pointing left, right, up and down constructed from dots
00:08
HD
Brain foganimation gauge meter transitioning from green low to red high, visualizing performance and health measurement indicators.
00:10
HD
Glowing neon line of dollar sign icon and up arrow
00:10
HD
Business process having financial risks, showing an operational challenge impacting profit, and the potential for a monetary decrease due to internal or external factors
00:17
HD
responsibility level indicator scale. Low normal & high meter infographic animation. Showing high responsibility level color gauge indicator. on a white background 4k animation video
00:10
HD
Downside financial exposure highlighted on a modern screen for professional risk management and economic tracking presentations
00:15
HD
Belgium Oil Prices Decline with Oil Barrels, Gold Coins and Downward Green Arrow, 3D Economic and Financial Market Concept
00:11
HD
two ways arrow icon animated video
00:07
HD
Red bar graph on green screen showing a downward trend with a falling arrow indicating loss.
00:15
HD
Animated down graph icon designed in flat icon style. Finance, Business Info graphic animation on black background. 4k video
00:10
HD
Nutrients Level Text or Word Low and Medium to High Meter Concept Animation on Black Background and Blue Screen
00:58
HD
Bright neon business money investment money currency profit up arrow animation with bar, dollar sign and percentage icon on black background
00:10
HD
 Motion Animation of a Stock Exchange Market. Financial Business Graph. Online exchange trading. Currency trading. 3d chart and indicators change. Profits and losses in trading of securities.
00:23
HD
Displays a yellow declining bar graph and a downward arrow animation
00:10
HD
A glowing neon pattern of multiple chevron arrows pointing to the right, aligned in a horizontal row. The arrows have a bright orange-gold neon glow on a dark background,
00:10
HD
data security level indicator scale. Low normal high meter infographic animation on black background. Showing high pressure level color gauge indicator.4k animation video
00:10
HD
Business profit and loss bar graph with arrow -transparent background. Animation of lines tracking and financial data processing on black background.
00:10
HD
Nauru Oil Price Falling with Oil Barrels Downward Green Arrow and 3D Financial Data Visualization Graphs for Economy and Business Concept
00:11
HD
Animation of declining bar graph with red arrow and data points in school
00:12
HD
Person Typing on Laptop with House Icon and Percentage Symbol Illustrating Real Estate and Market Trend Analysis Sigmoid
00:10
HD
Cost reduction concept. Cost wording on decrease money with down arrow. Cost Management, Economy recession, low budget, Effective business, Expense reduce on transparent background. animation. 4k
00:10
HD
2025 New year with percentage change to UP and Down arrow with piggy. Interest rate, GDP, stocks market, financial, deflation and Inflation, mortgage, debt, Loan and Economic Recession
00:08
HD
 Glowing neon icon on . arrow line continuous drawing art banner background design Neon line. Abstract neon done  arrow animation and black background .
00:10
HD
Merchandise loss concept decreasing business profits, inventory value erosion, financial decline, and theft risk impacting store operations and company assets
00:17
HD
water pollution level indicator scale. Low normal & high meter infographic animation. Showing high water pollution level color gauge indicator. on a white background 4k animation video
00:10
HD
Decreasing trend showing unsuccessful performance and losses failure due to economic crisis. Candles of stock market, price falls. Falling prices. Loss economic crisis
00:10
HD
Mauritius Oil Prices Decline with Oil Barrels, Gold Coins and Downward Green Arrow, 3D Economic and Financial Market Concept
00:11
HD
Pressure level indicator scale. Low normal high meter infographic animation on white background. Showing high pressure level color gauge indicator for health monitoring and safety analysis.
00:10
HD
A simple bar graph showing a downward trend, the graph is black and white and the bars are decreasing in height from left to right
00:09
HD
Decreasing Minimal Bar Charts, Financial Business Analytics, Performance, loss, falling, months data, motion graphic on a red classic abstract background
00:08
HD
Flat Icon Animation, Declining Graph Depicting Business or Financial Downturn
00:10
HD
Animated blue chart of financial decline with a trend line chart. Economic crisis, recession, decrease graph. Bar chart. Profit down. Vector illustration isolated on white background.
00:06
HD
A transparent green recycling symbol mockup on wooden product display podium with nature leaves background, Eco friendly
00:10
HD
Graph with decrease, financial collapse animation, inflation crisis, global economic recession chart, profit loss, business bankruptcy, world map in red background
00:08
HD
Cash flow Meter Animation.Measuring Cash flow from Low to High Levels.Increasing and Decreasing Gauge from low to high Levels, Comparison Indicator for Data Visualization, perfomance, and Motion
00:10
HD