암호 설정을 위한 링크가 다음으로 전송됨: 나중에 구매 기능을 이용하려면 암호가 필요합니다.
무제한 다운로드와 강력한 AI 편집 기능으로 제약 없이 창작해 보세요
새 필터 추가됨
정렬 기준

비디오에서 chart pattern forex에 관한 1,949개 결과

Digital candlestick financial chart displaying market trend fluctuations
00:05
HD
Lines and bars represent stock prices over time. Numbers indicate values while patterns show fluctuations in the market. This data is part of financial analysis.
00:10
HD
Abstract Digital Financial Trading Chart with Candlestick Patterns and Moving Average Lines on Dark Background
00:20
HD
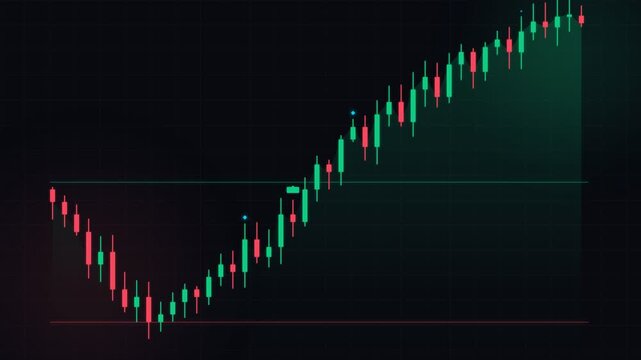
Animated stock trading candlestick chart featuring a classic 'Triple Bottom' tap and rebound pattern with a strong breakout, green bullish and red bearish candles, dynamic market line wave, and smooth

00:10
HD
Digital stock market chart showing fluctuating green and red candlestick patterns on a dark blue background to represent financial trading trends and volatility for global investment analysis.
00:10
HD
Abstract financial chart with candlestick patterns and moving averages on a dark background.
00:15
HD
Global stock exchange chart and graph showing upward growth trend with rising index and revenue report on digital screen, financial investment strategy corporate network fund
00:20
HD
Digital financial trading chart with candlestick patterns and trend lines on a dark blue background
00:10
HD
Animating Candlestick Chart Displaying Evolving Financial Market Data for Analysis
00:10
HD
Candlestick chart visualizing financial market trends, investment patterns, price fluctuations, and trading strategy in capital and digital asset markets Marrow
00:10
HD
Financial Trading Charts: Candlestick Patterns, Volume Analysis, and Market Trends on Dark Background
00:15
HD
Financial stock market chart with moving candlestick patterns on a dark blue digital interface.
00:10
HD
Closeup of a digital tablet displaying a financial stock market trading chart with candlestick patterns and technical analysis indicators
00:12
HD
Green candlestick chart rising uptrend stock market seamless loop 4K
00:20
HD
Candlestick patterns on vibrant stock trading charts. Perfect for financial market analysis presentations, educational materials, and web articles.
00:08
HD
Morning star three candle pattern forming after downtrend, bullish reversal signal
00:08
HD
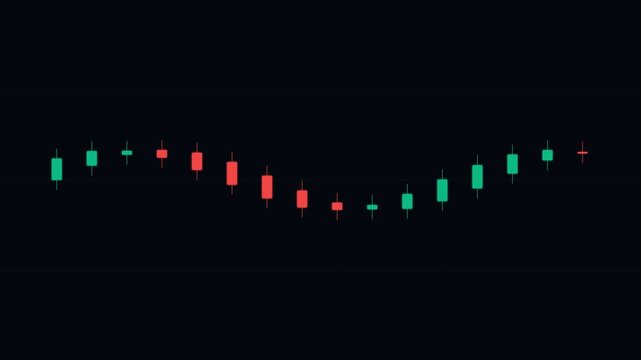
A financial stock market candlestick chart showing a cyclical wave pattern with green and red bars against a dark background
00:10
HD
Digital financial candlestick chart displaying market trends, stock trading analysis, investment data and economic forecast
00:07
HD
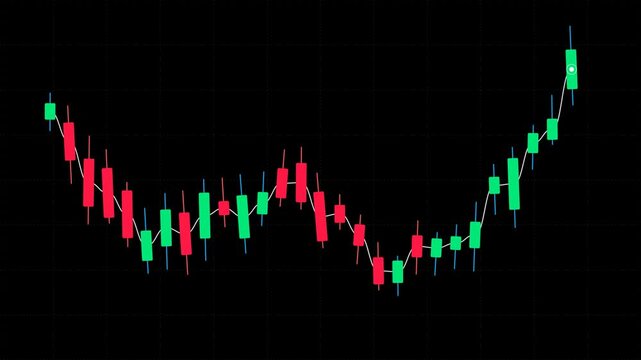
Minimalist financial candlestick chart pattern isolated on a black background
00:10
HD
Financial market chart with candlesticks and line graph, Abstract financial chart with candlestick bars and line graphs market analysis growth and data trends animation
00:10
HD
Financial trading chart showing bearish candlestick pattern
00:10
HD
Financial stock market chart showing a strong bullish uptrend with green candlestick patterns on a dark digital interface

00:12
HD
Digital Financial Trading Chart with Red and Green Candlestick Patterns on Dark Blue Background
00:10
HD
Stock market data visualization showing green rising and red falling line graphs representing financial fluctuations on digital interface screen with candlestick chart patterns
00:08
HD
Abstract financial chart with moving averages
00:15
HD
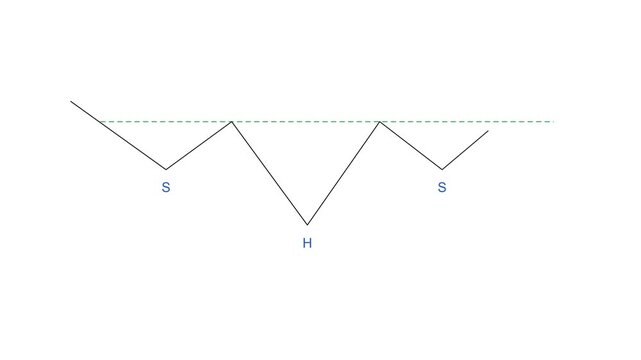
Animated stock trading candlestick chart featuring a double-dip accumulation into a dramatic parabolic breakout wave, green bullish and red bearish candles, dynamic market line wave, and smooth entry
00:10
HD
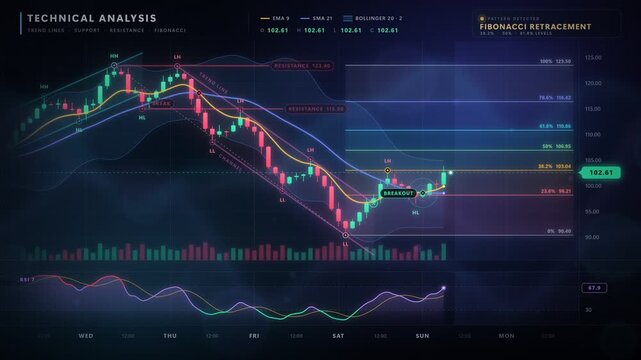
Technical Analysis Candlestick Chart With Trend Lines Support Resistance And Fibonacci Retracement
00:15
HD
Candlestick Chart Rising and Falling on Dark Background - Stock Market Trading Animation
00:10
HD
Abstract forex data visualization with glowing particles neon lines and financial chart wave.
00:09
HD
Candlestick chart visualizing financial market trends, investment patterns, price fluctuations, and trading strategy in capital and digital asset markets Marrow
00:10
HD
Stock Market Candlestick Chart Showing Price Movements on a Dark Trading Screen
00:09
HD
Abstract minimalist financial candlestick chart pattern forming upward trend on dark textured background, representing growth and investment
00:06
HD
Stock Market Candlestick Chart Animation With Glowing Neon Bullish Trend Line And Financial Data On Dark Background
00:09
HD
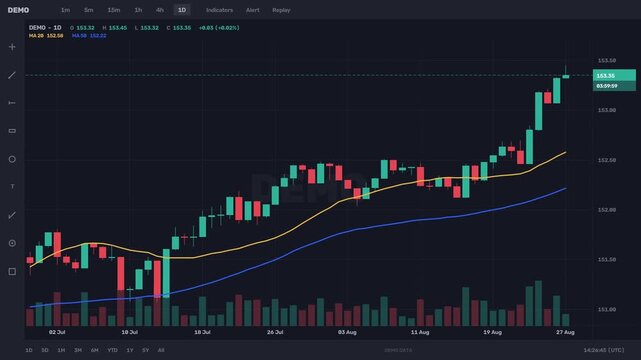
Trading terminal screen candlestick chart with moving average lines seamless loop 4K
00:20
HD
Double Bottom W Technical Line Chart Pattern Neckline Breakout Reversal Animation 10 Seconds Loop in 4K UHD
00:10
HD
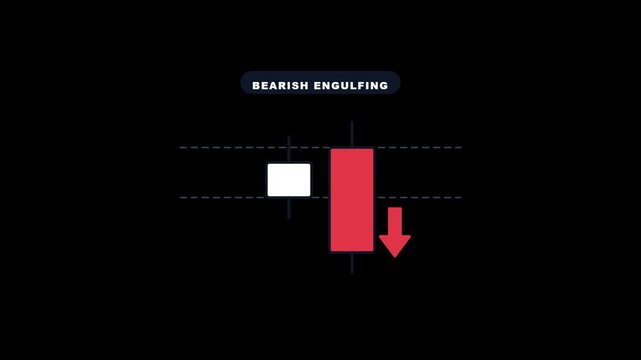
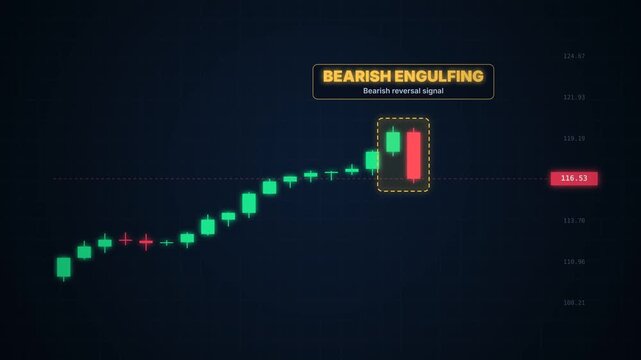
Bearish engulfing candlestick pattern forming after uptrend, bearish reversal signal
00:08
HD
A graphic illustration of a head and shoulders chart pattern used in technical analysis of financial markets, showing price peaks above a trend line.
00:10
HD
Financial stock market chart with glowing trend lines, candlestick patterns, and data analysis elements
00:07
HD
Glowing neon business graph arrow illustrates saw pattern animation. Rising neon colored line graph showing upward trend in stock market. business chart growth concept black background..
00:06
HD
Financial market chart with candlesticks and line graph, Abstract financial chart with candlestick bars and line graphs market analysis growth and data trends animation
00:10
HD
Positive investing result makes a happy woman celebrate while reviewing a financial trading platform and candlestick chart on her laptop from the urban park, after a successful currency trade.
00:20
HD
Financial trading candlestick charts showing price action on black
00:08
HD
Abstract Digital Financial Trading Chart with Candlestick Patterns and Data Visualization on Dark Purple Background
00:20
HD
Multi screen interface showcasing dynamic financial analytic graphs and wave patterns on dark background. Ideal for fintech and stock market analysis.
00:08
HD
Abstract financial stock market chart animation
00:15
HD
Animated stock trading candlestick chart featuring a classic 'M' pattern or double top reversal that builds exhaustive resistance and finishes with an explosive bearish breakdown, green bullish
00:10
HD
Abstract financial graph with red and green candles fluctuating line dark background
00:05
HD
Capturing the dynamic movement of stock market trends, this video showcases vibrant charts with colorful candlestick patterns, ideal for illustrating financial data analysis tools.
00:10
HD
Traders monitor the volatile fluctuations of financial markets by observing shifting candlestick patterns displayed on a digital screen to assess global economic performance during active
00:15
HD
Team Collaboration in Stock Market Analysis with Hands Joining Over Financial Charts and Graphs for Investment Strategy Success. Entropy.
00:15
HD
Neon Yellow Candlestick Pattern Stock Chart with Numbers Loop 4K
00:13
HD
Trading chart animation showing green and red candlesticks with a rising blue trendline on white background. Stock market growth concept. Trading chart animation for business presentation.
00:05
HD
Stock Market Financial Graph with World Map Background, Global Business Forex Trading Candlestick Chart, Abstract Economic Data Growth Motion Graphic
00:23
HD
Red candlestick chart falling downtrend stock market seamless loop 4K
00:20
HD
Triple Top M Technical Line Chart Pattern Support Breakdown Bearish Crash Animation 10 Seconds Loop in 4K UHD
00:10
HD
Candlestick chart breaking above resistance line, stock price breakout rally
00:12
HD
A minimalist illustration of a downward sloping red trendline with small red and green candlestick chart patterns aligned along it on a white .
00:10
HD
Neon light effect animation of a wrench and hammer icon, indicating repair or replacement. Blue bars rise, forming an upward graphic line.
00:10
HD
Financial candlestick chart rising in slow motion, green trading analytics motion graphic
00:10
HD
Financial market chart with candlesticks and line graph, Abstract financial chart with candlestick bars and line graphs market analysis growth and data trends animation
00:10
HD
Digital holographic financial head and shoulders chart pattern
00:10
HD
Digital financial trading chart with candlestick patterns and data analytics
00:10
HD
financial trading chart displaying candlestick patterns and moving averages on screen
00:10
HD
Cheerful man celebrates positive market results on his laptop, reviewing a candlestick chart and trading platform while investing from an urban park.
00:14
HD
Bearish engulfing candlestick pattern with red down arrow on black chart
00:05
HD
Animated stock trading candlestick chart featuring a sudden market drop, intense red bearish candles, accelerating selloff crash wave, and smooth entry/exit transitions on a black background.
00:10
HD
Red financial candlestick market chart patterns with horizontal trend lines for technical analysis. Suitable for financial analysis presentations, stock market articles.
00:10
HD
Bull flag chart pattern formation showing breakout phases
00:08
HD
A financial chart demonstrates a V shaped market recovery as bullish candlestick patterns indicate rising asset prices during an intense trading session within the global stock exchange platform
00:15
HD
Candlestick chart visualizing financial market trends, investment patterns, price fluctuations, and trading strategy in capital and digital asset markets Marrow
00:10
HD
Global stock exchange chart and graph showing upward growth trend with rising index and revenue report on digital screen, financial investment strategy corporate network fund
00:20
HD
4K Ultra HD Financial trading chart with candlestick patterns and data analytics on a digital screen in a modern office environment video
00:10
HD
Digital pound sterling finance chart analysis, business data dashboard, currency market growth, trade profit, tech interface
00:07
HD
Financial stock market chart showing growth with candlestick patterns animated against glowing neon background
00:14
HD
Abstract Digital Financial Trading Chart with Glowing Candlestick Patterns on Dark Futuristic Background
00:20
HD
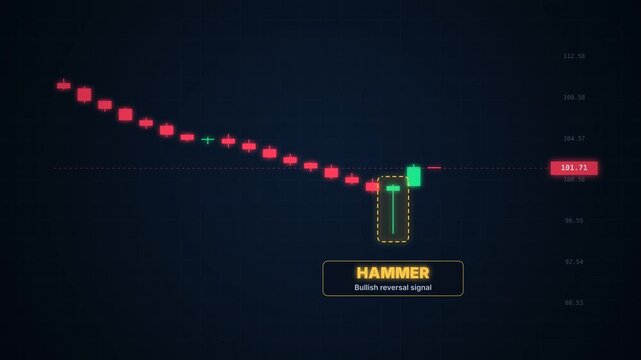
Hammer candlestick pattern forming at bottom of downtrend, bullish reversal signal
00:08
HD
A digital financial chart featuring rising blue candlestick patterns on a dark blue gradient , overlaid with fluctuating line graphs.
00:10
HD
Close-up of a financial chart with red and green candlesticks on a dark background with a grid pattern, conveying a sense of market trends and trading activity
00:10
HD
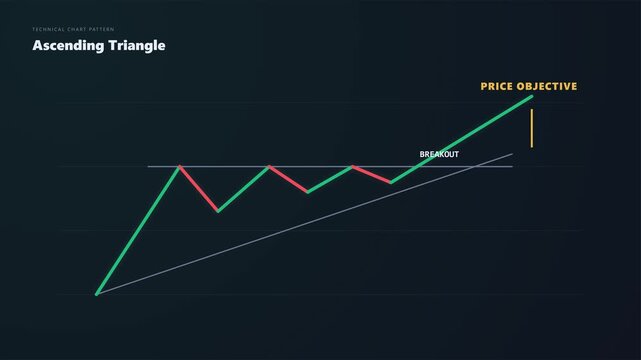
Ascending Triangle Pattern for stock and trading technical analysis
00:06
HD
Financial market chart with candlesticks and line graph, Abstract financial chart with candlestick bars and line graphs market analysis growth and data trends animation
00:10
HD
Double Bottom W Technical Line Chart Pattern Neckline Breakout Reversal Animation 10 Seconds Loop in 4K UHD
00:10
HD
Financial stock market chart with glowing candlestick patterns and bullish trend lines, ideal for trading analysis and digital investment strategy
00:07
HD
Financial trading chart with candlestick patterns and wave lines moving across a red background
00:06
HD
Futuristic financial stock chart with glowing blue and red candlestick patterns on dark grid screen, representing market analysis and crypto investment strategies for fintech app designs, trading
00:10
HD
Abstract financial chart with bullish candlestick patterns on white digital background.
00:15
HD
Animated stock trading candlestick chart featuring dynamic trend shifts, distinct price movement waves, green bullish and red bearish candles, animated market line wave, and smooth entry and exit
00:10
HD
Modern pill-shaped button labeled ai generate with futuristic design elements.ai generate dashboard with charts and graphs for artificial intelligence analysis and insights.4k motion video
00:10
HD
Abstract financial trading chart with candlestick patterns and glowing trend lines, representing market analysis, stock exchange data, and digital investment growth visualization
00:10
HD
Glowing candlestick chart with bright lines in digital style on dark grid background, concept of finance and trading
00:10
HD
Candlestick chart visualizing financial market trends, investment patterns, price fluctuations, and trading strategy in capital and digital asset markets Marrow
00:10
HD
Global stock exchange chart and graph showing upward growth trend with rising index and revenue report on digital screen, financial investment strategy corporate network fund
00:20
HD
Digital stock market chart showing financial data trends with red and blue candlesticks and moving average lines for trading analysis and investment growth
00:10
HD
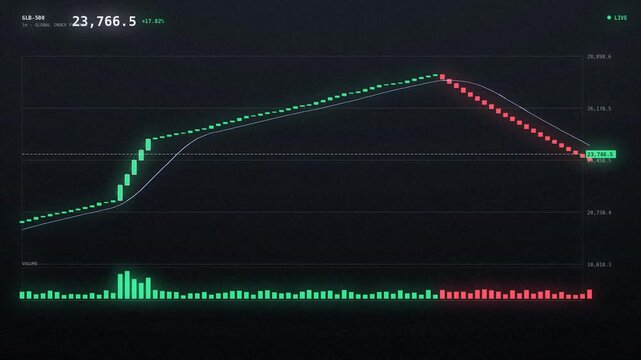
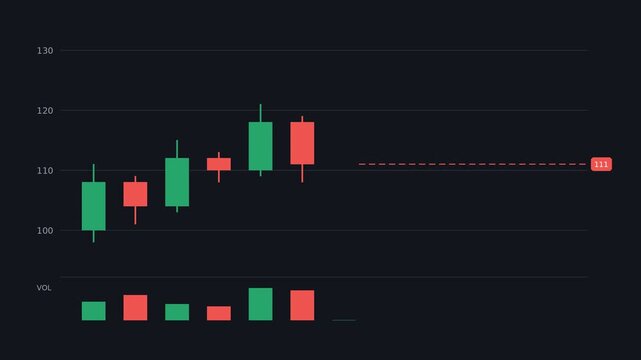
Scrolling trading candlestick chart with a moving average line and volume bars
00:20
HD
Abstract stock market forex trading graph and candlestick chart suitable for financial investment concept, economy trends background for business idea and digital artwork design Generative AI
00:14
HD
gold bar with gold coins with investment chart upward trend background
00:10
HD
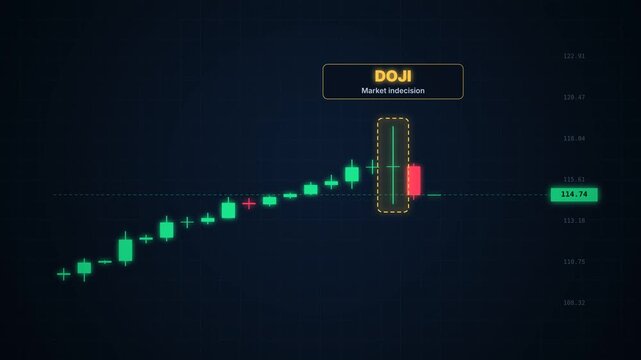
Doji candlestick pattern forming after uptrend, market indecision and trend reversal
00:08
HD
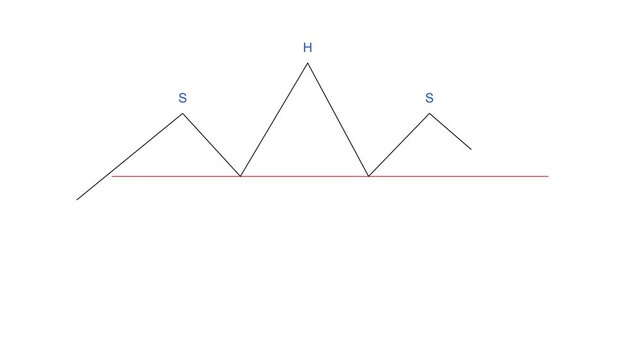
A minimalist line drawing representing a head and shoulders chart pattern used in financial technical analysis, featuring two shoulders, a head, and a neckline.
00:10
HD
Futuristic 3d, stock market or finance data with light pattern chart design for forex data, cryptocurrency or money trading. Zoom of abstract global investment, future economy growth or app dashboard
00:06
HD
financial trading chart with candlestick patterns fluctuating on a digital display screen
00:10
HD
Financial market chart with candlesticks and line graph, Abstract financial chart with candlestick bars and line graphs market analysis growth and data trends animation
00:10
HD