암호 설정을 위한 링크가 다음으로 전송됨: 나중에 구매 기능을 이용하려면 암호가 필요합니다.
무제한 다운로드와 강력한 AI 편집 기능으로 제약 없이 창작해 보세요
새 필터 추가됨
정렬 기준

비디오에서 chart analysis에 관한 788,772개 결과

Animated stock market chart on a black background.
00:30
HD
Blue heart rate abstract digital background with glowing tech effects
00:08
HD
Stock market ticker terminal screen showing multiple live trading graphs and financial charts
00:30
HD
Couple budget planning on finance dashboard online. They review savings and monthly expenses on a computer at home using charts analytics for smarter choices. Clear concept of home finance teamwork
00:08
HD
Hands typing on laptop with data charts and security icons overlay showing analysis, statistics, and technology insights in a dark modern workspace Gluon.
00:10
HD
Zoom Out Top Down View: Diverse Team Of Business Professionals With Laptops Entering The Conference Room And Sitting Behind Table To Discuss Financial Data And Project Mindmap in Corporate Office.
00:07
HD
Abstract financial chart with glowing digital candlestick data points moving across dark screen representing stock market volatility investment analysis business growth and economic trends.
00:10
HD
Close-up of financial charts displaying stock market data on a digital screen. Dynamic red and green graphs represent fluctuating stock prices in a modern trading environment.
00:10
HD
Abstract digital candlestick chart with global financial data background, perfect for trading, forex, crypto, and investment presentations. Financial Investment Background. 3d Rendering.
00:20
HD
Finance growth chart graph stock market upward data analysis business abstract background with rising green line over bar graph showing market trend investment statistic concept digital chart
00:10
HD
Stock market candlestick chart hologram on digital world map,global financial index analysis,business economy investment.Global market analysis world map with stock market graph overlay animation
00:15
HD
Business colleagues collaborating on a financial report using a digital tablet and computer in a modern office at night
00:16
HD
Dynamic stock market chart with candlestick patterns and real-time financial data on a digital screen ideal for illustrating investment trading and economic analysis
00:08
HD
Business profit income and capital charts and graphs diagram seamless and loopable concept
00:16
HD
Animation of a glowing financial bar chart overlay on a black background. Digital trading dashboard UI element, stock market revenue and business growth concept.
00:10
HD
Arrow up trend chart stock exchange asset, diagram investment capital gain world money economic growth, financial graph chart, market report
00:20
HD
Business team meeting at office desk analyzing charts and financial reports, hands using calculator and tablet for planning and strategy.
00:13
HD
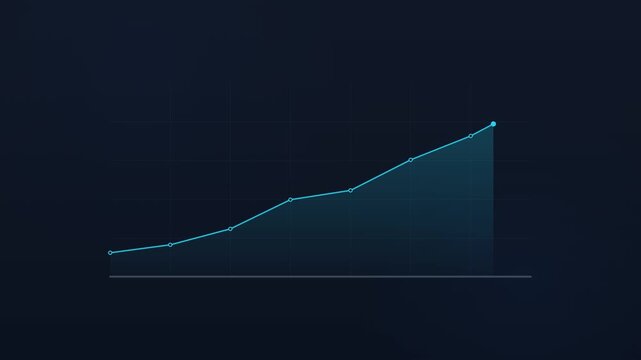
Animated horizontal line chart with glowing area fill showing positive business growth trajectory on dark background
00:08
HD
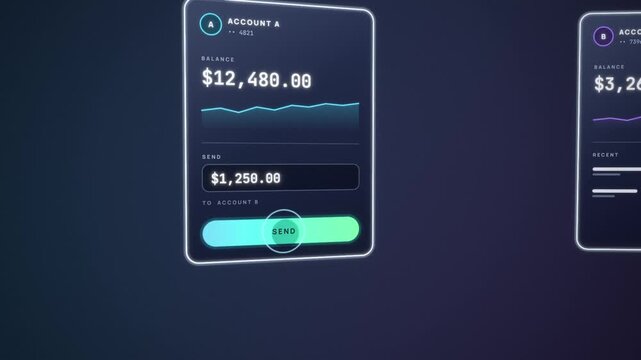
Money transfer animation between two account cards, balances update and green sent checkmark appears
00:14
HD
Business growth concept in allusive graph chart showing marketing sales profit increasing to target . Excellent financial status of corporate business rise up.4k animation video graph
00:10
HD
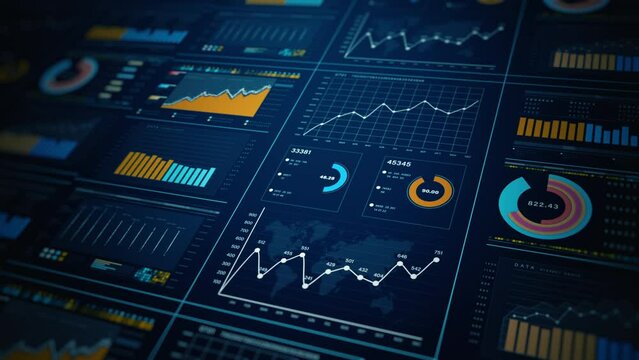
Advanced data analytics dashboard display. Business and financial investment. HUD infographic of financial. Information reports of business strategy for investment. Technology data analysis.
00:25
HD
Org Chart Hierarchy Tree Diagram Growing From Root With Nodes Lighting In Sequence, Seamless Loop in bright emerald tones
00:10
HD
Team, people and computer screen on stock market for trading with discussion on trends and reading data analysis at night. Business, professional broker and strategy with IPO chart and profit growth
00:05
HD
Elegant woman and her colleagues working in office, top-management of company. Contemporary empowered women, career in old age, active life and work, senior ladies in boardroom, female professionals
00:07
HD
Business Stats On Computer Screen
Technology textured business and market data analysis and reports with infographics layout bar stats charts and diagrams
00:14
HD
GDP growth economic indicator chart with rising bar graphs and HUD radar
00:15
HD
Business team discussing financial charts and data on a digital tablet during a meeting in a modern office corporate strategy, and teamwork.
00:19
HD
Bull market chart analysis with increasing bar graph,candlestick chart,and upward trend lines
00:07
HD
Diverse Professionals Working on Business Statistics and Marketing Plans in Corporate Office. Top Down View Of Discussion and Financial Data Analysis on Laptops and Charts. Teamwork And Innovation.
00:19
HD
A man sitting at a desk in front of multiple computer screens displaying various graphs and charts, analyzing financial data or technical information.
00:05
HD
Declining bar chart with downward trend, Blue bar chart with falling line graph decline in business data, finance performance and analytics animation
00:07
HD
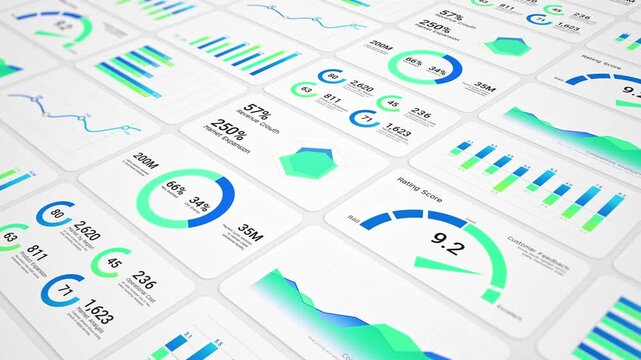
Modern Business Analytics Dashboard Animation with Multiple Data Visualization Panels like Charts, Graphs,  KPI Widgets, And Financial Statistics In A Clean Flat Design. Professional Website Metrics
00:49
HD
A trade market diagram appears on the screen along with candlestick charts in the background, illustrating the volatile world of forex and cryptocurrency trading. Charts and diagrams.
00:15
HD
Hand placing a bar on a chart while displaying various types of graphical representations, concepts of data analysis, financial growth, and business strategy
00:17
HD
A detailed view of hands on a laptop and paperwork, colleagues collaborating over data charts in a fast-paced office meeting.
00:15
HD
Animated futuristic linear histogram, graphs and charts on white background, user screen dashboard or interface with graphs, lines, surfaces, motional and colorful diagrams, animated dashboard, market
00:10
HD
Digital charts global map rising market curves. financial technology, market volatility, economic research, portfolio analysis, trading dashboards, global growth, corporate strategy business news.
00:20
HD
Neon Business chart icon isolated . business chart growth concept black background. Zigzag up right arrow with 4k video animation.
00:10
HD
Split screen financial comparison animation with green growth and red decline bar charts
00:15
HD
A young professional is examining investment data graphs and charts, analyzing financial information, and monitoring stock market trading reports.
00:38
HD
Business Innovation Light Bulb with Startup and Growth Icons
00:09
HD
Neon-style bar chart showing descending bars with downward arrow animation
00:10
HD
Skyscrapers with upward-trending financial chart and rising arrow, symbolizing business growth, investment success and real estate asset value. Ideal for property investment, financial market concepts
00:14
HD
Interactive Data Visualization Dashboard with Project Management Metrics and Analytics for Business Review and Planning in Modern Office Environment Gluon.
00:10
HD
Close view of eyes and market chart reflection. Attention to price action, market focus and risk control
00:15
HD
Neon Business chart icon isolated . business chart growth concept black background right arrow icon.
00:10
HD
Stressed Female doctor nurse sit by laptop computer while reviewing patient medical charts at the clinic office.
00:15
HD
woman analyst uses a computer AI artificial intelligence and dashboard for data business analysis and Data Management System with KPI and metrics connected to the database for technology finance,
00:10
HD
Business people analyzing business growth chart and discussing company strategy
00:24
HD
Stressed businessman silhouette facing financial market crash with red downward trend charts in this cinematic motion background video clip

00:05
HD
Economic wealth performance concept, stock market investment chart showing price volume index, financial trading data analysis, profit and loss statistics, business growth
00:19
HD
Diverse business professionals analyzing complex data on large futuristic digital display screens in a modern control room environment showcasing financial charts and graphs with glowing blue
00:10
HD
Seamless looped abstract visualization of financial data, price fluctuations, investment analysis and trading activity. Financial market interface with changing charts. Forex trading concept
00:10
HD
Young Businessman Presenting Data Dashboard on Screen in Modern Office
00:13
HD
Blue animated business growth bar chart with rising trend line
00:10
HD
A dynamic close-up timelapse of candlestick charts rising and falling on a trading screen, reflecting market volatility and momentum
00:29
HD
Looping animation showing a digital stock market chart with candlestick data and financial numbers
00:15
HD
DDR5 memory modules installed on a high performance motherboard with glowing upward growth charts and analytics indicators. Concept of rising RAM prices
00:07
HD
Data flow streams converging into a live analytics dashboard with radar chart, bar graphs and system load
00:16
HD
Data visualization animation showing digital bar charts and abstract network nodes moving across white background in dynamic business video footage
00:10
HD
Animated bar chart with rising trend arrow showing business growth and financial success
00:05
HD
Man, presentation and charts with review for team at office meeting, board and explain at finance company. Person, speaker and insight with graphs, feedback and collaboration at investment agency
00:20
HD
Business intelligence and financial performance analysis report on white background, animated infographic bar chart loop, investment data analytic graph dashboard, enterprise market statistics trend
00:14
HD
Futuristic Interface with Charts, Graphs, and AI Concepts Displayed on a Glass Screen While Someone Types on a Keyboard in a Modern Workspace Gluon.
00:10
HD
Trader wearing glasses is working on laptop computer. Screen with stock market charts and Bitcoin BTC or Ethereum ETH data analysis reflection. Broker trading online. Altcoins crypto currency trading
00:15
HD
Animated bar chart graph rising and falling financial animation
00:12
HD
Financial Stock Chart Market Analysis Data Visualization financial data trends, price movement, analytics indicators. trading visuals, investment strategies, economic reports, fintech presentations.
00:20
HD
arrow rising transparent channel. Abstract arrow growth chart of economy icon black color animated down. business line animation. Abstract glowing neon line business graph growth arrow
00:10
HD
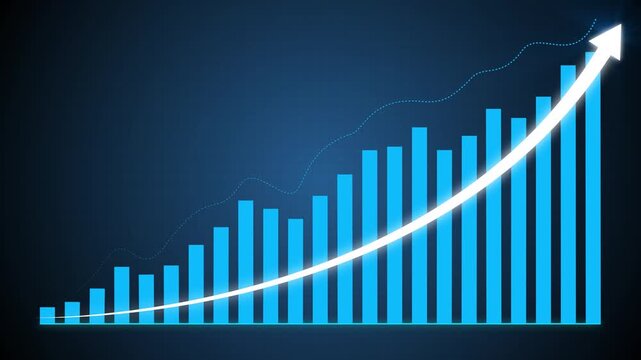
Dynamic financial growth bar chart animation with rising trend line and glowing success arrow for corporate business presentations, stock market analysis, economic forecasting, and data visualization
00:10
HD
Data Analyst analyze Data Financial Dashboard and Touch screen Monitor.
00:13
HD
Financial graph chart, market report, arrow up trend chart stock exchange asset, diagram investment capital gain world money economic growth
00:20
HD
Asian manager talking phone reviewing charts office. Colleague passing document.
00:24
HD
200 Percent Growth Counter Animation from 0 to 200 with Up Arrow Indicator in 4K, Business Growth, Success Rate, Analytics and Progress Increase Motion Graphic, 200% Growth on Transparent Background.
00:07
HD
Business data dashboard analytics with growth charts and revenue metrics animation
00:12
HD
3D render: Abstract digital financial data charts background. Futuristic business analytics, market research, global network concept. Big data report, statistic visualization. Ideal for tech
00:20
HD
Overhead arc shot of office team analyzing financial graphs and documents during collaborative corporate meeting
00:12
HD
Business professional creating organization structure chart with team hierarchy and workflow planning, representing human resource management, corporate structure and leadership strategy for infograph
00:10
HD
Accountant analyst in office reviewing computer data. Screen shows charts graphs and a financial report as coworkers talk nearby in a bright workspace. Simple concept of finance analysis.
00:09
HD
Analytics dashboard interface showing revenue charts user metrics and traffic data visualization
00:10
HD
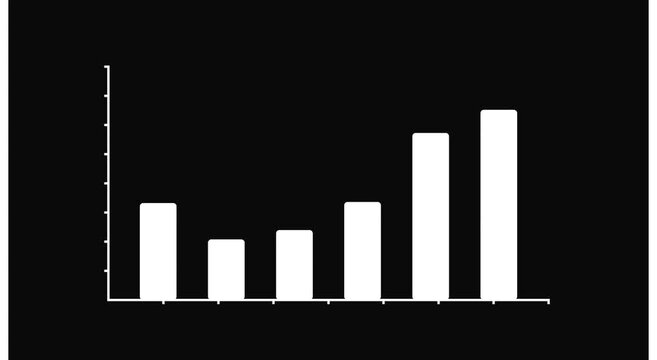
Stock market chart shows data trends over time with bars indicating price movements in trading activity.
00:10
HD
Minimalist Financial Growth Curve Chart on Black Background
00:10
HD
Business chart graphics and bar stats appearing. Animation of financial infographics diagram showing increasing business growth and success. Digital business trend.
00:20
HD
Scientist in protective hazmat suit analyzes DNA data and scientific charts on a modern computer screen in a high tech medical laboratory
00:13
HD
A hand presenting a virtual bar chart illustrates increasing growth with digital lines and a futuristic backdrop, symbolizing financial success and analytics. Copula
00:10
HD
financial statistics graph rising prices in stock market and inflation rate
00:15
HD
Animated financial charts displaying trading data move with the background
00:14
HD
Digital world map glowing financial chart bars global data visualization trading market analysis environment futuristic style. finance visuals, stock market business analytics, global economy themes.
00:20
HD
Project Manager Updates Agile Task List In Office Diary
00:28
HD
A researcher in a white lab coat and blue gloves types on a keyboard at a laboratory workstation, surrounded by scientific charts and equipment. The image captures innovation and technology in science
00:10
HD
Financial chart background with rising bar graph and candlestick market data showing growth profit and upward trend animation
00:10
HD
Business Stats Market And Infographics On Computer Screen
Animation of a business and market data analysis and reports with infographics layout bar stats charts and diagrams on a computer screen
00:14
HD
Center woman placing sticky note, team writing on clear glass for planning, green chart overlaying
00:15
HD
Business steady growth concept with rising progress bar chart and upward arrow.  Symbolizing rising profits, success, and positive business performance.
00:10
HD
woman analyst uses a computer AI artificial intelligence and dashboard for data business analysis and Data Management System with KPI and metrics connected to the database for technology finance,
00:10
HD
Neon-lit monitoring concept with glowing blue lines and symbols on a black background with a futuristic feel.
00:10
HD
Corporate team standing around large table with charts documents and data analysis presenting strategic planning collaboration and modern business meeting concept
00:05
HD
Stock Market Trading, Forex, Crypto Currency with technical price graph indicators and data numbers mock up template for trading financial and investment concept
00:19
HD
Analysts teamwork discuss finance data and dashboard. Colleagues review charts on computer screens and printouts, aligning analytics with metrics. Concept image of collaborative office analysis.
00:11
HD
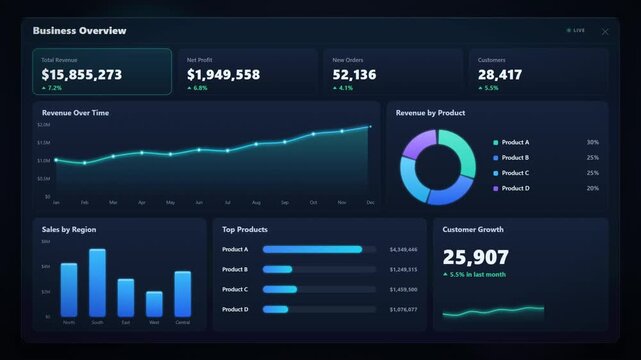
Business overview dashboard with revenue profit sales charts and KPI metrics on dark screen
00:15
HD
Digital tablet computer show the financial data with digital pencil
00:30
HD