암호 설정을 위한 링크가 다음으로 전송됨: 나중에 구매 기능을 이용하려면 암호가 필요합니다.
무제한 다운로드와 강력한 AI 편집 기능으로 제약 없이 창작해 보세요
새 필터 추가됨
정렬 기준

비디오에서 chart , digital , plot에 관한 95,005개 결과

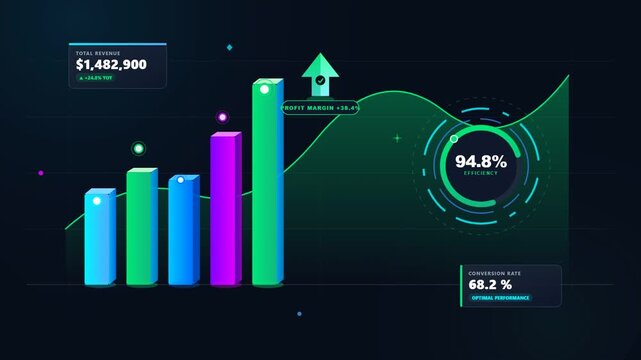
Animated bar chart with rising trend arrow showing business growth and financial success
00:05
HD
Business people discussing financial stock market graph analysis and trading strategy on computer screens in office
00:23
HD
A hand presenting a virtual bar chart illustrates increasing growth with digital lines and a futuristic backdrop, symbolizing financial success and analytics. Copula
00:10
HD
A person is using a laptop and looking at graphs and symbols related to investing. There are stacks of coins on the table. The setting looks like an office.
00:10
HD
Blue arrow graph rising through digital bar chart during economic growth with dark background
00:05
HD
AI payroll system interface showing employee salary data, budgeting graphs, and monthly calendar used on laptop for digital finance management and automated compensation planning in business setup, 4k
00:12
HD
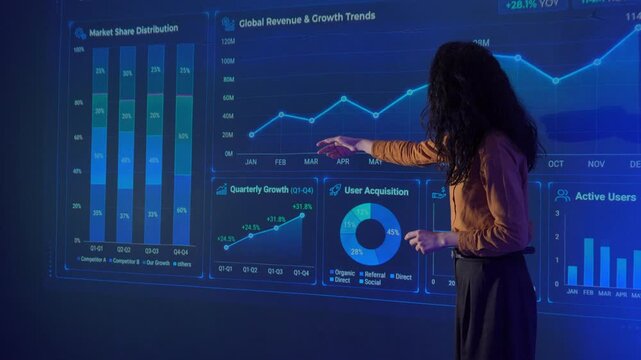
Adult female business presenter speaks beside digital performance dashboard, using expressive gestures while explaining growth analytics to seated audience during corporate intelligence presentation.
00:13
HD
Businesswomen analyzing global market trends and revenue data during a corporate presentation, teamwork, data analytics, financial strategy, and technology-driven decision making in a modern office.
00:17
HD
Scheme hierarchy management of corporate. Digital technology of business process and workflow automation with flowchart and processing management.
00:13
HD
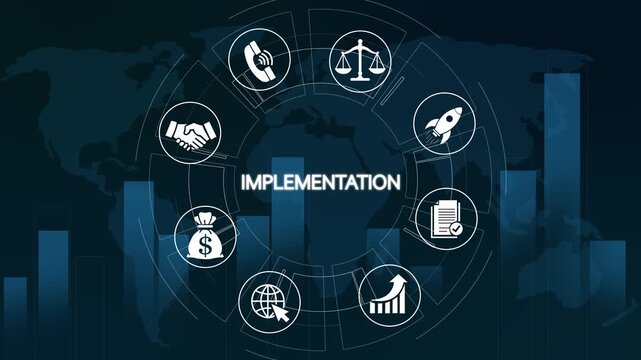
Business implementation strategy concept with digital icons, global network and financial growth charts
00:10
HD
Human Resources Dashboard with Employee Analytics and Workforce Management Animation.
00:15
HD
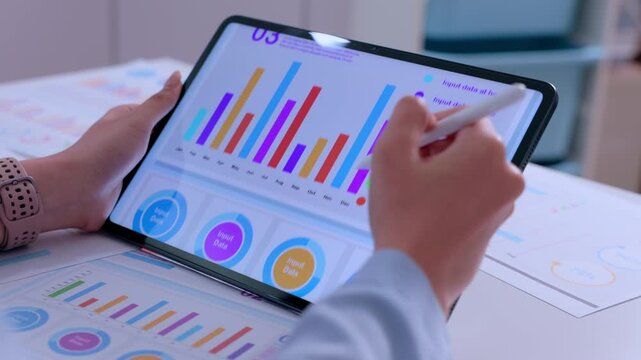
Tablet chart graph data analysis hand stylus report business digital dashboard colorful analytics screen finance planning office workspace reviewing document growth insights
00:10
HD
Industrial worker using a tablet beside a monitor energy efficiency charts and factory data in a modern control room.
00:26
HD
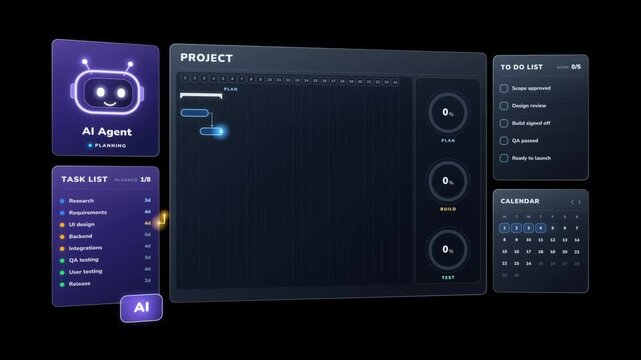
Gantt chart planned by an AI agent robot, then tracked through plan, build and test phases on a calendar
00:15
HD
Business analytics dashboard with laptop in office, Business person using a laptop with holographic floating digital charts and data dashboards on a desk
00:10
HD
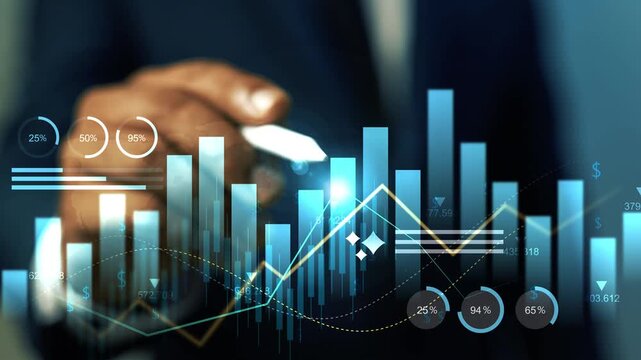
Businessman touches a glowing digital hologram chart with rising bars, arrows and data lines, showing financial growth, investment planning and market analysis.
00:09
HD
Digital Document Download Illustration Featuring Analytical Business Charts and Reports
00:10
HD
Abstract digital project management board with interactive task cards and notifications on a dark purple background
00:10
HD
Abstract digital arrow pointing upwards, representing growth and progress in the future
00:08
HD
Growing financial bar chart with upward trending arrow, showing business growth and positive investment, digital abstract background
00:08
HD
Financial growth concept with blue digital interface showing animated rising bar charts and coin stacks for wealth management and investment planning
00:08
HD
Chart, meeting and business women on computer screen for stock market, trading and investment. Corporate, night and people pointing on pc for financial review, graphs and research for cryptocurrency
00:05
HD
Explore a modern workspace showcasing advanced data analytics and cognitive technology with digital dashboards. Perfect for illustrating business strategy and innovation. Raster
00:20
HD
Understanding risk levels in finance using a digital display during a business meeting in an office.
00:10
HD
Business strategy, target and planning concept. Person typing on keyboard with target bullseye, growth roadmap and strategic gear icons, corporate goal setting and vision execution.
00:10
HD
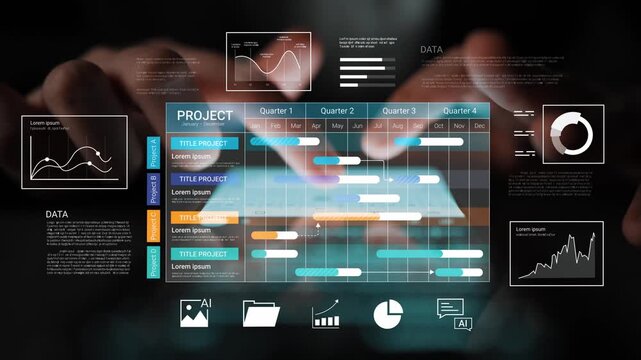
Abstract Gantt chart project management dashboard showing task schedules, progress bars and monthly timelines on digital background, illustrating workflow planning and project tracking.
00:12
HD
Dynamic financial growth bar chart animation with rising trend line and glowing success arrow for corporate business presentations, stock market analysis, economic forecasting, and data visualization
00:10
HD
Data visualization animation showing digital bar charts and abstract network nodes moving across white background in dynamic business video footage
00:10
HD
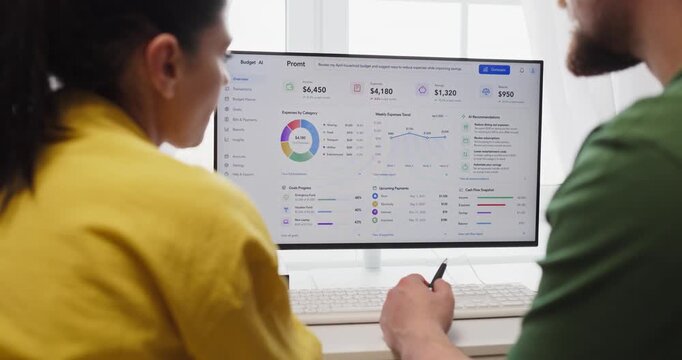
Couple budget planning on finance dashboard online. They review savings and monthly expenses on a computer at home using charts analytics for smarter choices. Clear concept of home finance teamwork
00:08
HD
A young professional is examining investment data graphs and charts, analyzing financial information, and monitoring stock market trading reports.
00:38
HD
Glowing digital business growth chart showing positive trend and upward progress video
00:06
HD
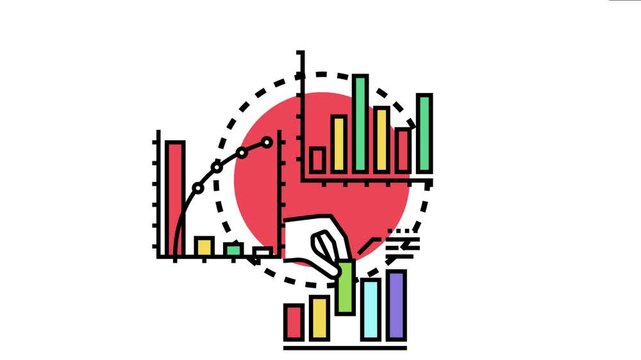
Hand placing a bar on a chart while displaying various types of graphical representations, concepts of data analysis, financial growth, and business strategy
00:17
HD
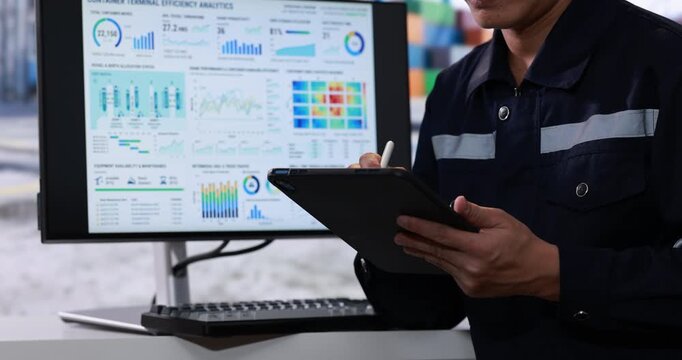
Industrial worker uses a tablet beside a computer monitor displaying colorful production data charts and performance dashboards in a factory office.
00:21
HD
Businessman touching a futuristic digital control panel with big data graphs, charts and key performance indicators, concept of data analysis, business intelligence and IoT management
00:07
HD
Business growth and financial analytics, with a professional touching digital charts and graphs for strategy, planning and success at office desk.
00:07
HD
Animated financial dashboard with glowing bar charts and upward revenue growth metrics
00:15
HD
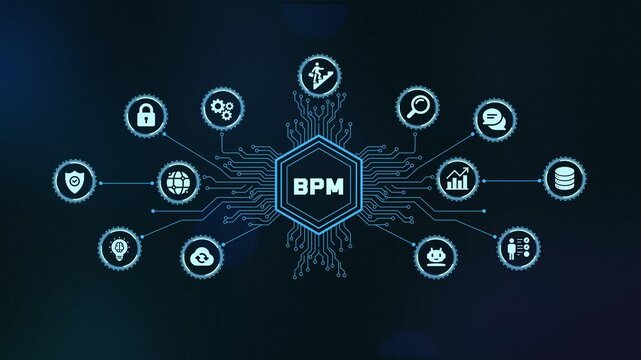
BPM business process management automation technology concept HUD interface with digital system icons
00:15
HD
Social media analyst monitoring performance metrics on dashboard interface. Audience engagement tracking, digital marketing campaign analysis, data visualization, and content strategy optimization.
00:10
HD
Senior insurance advisor showing financial charts and data on a tablet to a young female client during a professional office consultation.
00:12
HD
Businessperson using a laptop with a digital hologram finance dashboard, Holographic financial planning dashboard with growth chart animation
00:09
HD
Businessman hands typing on a laptop with a glowing hologram bar chart animation on the screen, Holographic online business growth data analysis and financial progress in a dark office
00:06
HD
Neon digital growth chart transitioning from 2026 to 2027: business strategy and financial planning concept
00:10
HD
Explore a dynamic interface showcasing business analytics, data visualization tools, and interactive charts for effective decision making and strategic planning. Cipher
00:10
HD
Business timeline 12 months, glowing milestone markers lighting up in sequence, annual progress roadmap, seamless loop 4K
00:12
HD
Side Profile Portrait of Stockbroker at Desk Looking at Computer Screens Showing Stock Exchange Data, Equity Charts, Investment Analytics, Asset Management, Financial Graphs to Track Market Trends
00:16
HD
Digital tablet showing business graphs and financial data charts in an office
00:05
HD
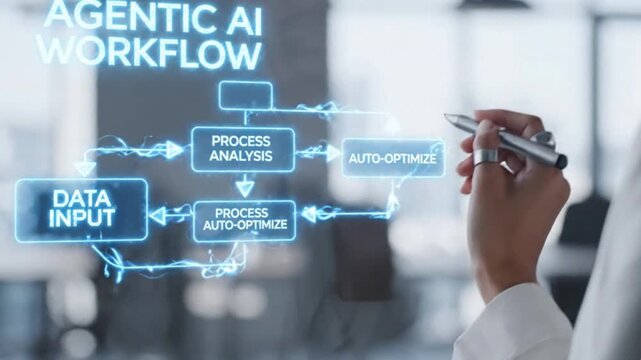
Agentic ai multi agent collaboration workflow diagram with data input process analysis and auto optimize concept for future technology modern office
00:08
HD
Hand typing on laptop keyboard with digital hologram financial chart gear for enterprise technology data analytics performance optimization business revenue growth investment strategy success profit
00:10
HD
Mature woman analyzes budget charts and bills. She uses a computer dashboard to review expenses and finance data for monthly household planning. Everyday digital money management concept.
00:13
HD
Businessman analyzing glowing green financial stock market chart with upward growth trends in this high quality digital motion video clip
00:05
HD
Business professionals analyzing stock market financial growth charts on digital screens.
00:07
HD
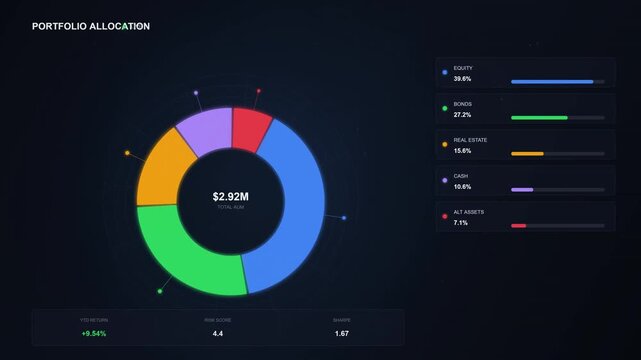
Cutting-edge digital interface showcasing dynamic financial portfolio allocation with an interactive donut chart and detailed investment insights, rendered in a sleek, modern visual display
00:10
HD
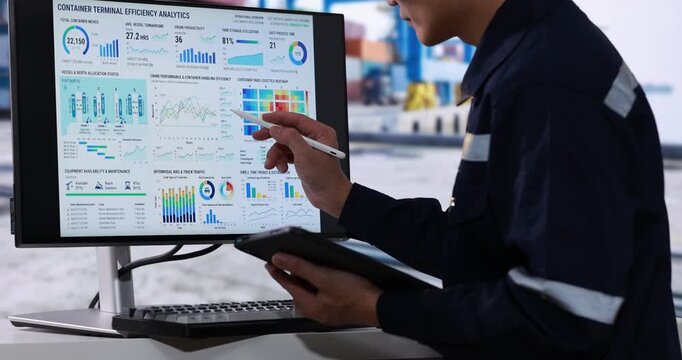
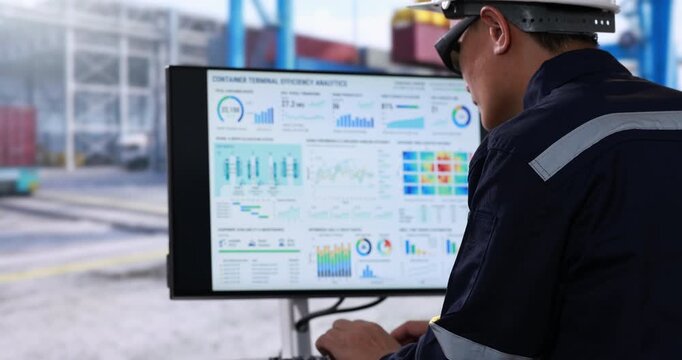
Industrial worker in hard hat and safety glasses reviews data dashboard on a computer monitor at a shipping container terminal.
00:19
HD
Businessman touching on hologram digital dashboard overlay showing graph charts, map and growth data animation, Holographic modern business analytics, finance planning and market performance
00:10
HD
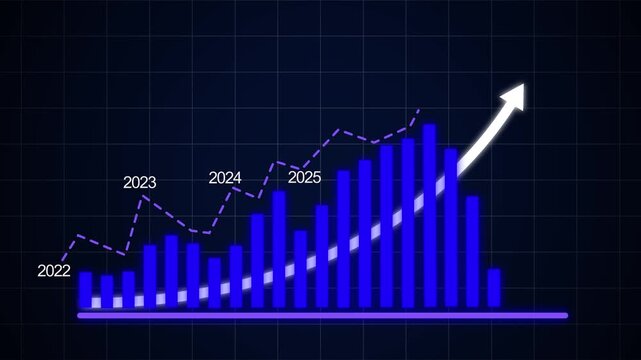
Dynamic financial bar chart animation representing annual business growth and market success from 2022 to 2027 with rising trend arrows and data visualization for corporate economic presentations
00:10
HD
Digital data graph with glowing blockchain network and modern finance technology background
00:10
HD
Business growth roi increase with ai integration system development reduce cost improve efficiency successful corporate strategy innovation project management strategic planning corporate progress
00:05
HD
Hands working on a smartphone while graphs and icons are displayed on a screen representing data and analytics in business settings
00:10
HD
Financial growth bar chart with rising trend line, digital business analytics and market performance visualization
00:15
HD
Hands, tablet and person writing in notebook for planning, agenda or financial report. Accountant, notes and digital bookkeeping with to do, data analytics or tasks for business audit and summary
00:06
HD
Digital project management interface featuring animated Gantt charts and task scheduling timelines.
00:11
HD
Business person using a laptop with hologram glowing charts and rising arrows animation on the screen, Business data growth, finance planning, market analysis and digital business success
00:08
HD
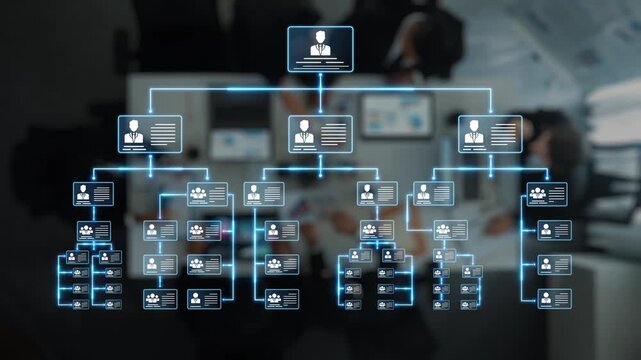
An illustration representing a digital organizational chart set in a modern office, showcasing team structure and collaboration among business professionals for strategic planning. Raster
00:20
HD
Businesswoman analyzing financial reports and accounting data, using a calculator and digital tablet for strategic planning and economic success in the modern office
00:11
HD
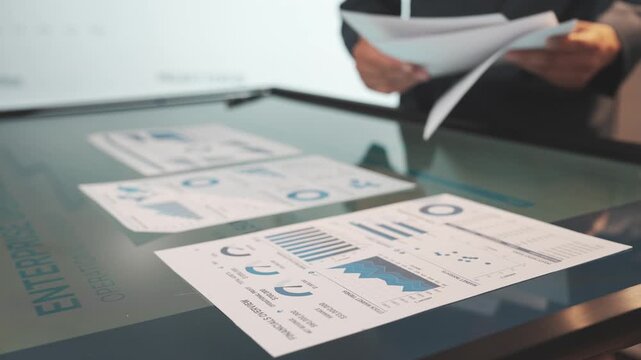
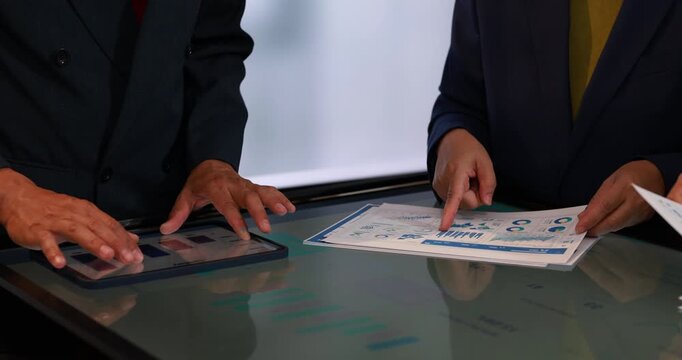
Two business professionals analyze financial documents and digital data charts on an interactive table screen using a pen and calculator during a corporate strategic planning meeting.
00:08
HD
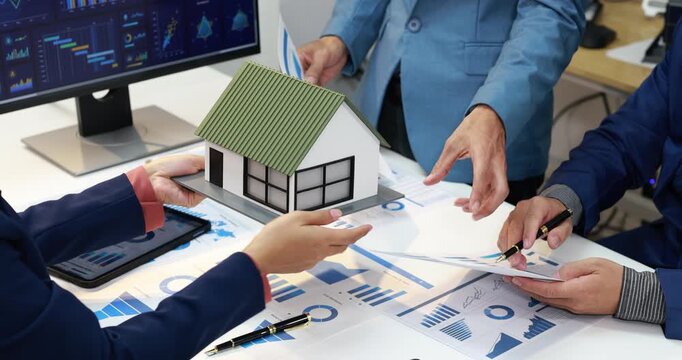
Business team reviewing a house model, financial charts and digital data on a desk during a real estate investment meeting.
00:11
HD
Teamwork, tablet and collaboration among three office colleagues comparing a digital report with printed charts at a desk, for business analysis, project planning and professional discussion.
00:18
HD
Business person touching a digital holographic financial chart with glowing bars and data icons animation, Hologram market analysis growth strategy and modern technology
00:10
HD
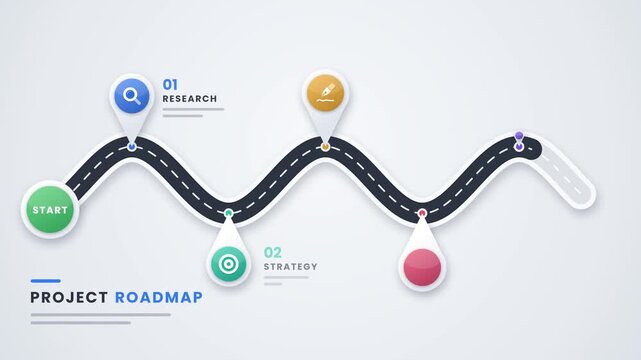
Five milestone roadmap infographic concept for project planning and showing business growth stages in a company timeline presentation animation
00:10
HD
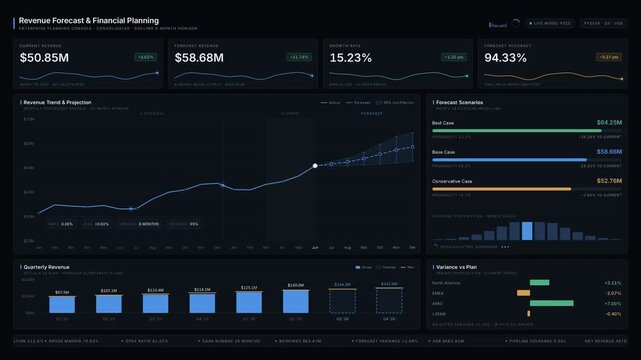
Professional revenue forecasting and financial planning dashboard animation featuring KPI cards, trend charts, and scenario forecasts for corporate presentations in dark mode.
00:15
HD
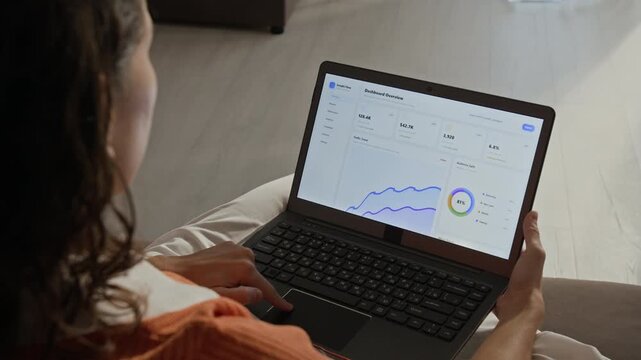
Over shoulder shot of Caucasian young adult woman analyzing business metrics and scrolling through dashboard analytics on laptop. Clip perfect for marketing campaigns about remote work and e-commerce
00:08
HD
Hormuz Two-Way Lanes Navigation Visualization, Maritime Traffic Flow, Geospatial Mapping Animation, Oceanic Route Planning, Digital Topography, Seamless Loop, Modern Navigation Graphics
00:12
HD
Business colleagues review financial charts and digital reports on a touchscreen table during a meeting, showing teamwork, planning and data analysis.
00:21
HD
Holographic glowing data charts and digital icons business person holding above the hand in a modern office, Business finance growth analytics planning and technology innovation
00:09
HD
Workflow process optimization interface displaying business methodology layout and corporate data analytics.
00:14
HD
Futuristic project management dashboard display with glowing digital data charts and interactive financial analytics interface on a dark high tech background loop
00:15
HD
Corporate governance concept with enterprise compliance, intelligent business management, digital oversight and secure operational frameworks.
00:14
HD
A person types on a laptop in a dimly lit setting. Green digital images of charts and graphs appear in a layout on the screen, suggesting data analysis or financial planning.
00:10
HD
Asian businessman presenting ESG report on a large digital screen in a modern office, discussing social issue matters with a colleague during a corporate meeting.
00:15
HD
Meeting, graphs and documents with business hands in office for company profit, revenue and pitch. Paperwork, charts and financial manager with people for investment planning, budget or teamwork
00:11
HD
Dynamic financial growth bar chart animation featuring rising green columns and upward trending arrow representing annual business success and economic development projections from 2022 to 2027 period
00:10
HD
Businessman using a laptop with hologram digital charts and growth icons  , Business growth chart and data analysis on laptop
00:08
HD
Interactive Data Visualization Dashboard with Project Management Metrics and Analytics for Business Review and Planning in Modern Office Environment Gluon.
00:10
HD
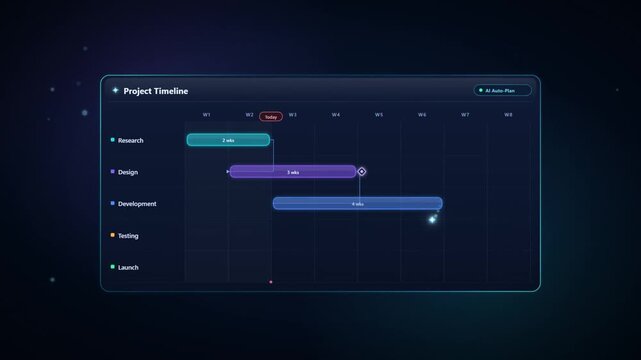
Animated AI project timeline dashboard automatically generating Gantt chart schedule for roadmap
00:12
HD
Digital charts global map rising market curves. financial technology, market volatility, economic research, portfolio analysis, trading dashboards, global growth, corporate strategy business news.
00:20
HD
Businesspeople collaborate on a project, analyzing documents and data in a modern office. Coworkers review plans and digital charts together, fostering a productive work environment.
00:08
HD
Business analytics, laptop and charts on an office desk with colorful pie graphs, line plots and performance indicators on screen; digital reporting for research, evaluation and data visualization.
00:11
HD
Businessman reviewing holographic financial charts on a laptop and documents with a glowing digital graph overlay, Business analyzing financial charts at office desk
00:11
HD
Animated white bar chart graph with rising trend arrow on a clean black background, representing financial growth, business success, data, analysis, market expansion, and positive economic progress
00:10
HD
Doctors show teamwork at computer for records consultation. Two physicians review charts on dual monitors, coordinating diagnosis and updating files. Concept of digital healthcare teamwork.
00:07
HD
Arabian presenter standing near digital display with charts and data, addresses small group of colleagues, negotiating, discussing financial or business analytics, gathered in modern conference room
00:14
HD
Professionals work on laptops in front of large digital screens displaying complex financial data and stock charts at dusk.
00:10
HD
Businessman working with laptop and virtual Gantt chart for project management, planning schedule, and task tracking workflow. Professional concept for corporate efficiency and digital organization.
00:12
HD
Financial analyst monitoring live market charts across multiple screens in a dim office environment with focused data driven decision making
00:10
HD
Reviewing business report on digital tablet
00:11
HD
Businessman achieving success through strategic planning and professional development motion animated 4k video.
00:10
HD
Man working on payroll with laptop, pen, calculator and charts on desk with digital payroll icons
00:10
HD
Hand on smart tablet with holographic graphs and bar charts floating, digital financial planning, financial literacy, loans planning
00:05
HD
Crypto, stock market and graphic hologram of data in the trading industry with digital technology. Number statistics on virtual interface business chart of live economy currency with analytics system
00:06
HD
Multiethnic Youthful Group of People Preparing a Presentation in a Casual Conference Room at Office. Startup Data Team Discussing Process Using Laptop and Charts. Zoom Out Wide Shot
00:12
HD