Il collegamento per impostare la password è stato inviato a: La password sarà necessaria per accedere in futuro ai tuoi acquisti.
Ottieni 10 immagini Stock con una versione di prova gratuita
Aggiunti nuovi filtri
Ordina per

18.652 risultati per spider chart in tutto

1.320 risultati in video
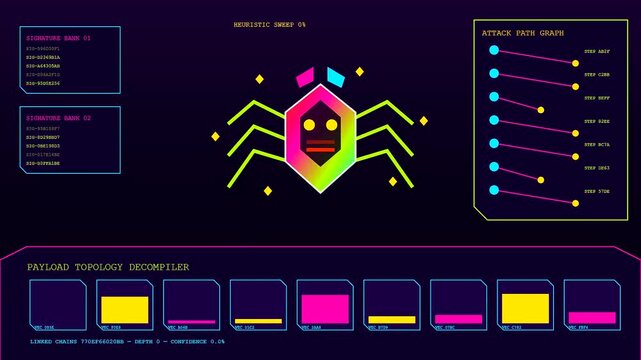
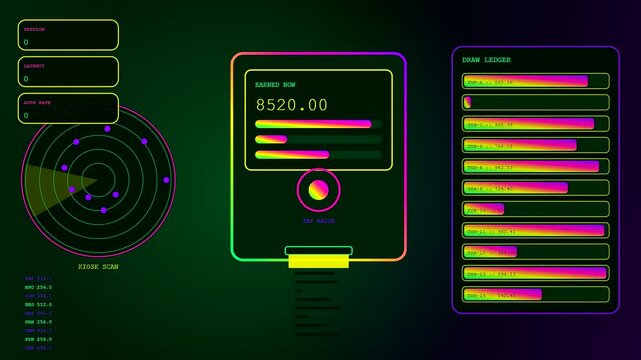
A digital vulnerability scan interface shows glowing spider motifs and colorful bar charts on a dark computer screen while representing complex system data analysis activity
00:06
HD
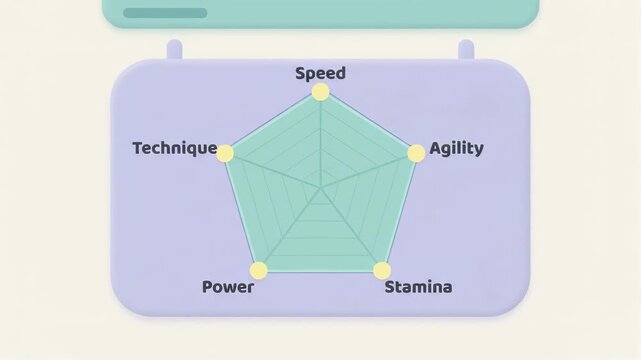
spider chart displays athletic performance metrics including speed agility stamina power and technique on digital interface against clean minimalist off-white background
00:06
HD
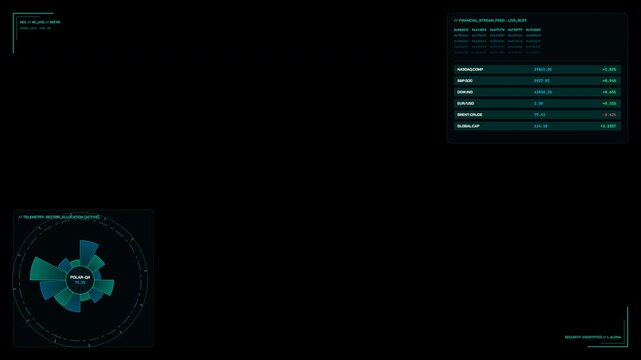
Futuristic financial HUD overlay with polar area charts, hex telemetry ticker, and framing brackets on transparent alpha in 4K seamless loop.
00:10
HD
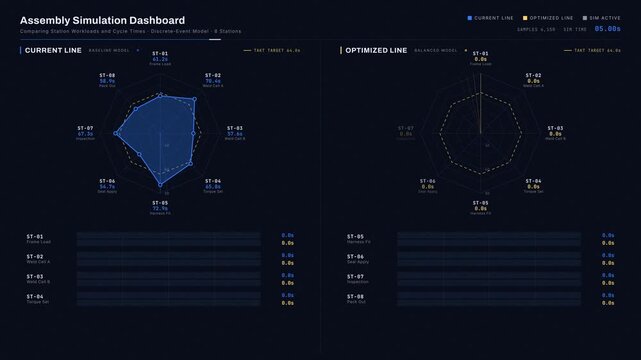
An assembly simulation dashboard showcases a split-screen comparison of station workloads and cycle times with animated charts and metrics in a dark premium design.
00:15
HD
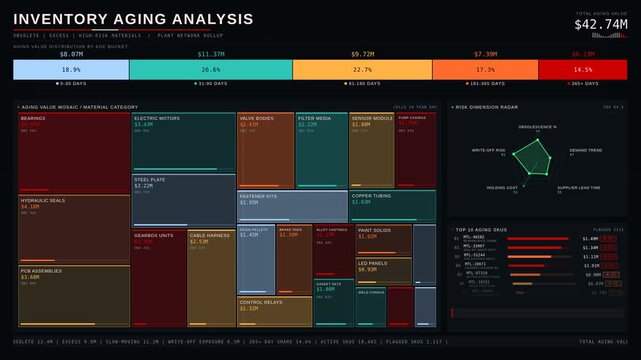
A visually striking 4K inventory aging dashboard showcasing obsolete, excess, and high-risk materials with dynamic Gantt bars and vibrant risk indicators in dark tones.
00:15
HD
Radar chart expanding past last period for skills improvement
00:12
HD
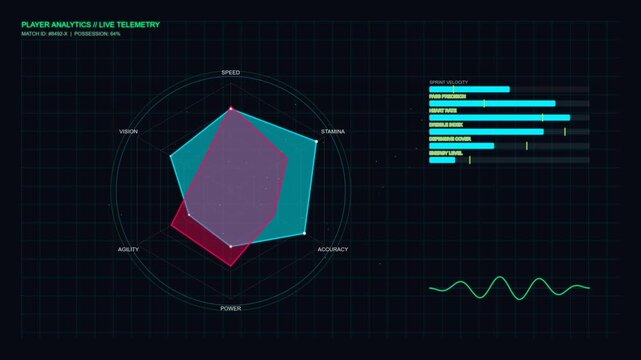
Player performance analytics radar chart with live telemetry data a professional sports display showing a spider comparing stats like speed and stamina alongside horizontal velocity sliders
00:10
HD
Professional Talent Competency Radar Chart Animation with Expanding Mint Green Polygon on Dark Slate Background
00:05
HD
Radar Chart Dashboard Pulse Seamless Loop Abstract Data Analytics Visualization Background in bright emerald tones
00:10
HD
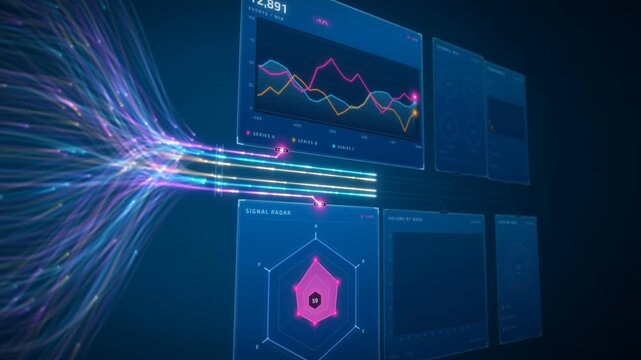
Data flow streams converging into a live analytics dashboard with radar chart, bar graphs and system load
00:16
HD
White Faceted Polygon Abstract Background Animation
00:12
HD
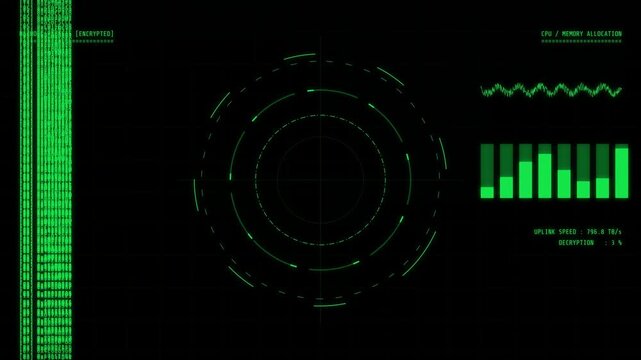
Digital interface displaying system breach warning with scrolling green binary code and circular radar graphs on black background
00:10
HD
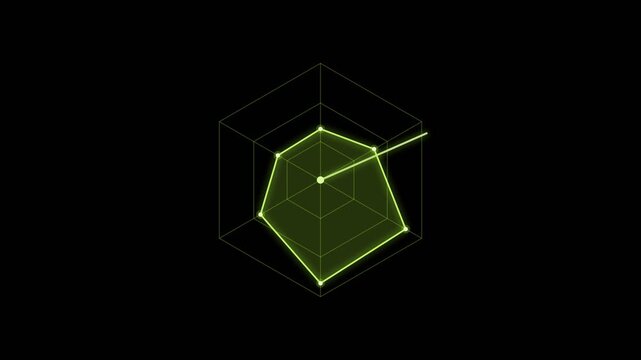
Lime radar spider chart drawing loop overlay on pure black background
00:05
HD
Minimal dark geometric background with concentric irregular polygon line pattern
00:20
HD
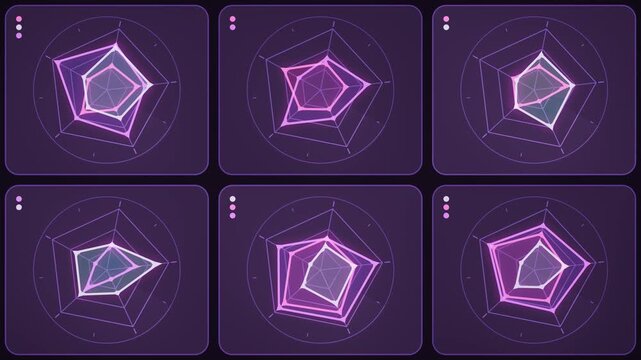
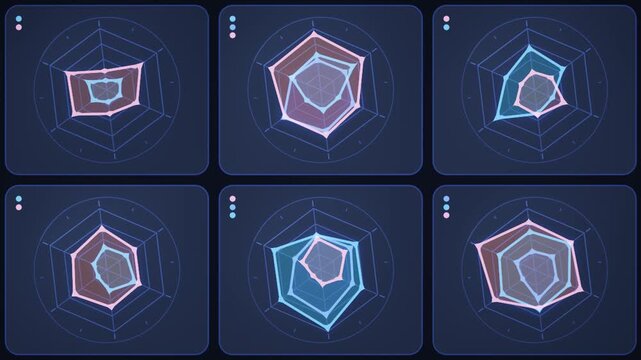
Radar Chart Dashboard Pulse Seamless Loop Abstract Data Analytics Visualization Background in cool plum tones
00:10
HD
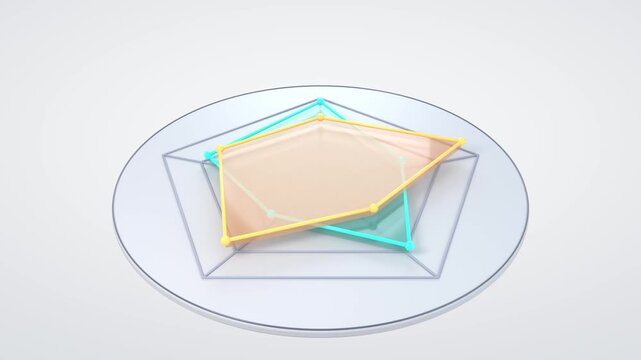
3D Radar Chart Comparing Two Data Profiles on Pentagon Spider Chart Light Gray Background Seamless Loop 4K
00:10
HD
Wage stream data interface displayed on a digital screen showing transaction logs and radar graphs within a glowing graphical user interface in a dark environment
00:06
HD
Radar Chart Dashboard Pulse Seamless Loop Abstract Data Analytics Visualization Background in subtle navy tones
00:10
HD
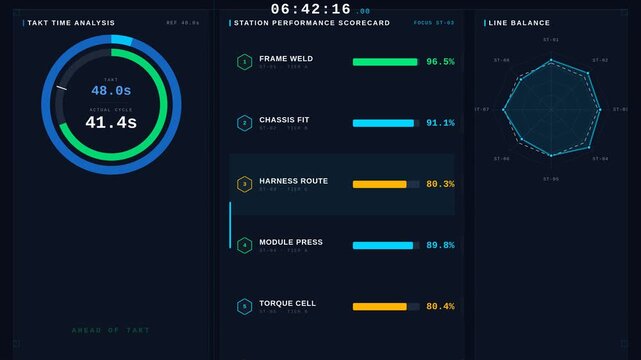
Explore the Smart Assembly Dashboard with Takt Time, Station Performance, and Line Balance in a sleek dark-mode design featuring animated metrics and modern aesthetics.
00:15
HD