Il collegamento per impostare la password è stato inviato a: La password sarà necessaria per accedere in futuro ai tuoi acquisti.
Ottieni 10 immagini Stock con una versione di prova gratuita
Aggiunti nuovi filtri
Ordina per

21.685 risultati per grid system tracking in tutto

8.588 risultati in video
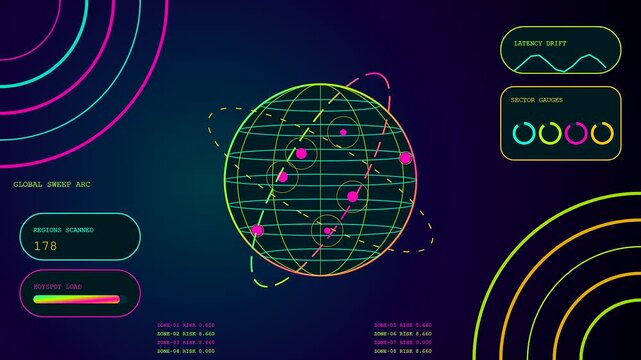
A digital vulnerability scanning interface displays rotating wireframe globes with blinking nodes and luminous circular radar charts against a deep navy blue and purple dark gradient
00:06
HD
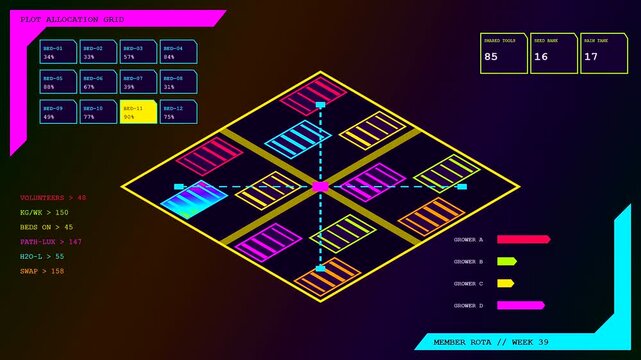
A digital community garden harvest display features animated isometric plots with glowing neon metrics across three sequential screens showing agricultural data updates in a dark environment
00:06
HD
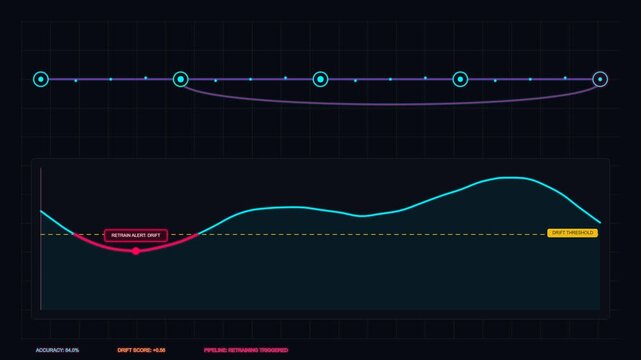
Data science analytical line chart with drift detection threshold for monitoring system performance a digital analytics interface displays a visualizing and metrics for software tracking
00:10
HD
Ev navigation interface scanning and tracking data on dark grid
00:10
HD
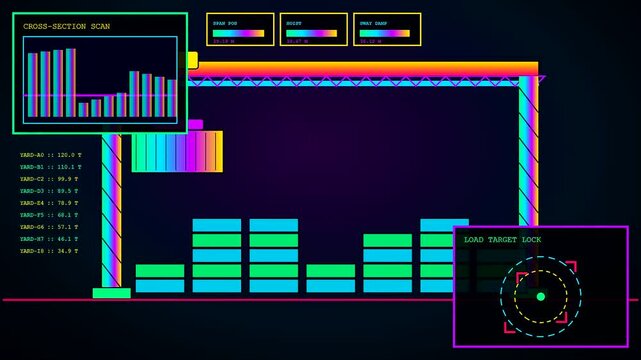
Automated warehouse optimization tracking system displays a digital crane moving colorful cargo blocks across stacked containers in a dark interface with vibrant neon graphical charts
00:06
HD
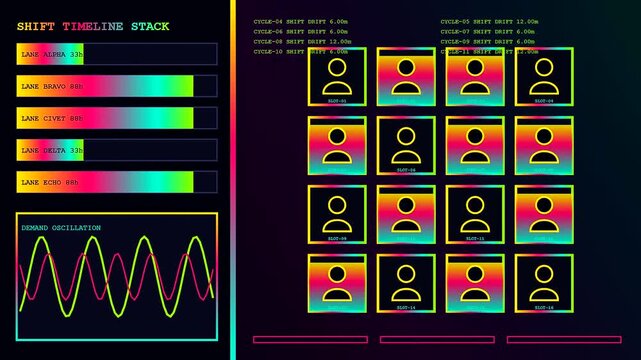
A digital staffing allocation system displays various user avatars and shift trends on a dark monitor screen featuring bright neon graphs for personnel tracking
00:06
HD
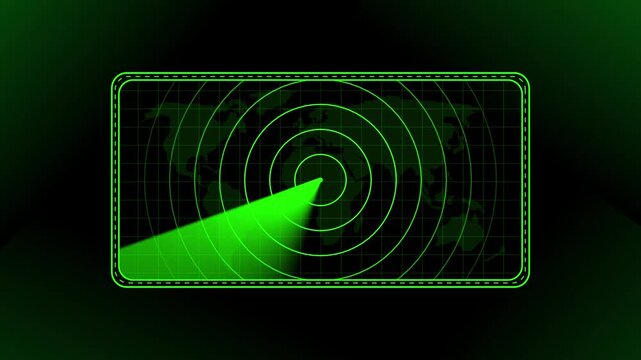
Rectangle radar sweeping and detecting interface animation. Futuristic digital radar interface data detection technology.
00:14
HD
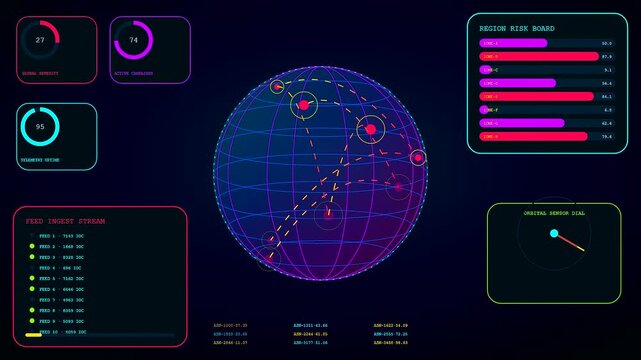
Threat intelligence interface displaying rotating global spheres with glowing data nodes and tracking lines across a dark digital panel showing various statistical charts and metrics
00:06
HD
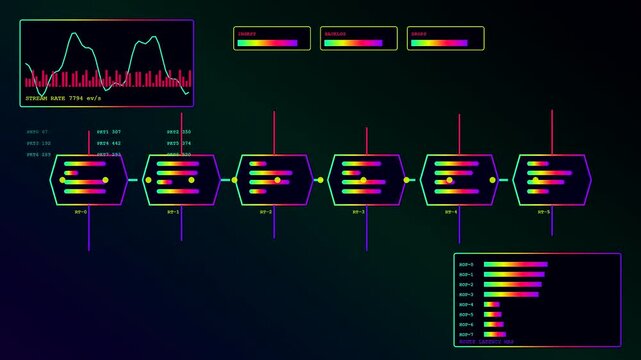
Digital servers telemetry monitoring displays featuring glowing nodes and moving network traffic lines shown within a dark futuristic interface animation for global data management system analysis
00:06
HD
A digital interface showcasing vertical agritech monitoring systems displaying glowing cellular plant grids with data tracking bars and fluctuating wave patterns within a dark simulated monitor screen
00:06
HD
Blue radar sonar interface scanning with rotating sweep line over dotted world map background
00:10
HD
Sentiment analytics visual data dashboard displays glowing pyramid bar charts and interconnected node maps across three frames of fluctuating digital metrics in a dark computing interface
00:06
HD
Digital carbon capture tracking interfaces display complex environmental metrics via glowing geometric charts and neon tiered graphs presented on a dark screen in this animation
00:06
HD
A digital bioinformatics interface shows rhythmic glowing data lines and colorful bar charts fluctuating on a dark screen during a complex genomic laboratory research session
00:06
HD
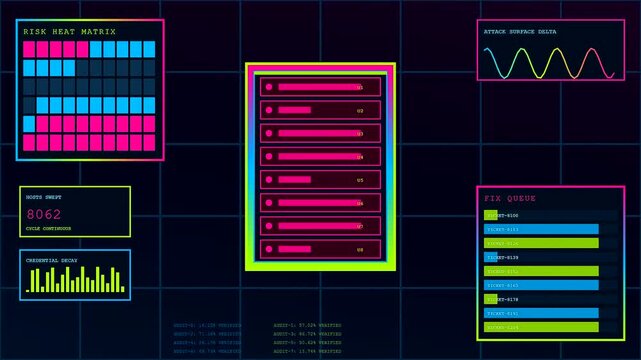
Vulnerability scanning charts and glowing system metrics appear on a dark interface representing complex digital monitoring tools used in modern data security analytics and network traffic tracking
00:06
HD
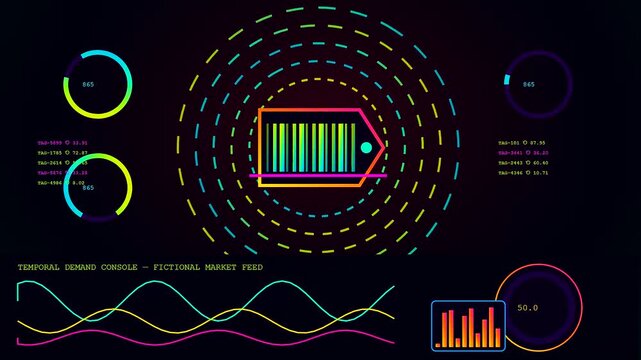
A stream commerce interface shows glowing neon barcode icons with circular data loading animations and undulating wave charts inside a dark digital console for analytical monitoring
00:06
HD
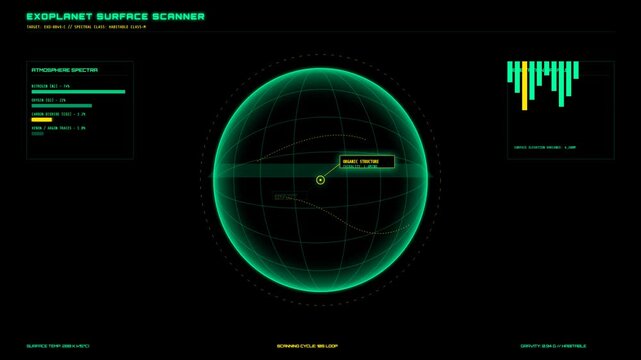
Futuristic Exoplanet Surface Scanner HUD Interface Display Scanning Alien World Digital Hologram
00:10
HD
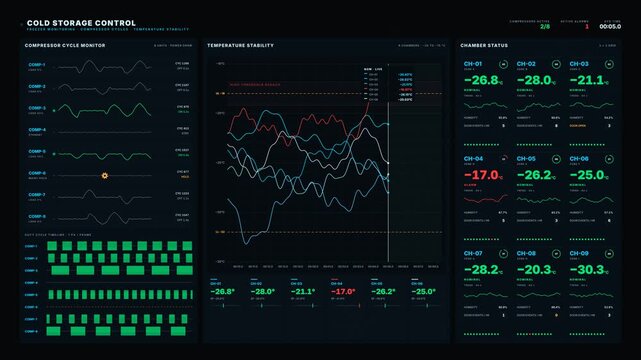
Clinical cold-storage control room interface displaying freezer monitoring dashboard, compressor cycle waveforms, and real-time temperature stability charts in cryo-blue.
00:15
HD
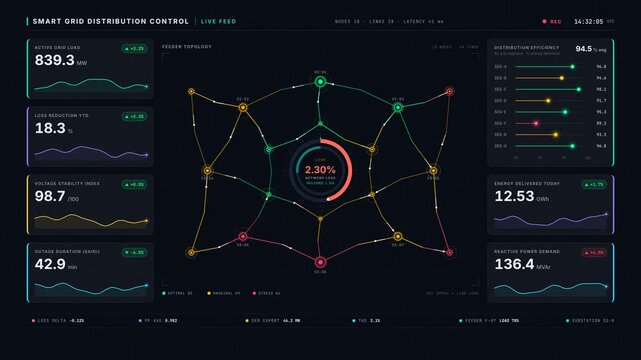
4K smart grid dashboard with animated network topology map, real-time loss reduction gauges, and glowing data metrics on dark slate background for energy control.
00:15
HD
A digital vulnerability scan interface shows glowing circular radar nodes with fluctuating wave form charts and changing data sequences across three synchronized dark computer display screens
00:06
HD
4K Solar farm dashboard visualization tracking panel output, weather conditions, and energy production data with dynamic charts and isometric view. for commercial creative technology and business use.
00:15
HD
Cooling energy dashboard tracking chiller efficiency and seasonal performance with animated line charts, gauges, and heatmaps on a dark industrial interface.
00:15
HD
Warehouse optimization digital interface displays colorful bar charts with grid alignment patterns glowing in dark blue tones showing systematic data tracking of logistics and supply chain systems
00:06
HD
Digital displays showing staffing allocation metrics with grid patterns and personnel icons in a complex interface for monitoring human labor capacity and dynamic workflow performance tracking
00:06
HD
Futuristic cyan holographic HUD interface with a glowing circular radar, central targeting crosshair, system status panels, and dark digital grid background. Abstract high-tech
00:10
HD
A digital cloud orchestration dashboard interface showing changing bar charts and line graphs with glowing pink and blue neon lights across a dark navy computer screen display
00:06
HD