Il collegamento per impostare la password è stato inviato a: La password sarà necessaria per accedere in futuro ai tuoi acquisti.
Crea senza limiti: download illimitati e potente modifica AI
Aggiunti nuovi filtri
Ordina per

90 risultati per quadrant chart in video


Intendevi: quadrante chart
Taurus is depicted as glowing stars in the night sky, connected lines outline the constellation of the bull in the zodiac belt
00:07
HD
Blue holographic quadrant matrix chart on a desk room scene appearing
00:18
HD
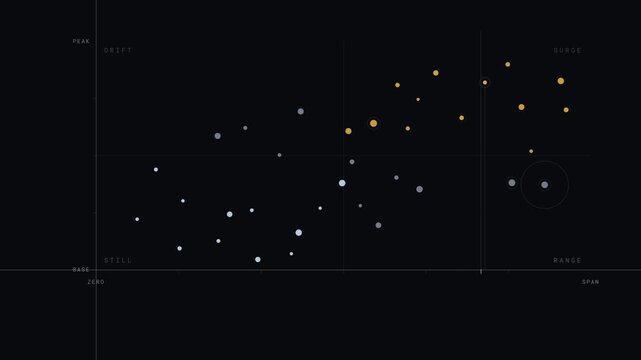
Sector Rotation Quadrant Chart with Orbiting Data Dots Seamless Loop
00:15
HD
Holographic quadrant matrix chart on a desk full scene assembling
00:12
HD
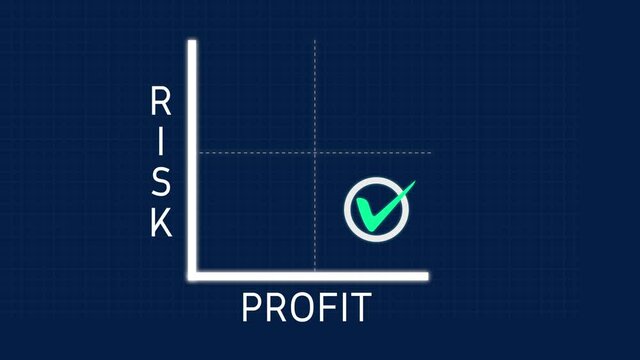
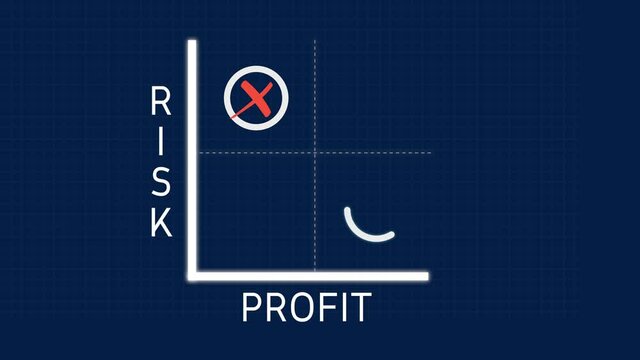
Risk and Profit Matrix Diagram Chart with Checkmark on Risk Animation on Solid Background and Green Screen
00:20
HD
Purple holographic quadrant matrix chart angled view building up
00:20
HD
Startup code appearing on grid initiating radar overlay streaming charts monitoring diagnostics
00:10
HD
Enterprise log monitoring dashboard animation in dark mode featuring authentication, network, endpoint, and cloud event visualizations with real-time data metrics and color-coded quadrants.
00:15
HD
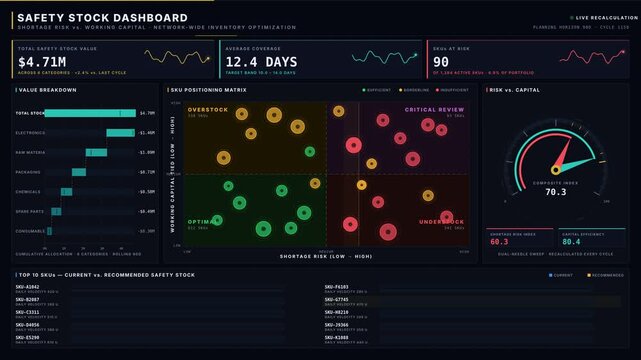
Explore a sophisticated 4K safety stock dashboard showcasing shortage risk versus working capital with vibrant color-coded quadrants and dynamic KPI visuals.
00:15
HD
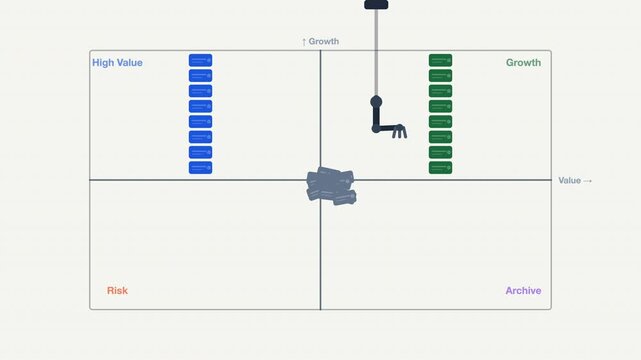
Blue and green blocks arranged in a quadrant chart layout with a mechanical arm motion sequence for analysis or industrial concepts. Suitable for tech or engineering designs.
00:09
HD
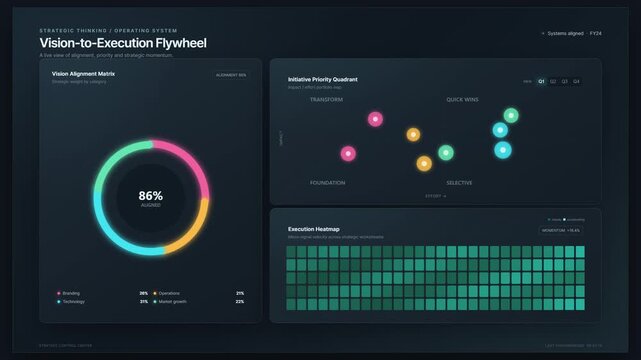
Business Strategic Vision to Execution Flywheel Dashboard with Data Visualization. Professional Corporate Analytics Interface for Priority Matrix and Execution Heatmap.
00:10
HD
Tech dashboard with compact bar charts and neon lines
00:11
HD
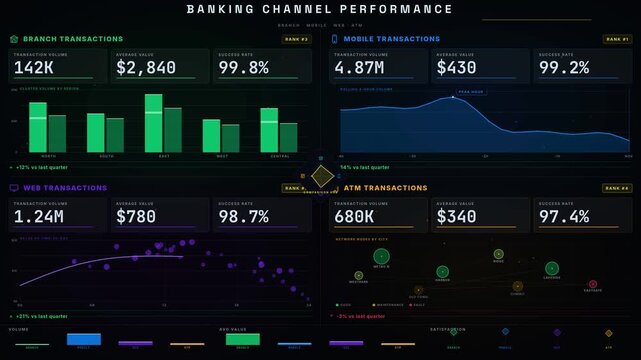
Visualize the Banking Channel Performance Dashboard comparing Branch, Mobile, Web, and ATM transactions with a dark aesthetic and vibrant color-coded quadrants.
00:15
HD
Animated four-part circular infographic with business icons on a white background.
00:15
HD
Minimalist four quadrant weather and gardening infographic animation with sun, rain, and plant growth icons on dark green background
00:16
HD
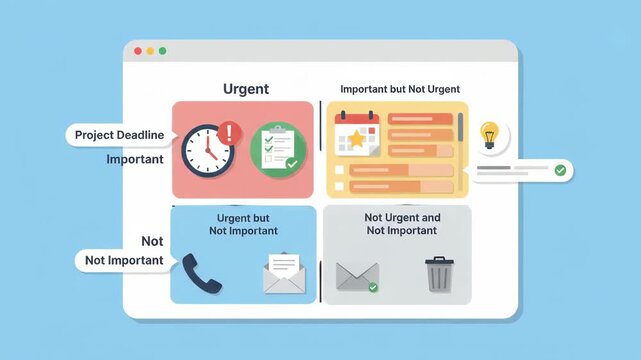
Eisenhower matrix grid illustrating urgent and important task prioritization on digital dashboard interface with icons representing project deadlines and work management set against blue backgroun
00:06
HD
Animated matrix quadrants infographic in a modern flat vector style, quadrants assembling together in a smooth 4K loop. Blank text placeholders and fresh green accents sit on a bright light background
00:07
HD
Parabolic Curve Quadrant Comparison Chart Animation
00:08
HD
SWOT analysis drawn by pen on notepad with color highlighted quadrants and business icons on wooden desk
00:16
HD
Green oscilloscope wave patterns moving across a dark screen in four quadrants
00:07
HD
A sophisticated and dynamic Predictive Analytics Graph interface displays shifting data bubbles and rising bar charts against a neon dark background for futuristic business market monitoring.
00:06
HD
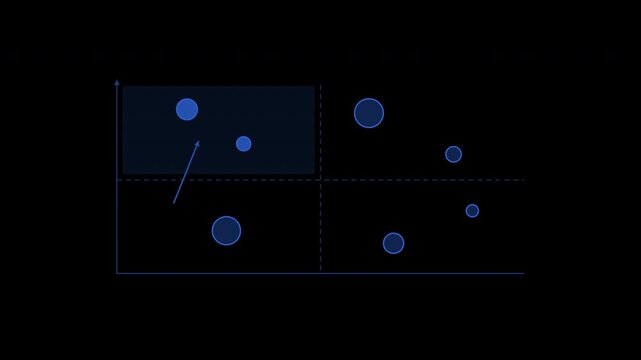
Bubble scatter plot migrating across business quadrants
00:10
HD
SWOT Analysis Quadrant Matrix Business Build
00:15
HD
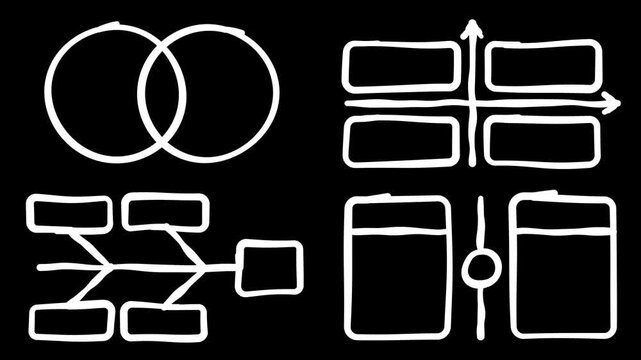
Hand Drawn Venn, Fishbone, Matrix and Comparison Diagrams on Black
00:06
HD
Risk and Profit Matrix Diagram Chart with Checkmark on Profit Animation on Solid Background and Green Screen
00:20
HD
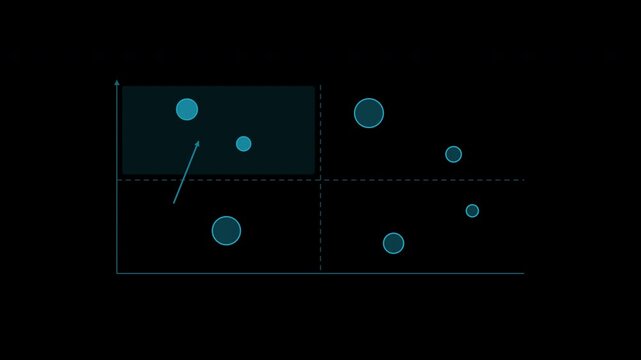
Priority quadrant comparing effort and business impact in cyan
00:10
HD
Opening dark purple grid plane starting icons fading sliding charts animating for showing data flow
00:12
HD
Circular emblem divided into four equal sections with clean geometric design, modern infographic and symbolic concept
00:07
HD
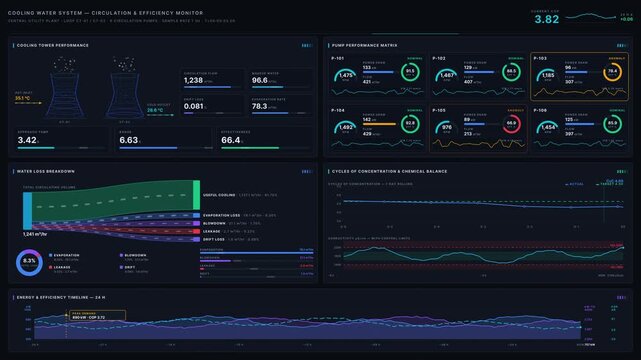
High-tech cooling water dashboard visualizing circulation efficiency, losses, and pump demand with animated metrics and sleek dark-mode design for industrial applications.
00:15
HD
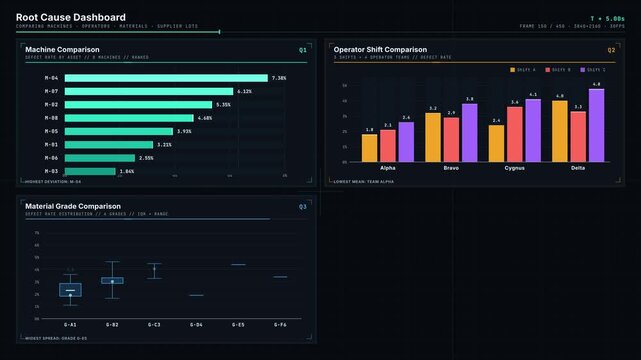
Explore a comprehensive Root Cause Dashboard featuring detailed comparisons of machines, operators, materials, and supplier lots with vibrant visual analytics and precise engineering design.
00:15
HD
Minimalist vector icon of a square divided into four sections with one black top left block and three white outlined blocks on a white background
00:10
HD
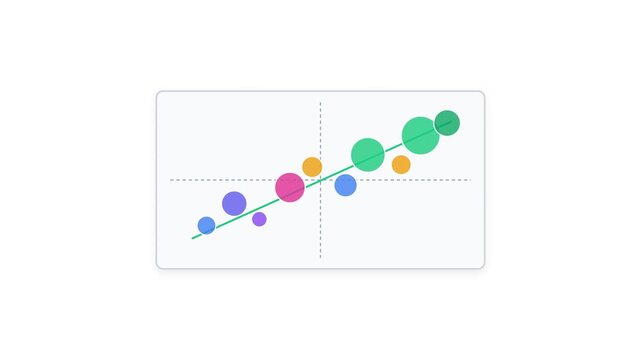
Quadrant Scatter Plot Matrix Populating with Colored Data Bubbles and Trend Line
00:08
HD
An animated scatter plot visualizes a risk-return matrix with data points dynamically converging from the origin, showcasing investment analysis in a modern design.
00:15
HD
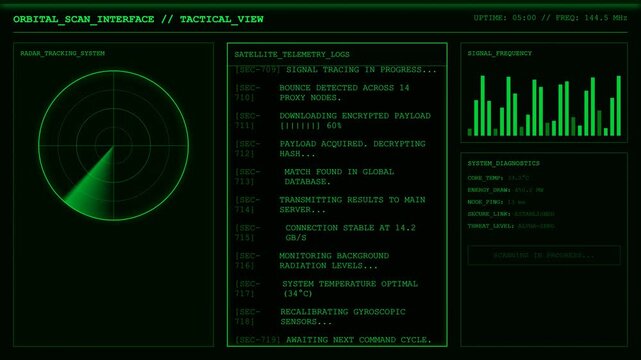
Orbital Scan Radar Tactical Satellite Tracking Interface Animation.
00:15
HD
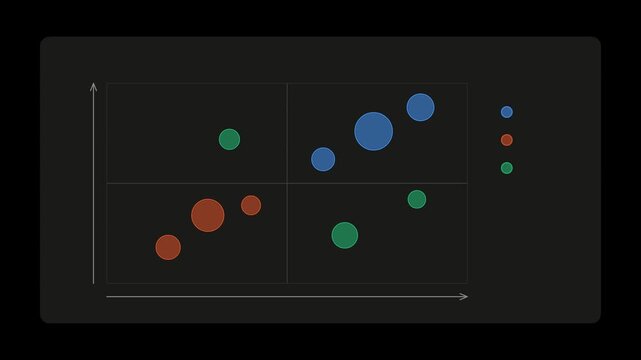
Market Analysis Bubble Quadrant Chart Animation
00:10
HD
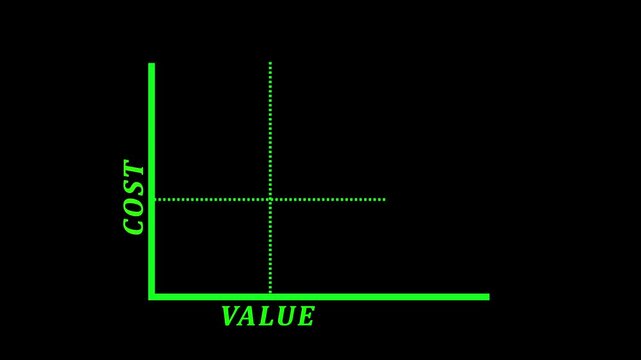
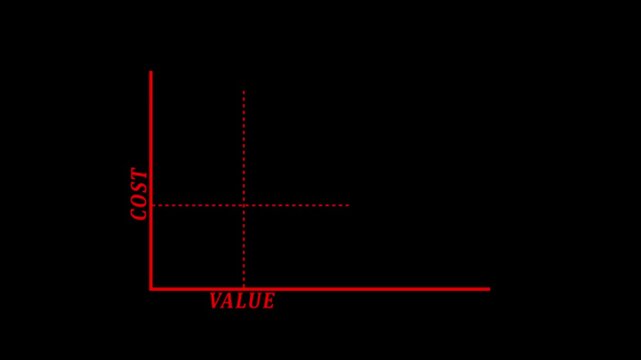
Cost benefit analysis. Concept about the relationship between Low Cost and High Value.4k
00:10
HD
Team Discussing Concept of Growth Share Matrix or Product Portfolio Matrix - Animation Illustration as MP4 file
00:10
HD
This looping digital background displays a geometric grid pattern formed by intersecting green and yellow lines on a dark surface.
01:00
HD
Four Option Process Infographic Arranges Icon Cards Around a Central Circle
00:15
HD
Animated 4 steps infographic matrix quadrant. Business presentation template 4K animation
00:10
HD
3D Four Quadrant Matrix with Bubbles Dropping into Colored Tiles 2x2 Priority and SWOT Template Seamless Loop 4K
00:10
HD
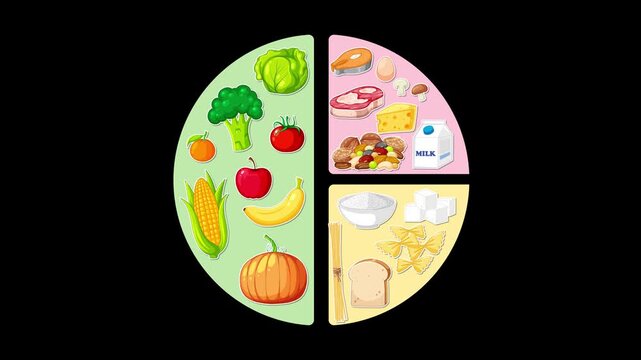
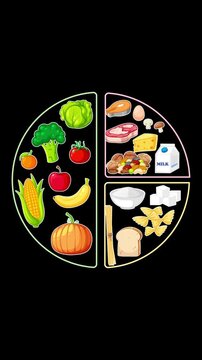
Animated Food Group Pie Chart Filling on Black Background
00:12
HD
ROI - Return On Investment
00:08
HD
Animated circular business infographic with data icons for financial reports.
00:10
HD
Risk and Reward Matrix Diagram Chart with Checkmark on Reward and Risk Animation on Solid Background and Green Screen
00:20
HD
Priority quadrant comparing effort and business impact in white
00:10
HD
Telemetry driving ORBITAL UI gauge rising charts updating tiles filling to monitor transparent bg
00:15
HD
Strategic Business Matrix Diagram with Corporate Icons Animation
00:05
HD
Futuristic Neon Data Infographic Display Animation
00:05
HD
Colorful Quadrant Diagram with Icons Animation Video
00:11
HD
Progetto quadrati con luci daykrim
00:13
HD
Animated text "Hello," and "August" in textured reddish-orange font transitions onto black screen; simple rotation and fade-out sequence delivers clean greeting.
00:05
HD
Animated colorful four quadrant circle diagram for time management infographic footage
00:10
HD
Animated Vegetable Icons Rotating in a Segmented Circle
00:10
HD
Strategic SWOT Analysis Matrix Infographic Motion Graphic
00:20
HD
4k Cost benefit analysis. Concept about the relationship between Low Cost and High Value.
00:10
HD
Vertical 9:16 animated quadrant chart animation point in green and teal on a dark background. Seamless looping 4K data visualization in portrait format for reels, shorts, stories and mobile presentati
00:07
HD
Clock faces move with Big Ideas and the years 2026. Four clock quadrants show a concept about business time
00:12
HD
Abstract colorful circular diagram with four distinct quadrants isolated on a green screen for motion graphic animation
00:09
HD
Abstract Isometric Puzzle Pieces Infographic Animation.
00:10
HD
Growth Share Matrix or Product Portfolio Matrix - Animation Illustration as MP4 file
00:10
HD
animated video scattered with the words ABSCISSA on a white background
00:11
HD
Animated Food Group Pie Chart Filling on Black Background
00:12
HD
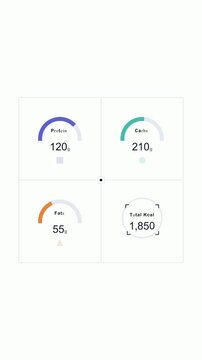
Grid layout dashboard showing macro nutrient gauges
00:10
HD
Risk and Profit Matrix Diagram Chart with Checkmark on Profit and Risk Animation on Solid Background and Green Screen
00:20
HD
Priority quadrant comparing effort and business impact in cobalt
00:10
HD
3D Earth globe popping against starry grid, rotating as charts and labels updating tracking trends
00:12
HD
On interface launch GUI panels animating while central node network growing visualizing data flow
00:15
HD
On data update, central radar chart processing inputs while data icons orbiting and charts updating
00:10
HD
Pulse starting central hub rotating, sweeping sector filling while right panels updating charts
00:10
HD
On data pulse, glowing red points descending, forming jagged line to represent falling market trend
00:10
HD
On startup glowing dollar sign and BANK pulsing, rings rotating, HUD updating to show finance
00:12
HD
Panels flickering launching rotating pale-blue holographic chart forming ring for visualizing data
00:12
HD
Particle cloud rising from right driving keypad grid aligning and numbers updating to show stats
00:12
HD
On launch radial HUD pulsing spinning rings graph rising turning green candles showing data
00:12
HD
Floating numbers appearing, planet rotating while bars rising left-to-right, showing market trends
00:12
HD
Dark grid dashboard presenting floating green energy icons inside white circles over quadrants
00:12
HD
On startup central blue globe scaling, rotating while HUD rings and charts animating to show data
00:10
HD
Priority quadrant comparing effort and business impact in teal
00:10
HD
Panama flag graphic being overlaid with colorful financial dashboards and charts in flat design
00:12
HD
Initial skew starting neon UI rotating, aligning, revealing self
00:15
HD
Flat design showing data area chart, bar chart, pie chart with EU stars on transparent background
00:12
HD
Camera moving, wire globe rotating, rods growing, links forming, showing network on transparent bg
00:09
HD
Binary streams cascading over input or output bars, selector appearing and rotating updating decimal
00:12
HD
Vertical video: Tiled bar chart animating on camera pan, bars rising, lines tracing market trends
00:12
HD
Neon hub emitting beams, particles moving, icons pulsing, showing data flow on transparent canvas
00:15
HD
Starting white bars rising on grid, splitting quadrants, overlaying line graphs highlighting trends
00:11
HD
Four clocks, one in each quadrant, counting down the moments until 2026. The phrase SELF MADE 2026 appears on each clock face, emphasizing the concept of financial independence
00:12
HD
Animated Food Group Pie Chart on Blue Background
00:12
HD
Animated Food Group Pie Chart Filling with Healthy Food Icons
00:12
HD