Il collegamento per impostare la password è stato inviato a: La password sarà necessaria per accedere in futuro ai tuoi acquisti.
Crea senza limiti: download illimitati e potente modifica AI
Aggiunti nuovi filtri
Ordina per

5.517 risultati per histogram in video

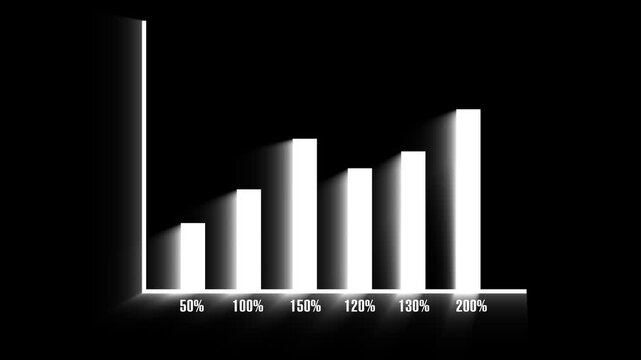
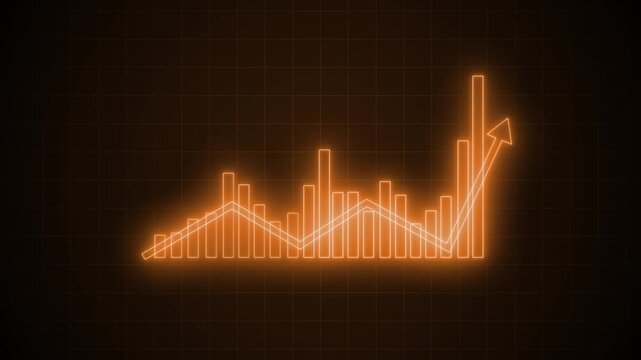
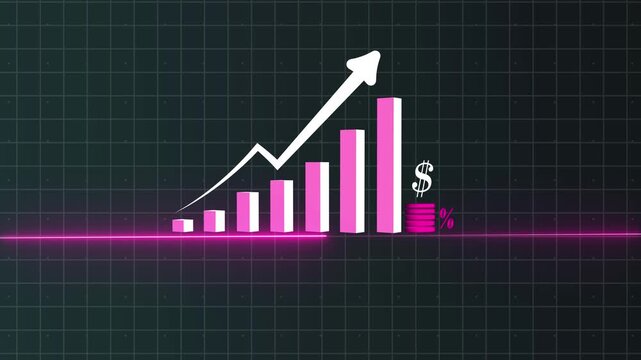
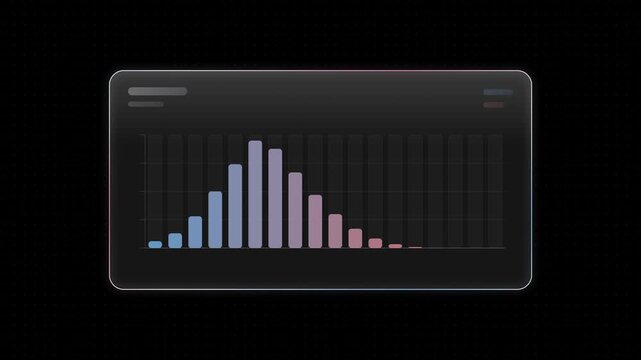
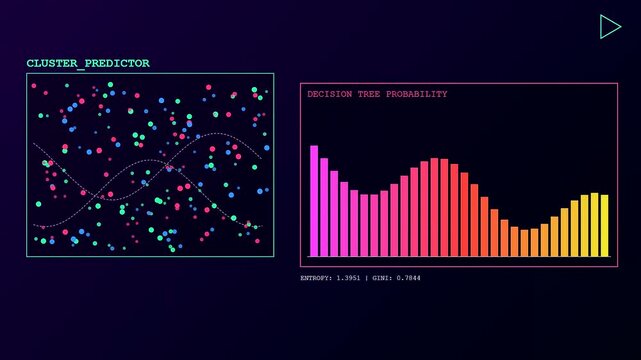
Neon-style histogram chart on black background with glowing edges, rising bars peaking mid-left then descending animation
00:05
HD
Animated dot histogram with stacked dots with alpha channel
00:10
HD
Volumetric diagnostics displayed on a neon digital interface with rotating data circles circular histograms and fluctuating spectral bars showing complex system monitoring in a dark environment
00:06
HD
A detailed AI model serving dashboard showcasing endpoints, requests, latency metrics, and availability status with an elegant color palette and animated visualizations.
00:15
HD
Thin lines tracing curved paths starting central brain shape linking charts showing data growth
00:12
HD
A dark mode histogram titled "User control Analysis" displays a distribution of data with various grey bars on a stark black background.
00:08
HD
95% percent Call out Pie Chart Animation. 100 percent circle loading icon pie chart diagrams. 100 percentage chart for finance, sales ,HUD Animated futuristic infographic with histogram
00:08
HD
Stock market trade horizontal histogram infographic element animation. E commerce strategy analytics. Animated chart graph. Dynamic data visualization on white background. HD video, motion graphics
00:09
HD
Line graph. Linear chart growth, business diagram graphs and colorful histogram graph isolated vector set
00:05
HD
Stock chart trading histogram global market, economic trends world and analysis invest financial business, futuristic exchange concept
00:20
HD
Laptop Screen Stacking Astrophotography Frames Generic Interface Blending Into Clean Nebula Image 4K Seamless Loop
00:15
HD
Clean animated histogram bins revealing density in cyan and teal on a bright white background. Seamless looping 4K dashboard motion graphics with free space for text, ideal for business presentations,
00:07
HD
A detailed LoRaWAN sensor network dashboard visualizing a large industrial site with KPIs, aerial map, and analytics in dark mode featuring vibrant color accents.
00:15
HD
Growth bar chart animation displays percentage values on grid. Corporate business revenue tracks on the growth bar chart. Profitable economic investment data drives the chart.
00:06
HD
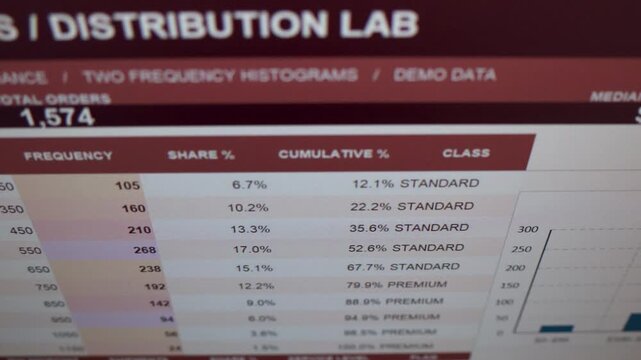
Sales Order Frequency Histogram on Screen Filmed with Camera A business monitor displays transaction class statistics and bar graphs showing order value distribution.
00:27
HD
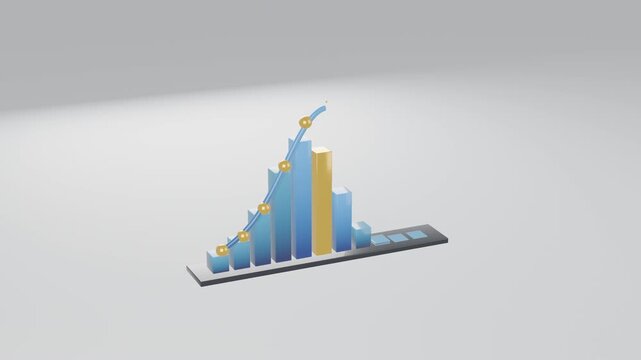
3D animation of a bell curve and histogram bar chart with blue columns, a highlighted gold peak bar, and golden data points on a white studio background, symbolizing normal distribution and statistics
00:15
HD
Modular Camera Hud with Six Fixed Information Modules, Exposure, Audio, LUT and Histogram Controls on Transparent Background for Video Editing. 4K
00:15
HD
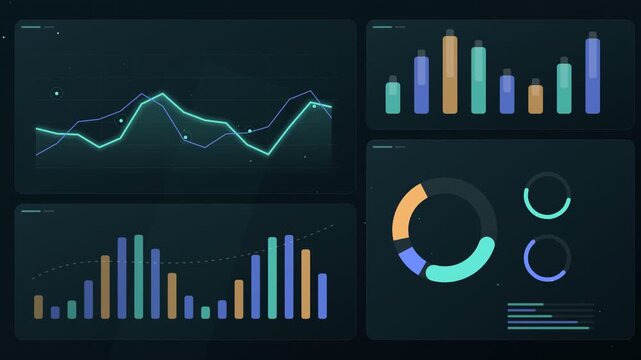
Four panel dark dashboard with dual line chart capsule bar chart histogram and donut gauges
00:10
HD
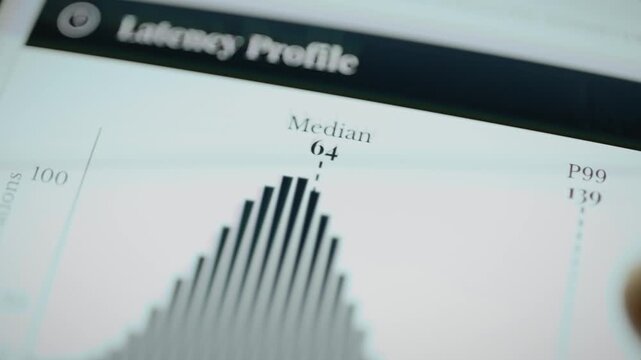
Latency histogram updates median and tail percentile markers
00:10
HD
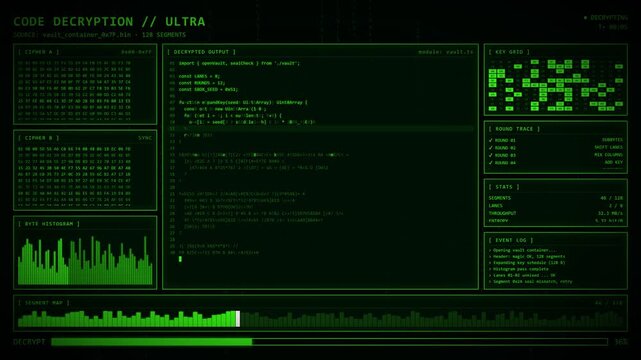
Green Code Decryption Ultra Byte Histogram Round Trace Segment Map Console.
00:15
HD
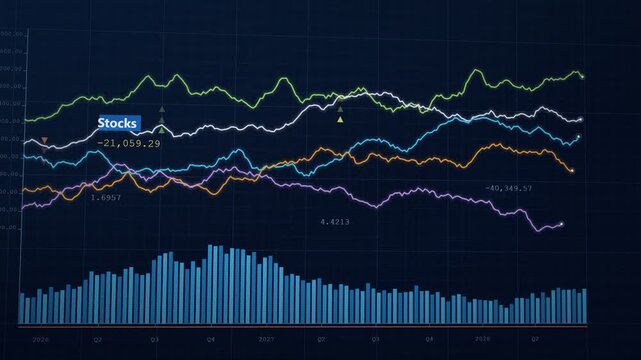
Stocks, bonds and real estate line charts over a blue volume histogram on deep blue, camera glides left to right, investment portfolio animation
00:14
HD
Neon-style histogram chart on black background with glowing edges, rising bars peaking mid-left then descending animation
00:05
HD
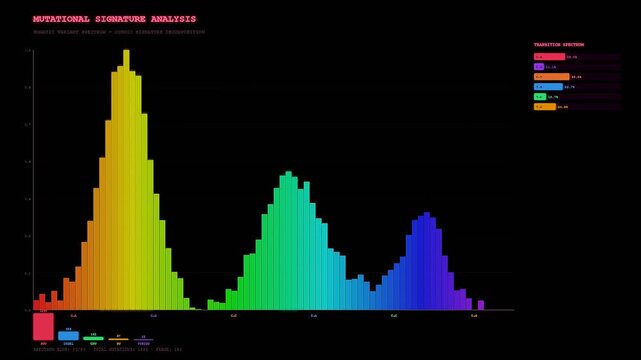
A complex motion graphic showcasing bioinformatics genome analysis illustrates mutational signatures using animated histogram bars that shift and grow across the screen in vibrant colors.
00:06
HD
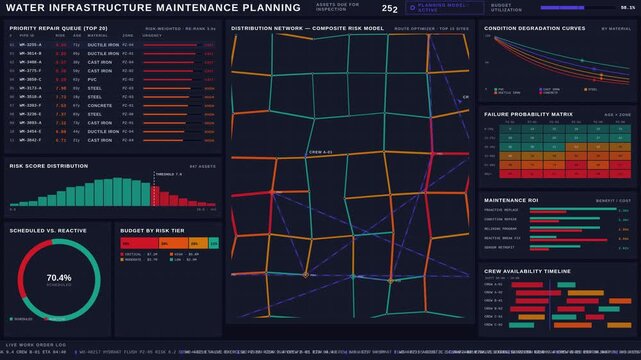
Explore the Water Maintenance Planning Dashboard showcasing pipeline repairs using asset risk scores in a sleek dark executive design with dynamic visual analytics and prioritization features.
00:15
HD
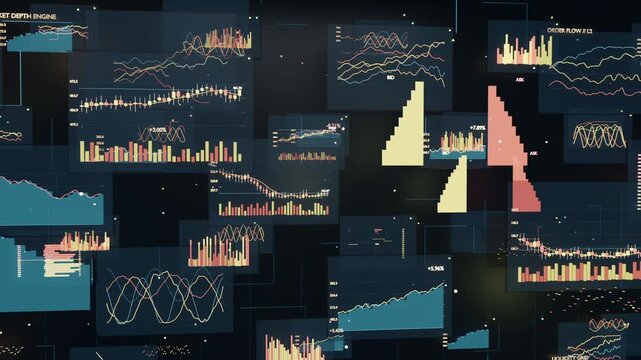
Animating data panels filling wall as frames advance, monitoring teal area, yellow red histograms
00:12
HD
A dark mode histogram titled "User control Analysis" displays a distribution of data with various grey bars on a stark black background.
00:05
HD
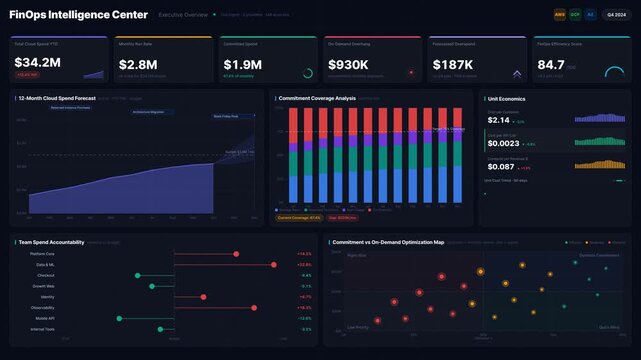
FinOps executive dashboard animation displaying cloud costs, forecasts, and unit economics in dark mode with 4K quality for commercial creative technology and business use.
00:15
HD
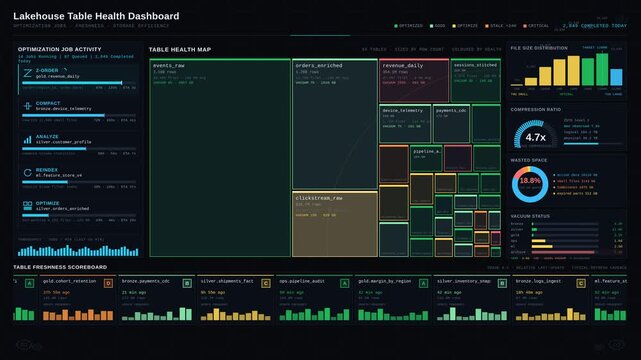
Explore a modern Lakehouse Table Health Dashboard showcasing optimization jobs, freshness metrics, and storage efficiency with a sleek dark aesthetic and vibrant color coding.
00:15
HD
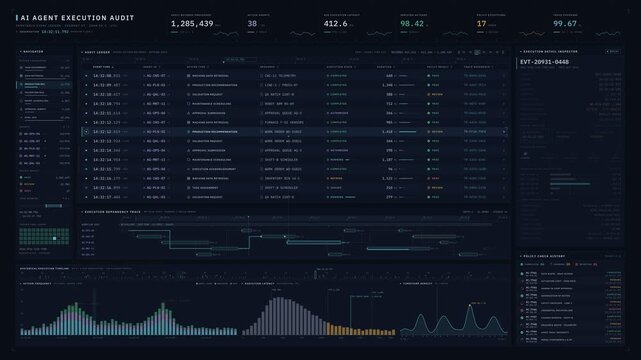
Premium enterprise AI audit dashboard animation tracking agent actions, execution timestamps, and policy validation in a dark interface. Features detailed ledger, trace timeline.
00:15
HD
Digital color histogram and waveform monitor interface on computer display davinci resolve
00:10
HD
Tracking camera diagonally revealing three-row neon-blue columns, showing histogram on dark grid
00:05
HD
Premium enterprise identity governance dashboard animation featuring dormant account cleanup, permission matrix, and security workflow in dark UI with cyan and amber accents.
00:15
HD
Data sampling distribution balance monitor with histogram bell curve stratum bars, for statistics, quality control, 4k machine learning performance data
00:20
HD
Cinematic 4K manufacturing command center interface displaying live production targets, equipment states, and factory topology with animated data visualization and industrial control room aesthetics.
00:15
HD
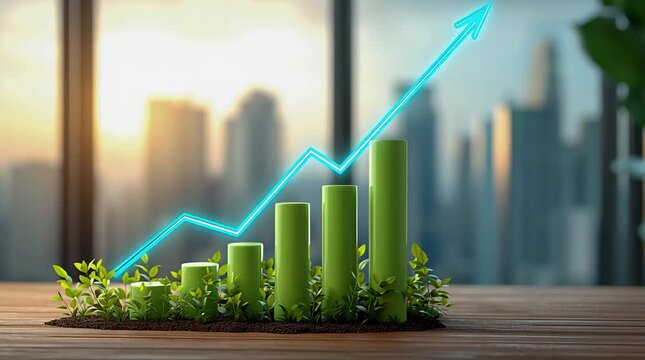
A green histogram of wooden bars growing out of leaves, with a glowing arrow pointing upwards against the backdrop of a blurred city.
00:06
HD
Line graph. Linear chart growth, business diagram graphs and colorful histogram graph isolated vector set
00:05
HD
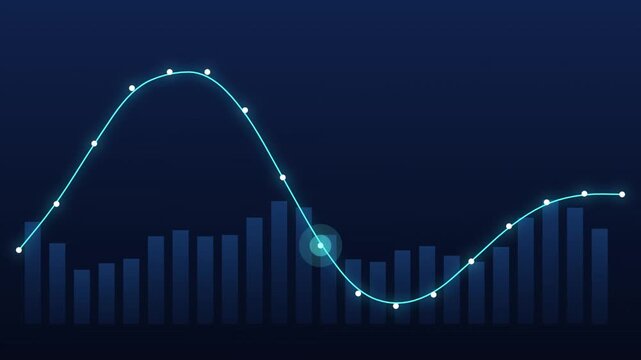
Futuristic digital stock market financial graph data visualization motion graphics animated glowing blue line chart with bar graph histogram for business analytics overlay dark background
00:10
HD
Professional digital photo editing interface with color adjustment curves a technical software display with correction and histogram adjustments photography
00:10
HD
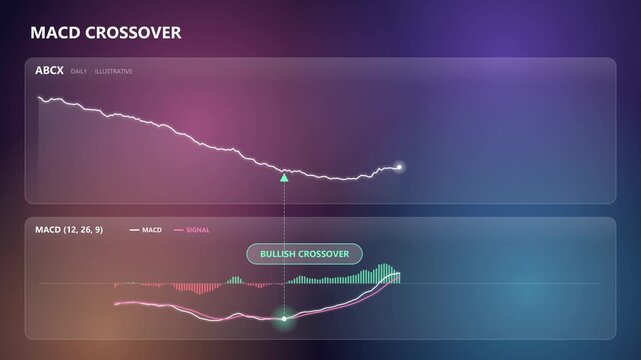
MACD bullish crossover on glassmorphism cards over drifting colour blobs with histogram turning positive and signal label
00:10
HD
Soft neon histogram for volume analysis
00:13
HD
Dollar Cost Averaging Investment Strategy Chart Buy Points Animation
00:15
HD
Neon-style histogram chart on black background with glowing edges, rising bars peaking mid-left then descending animation
00:05
HD
A sophisticated data dashboard featuring a dynamic predictive analytics graph with fluctuating curves, updating numerical metrics, and shifting histograms designed for advanced business intelligence.
00:06
HD
Circular histogram bars rotating around center
00:08
HD
Appearing chart panels on dark teal display, stacking into dashboard with histograms and waveforms
00:12
HD
Motion animated footage. Statistics bars columns growth, arrow up. Finance, Bar graph going up, Profit concept, positive increase chart. business graph animation
00:10
HD
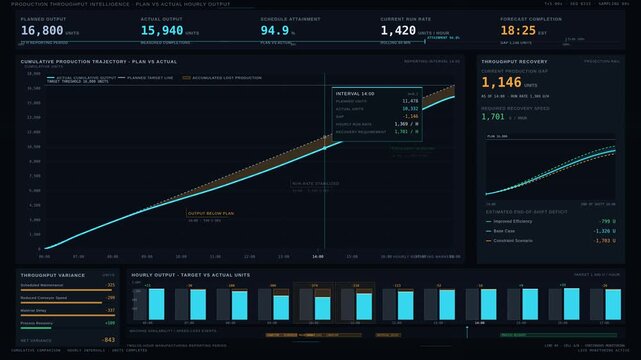
Cinematic 4K production dashboard comparing target throughput against actual hourly output with dark graphite interface, cyan traces, and industrial analytics.
00:15
HD
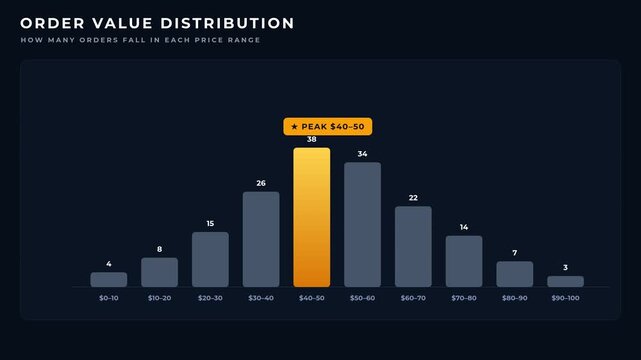
Animated order value histogram with a highlighted yellow peak
00:08
HD
Seamless 4K looping finance animation: return distribution histogram breathing bars. Flat vector trading terminal with grid, axis ticks and blank readout cards in deep blue on a deep dark background,
00:07
HD
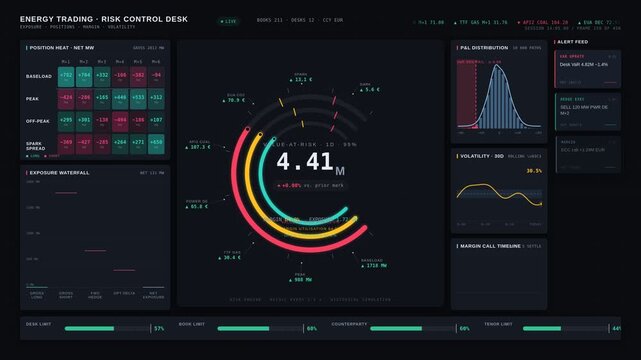
Energy trading risk dashboard monitoring exposure positions, margins, and volatility with dynamic radial gauges and heat grids on a dark interface for commercial creative technology and business use.
00:15
HD
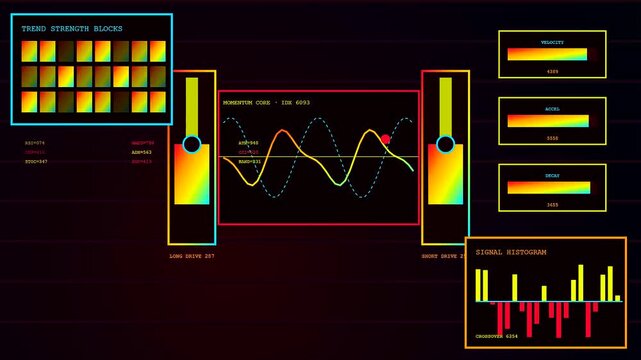
Three panels displaying algorithmic trading interface with neon grid lines and shifting data histograms indicating financial market volatility in a dark digital space for data analysis
00:06
HD
Nostalgic 1990s retro operating system file copy dialog with animated flying paper documents, cascading window shadows, dual progress bars, and throughput histograms in phosphor green and amber.
00:12
HD
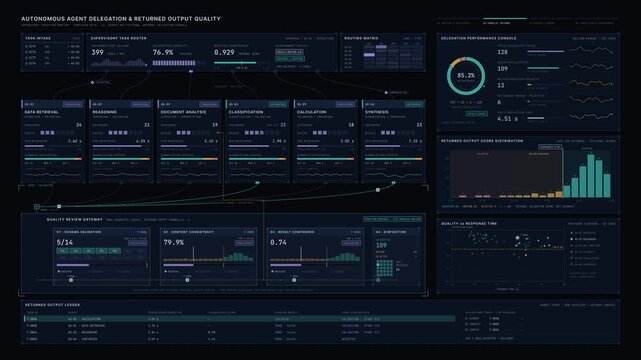
Premium autonomous agent dashboard visualizing task delegation, output validation, and quality metrics in a dark enterprise interface with teal and purple accents for AI operations monitoring.
00:15
HD
Symmetrical histogram bar chart graph bar animation
00:07
HD
Stylish glass user interface displaying inference latency with smooth animations, featuring a sleek black background, vibrant azure and rose rim accents, and a translucent panel showing histogram
00:15
HD
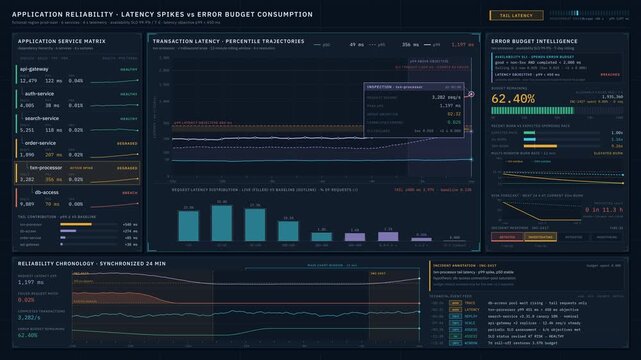
Cinematic 4K application reliability engineering dashboard visualizing latency spikes, SLO performance, and error budget consumption with evolving service-level analytics.
00:15
HD
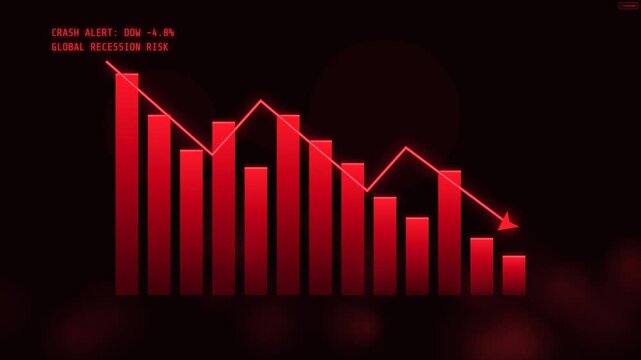
Dramatic financial crisis and market crash scene with descending red histogram bar columns, jagged plunging red fracture trend line, downward arrow, a.
00:06
HD
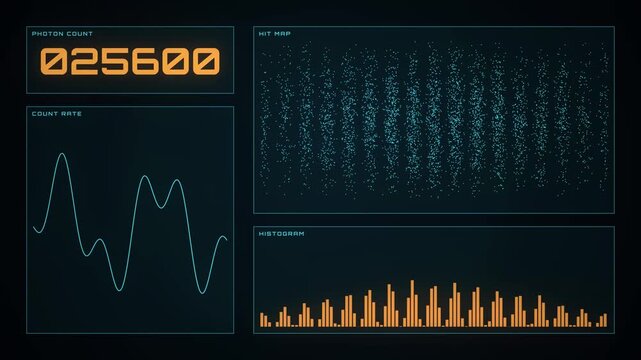
Scientific experiment data visualization showing photon counts, hit maps, count rates, and histograms over time
00:10
HD
Digital displays showing edge analytics with vibrant neon graphical nodes and data histograms moving across three partitioned screens in a dark interface for modern system monitoring
00:06
HD
A green histogram of wooden bars growing out of leaves, with a glowing arrow pointing upwards against the backdrop of a blurred city.
00:08
HD
Financial market data trend analysis with bar graph and circular UI an analytical interface showing blue wave lines and a red histogram chart, accompanied by a crosshair target
00:10
HD
Neon-style histogram chart on black background with glowing edges, rising bars peaking mid-left then descending animation
00:05
HD
A futuristic interface featuring a Predictive Analytics Graph animates complex data points and shifting bar histograms through a sleek neon spectrum on a dark digital background
00:06
HD
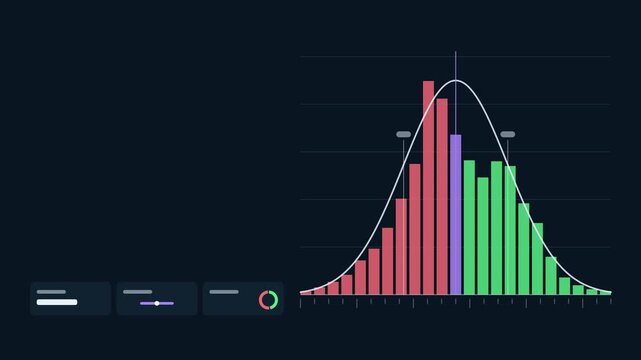
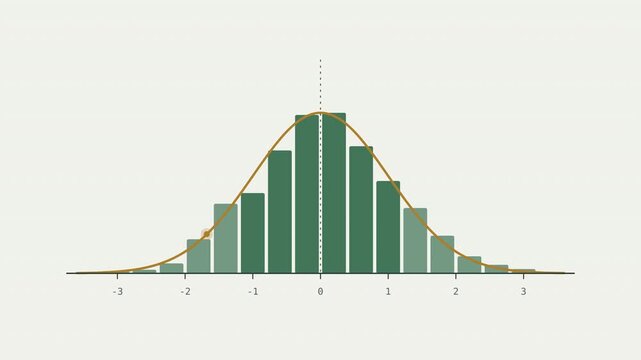
Animated histogram with bell curve overlay
00:10
HD
Camera revealing 3D market dashboard panels appearing histograms rising bars pulsing updating live
00:12
HD
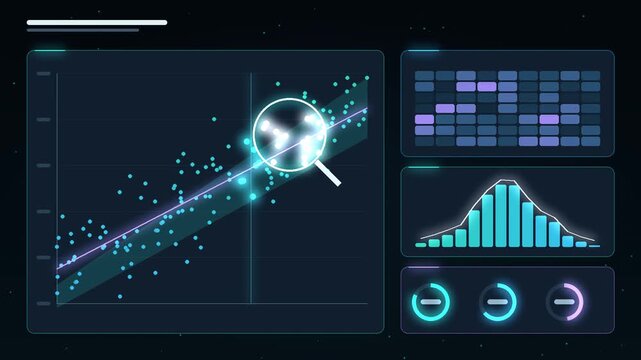
Research data analysis motion graphics, scatter plot with regression trend line and magnifying glass scanning data points, heatmap, histogram and progress rings, scientific statistics dashboard, text
00:12
HD
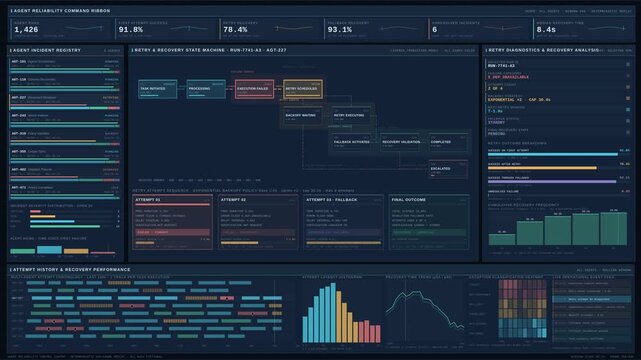
Autonomous AI agent reliability monitoring dashboard visualizing retry attempts, exponential backoff, and recovery outcomes in a sophisticated dark interface.
00:15
HD
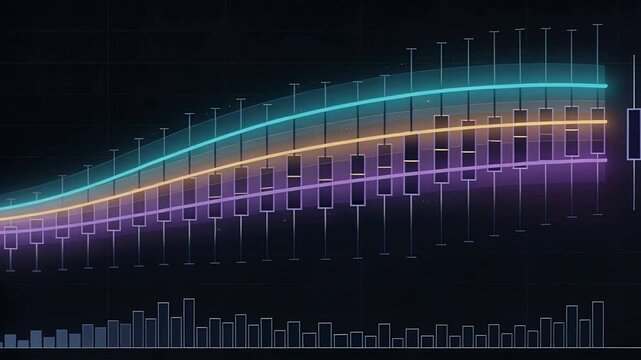
Data viz pulsing from new data on dark grid, showing 3 trend lines, boxplots or histogram gold burst
00:05
HD
A close-up shot of an RGB histogram graph monitor screen
00:12
HD
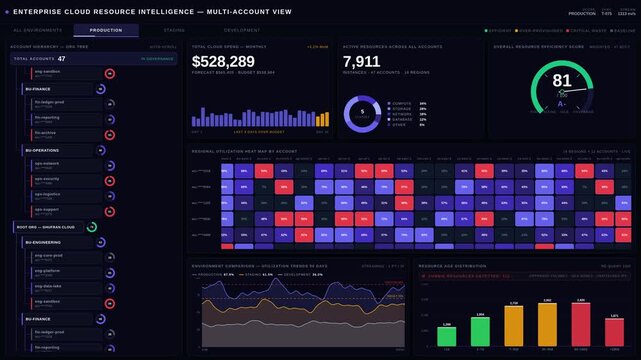
Enterprise cloud resource dashboard with multi-account views, regional heat maps, and utilization trends in a dark mode 4K interface for commercial creative technology and business use.
00:15
HD
A detailed vertical bar chart, resembling a histogram on a dark background, effectively illustrates the 'Distribution of Values' or frequency across discrete categories.
00:08
HD
Scatterplot displays data points, histogram shows distribution. Blue tones dominate, creating abstract visualization.
00:07
HD
An immersive 4K AI decision-space heatmap featuring dynamic color transitions, agent-cursor paths, and a real-time confidence-distribution histogram on a dark background.
00:15
HD
Enterprise cyber risk command center dashboard animation. Dark mode interface displaying incidents, vulnerabilities, and compliance metrics. Premium 4K loop for security operations and executive.
00:15
HD
Electricity price surge insights from power plant data and histogram representation
00:05
HD
4K dark-mode dashboard displaying interactive Gantt chart with resource load histogram and efficiency donut for production scheduling optimization. professional stock footage for technology,.
00:15
HD
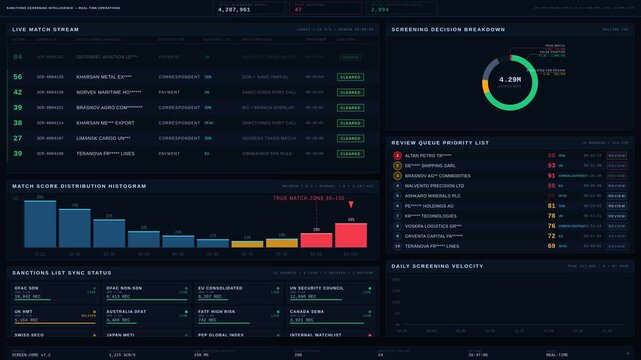
Explore a high-precision dark mode Banking Sanctions Screening Dashboard showcasing transaction matches, alerts, and review decisions in a sleek 4K layout with real-time updates.
00:15
HD
Financial diagrams - loop-ready fly through in HD
00:09
HD
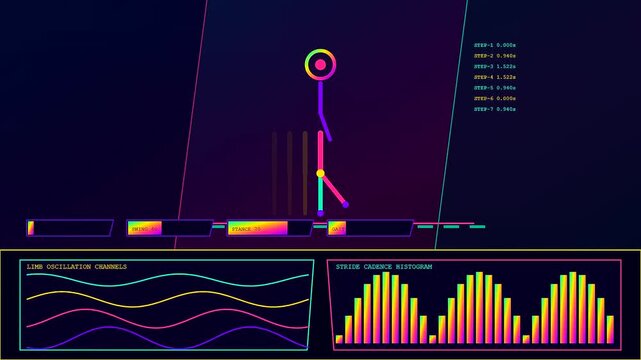
The biometric validate analysis displays moving stick figure skeletons with glowing limb oscillation data and cadence histograms within a dark digital interface for performance monitoring research
00:06
HD
Glowing 3D Histogram Bars Morphing Through Statistical Distributions With Data Particles
00:15
HD
Cinematic DevOps pipeline dashboard visualizing build stages, automated testing, and release performance metrics with dark technical interface for commercial creative technology and business use.
00:15
HD
Neon-style histogram chart on black background with glowing edges, rising bars peaking mid-left then descending animation
00:05
HD
3D colorful histogram in motion, loop
00:10
HD
Clean White Galton Board Simulation with Blue Balls Dropping into Gaussian Bell Curve Histogram, Probability Distribution Explainer for Math Lessons and Data Reports. Seamless Loop
00:14
HD
Camera moving forward, data corridor HUD panels sliding inward to assemble analytics dashboard
00:10
HD
Perspective futuristic user interface with HUD and infographic elements. Ultra detailed abstract digital black background. Charts and graphs, text area. Presentation template. Data visualization.
00:20
HD
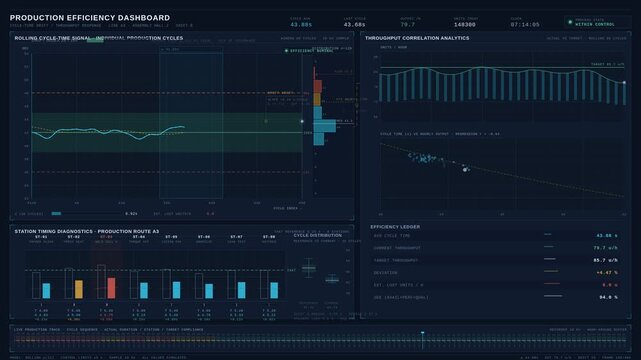
Dark mode industrial dashboard animation monitoring production efficiency, cycle time drift, and throughput changes with detailed signal plots and station diagnostics for manufacturing analytics.
00:15
HD
System update initiating wide monitor animating central telemetry ring at office desk with charts
00:05
HD
A close-up shot of an RGB histogram graph monitor screen
00:11
HD
Business Statistics, Market Data And Infographics Layout/ 4k animation of a set of design business and market data analysis and reports, with infographics, bar stats, charts and diagrams
00:14
HD
A detailed vertical bar chart, resembling a histogram on a dark background, effectively illustrates the 'Distribution of Values' or frequency across discrete categories.
00:19
HD
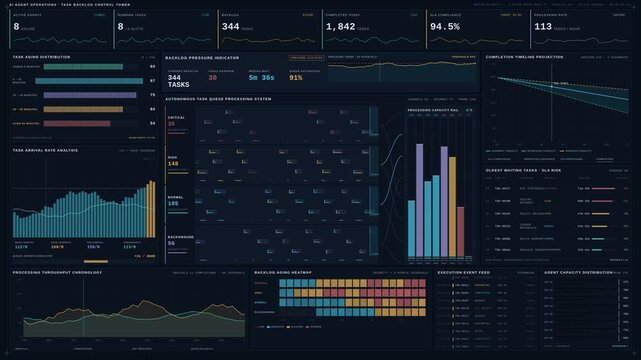
High-end AI operations dashboard monitoring autonomous task backlogs, processing queues, and completion timelines with dynamic 4K enterprise visualization.
00:15
HD
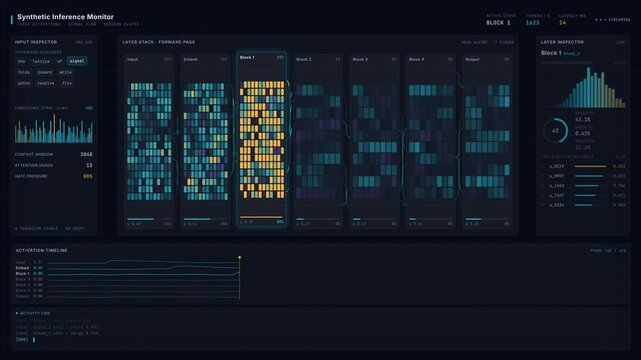
Explore an Interactive AI Neural Network Visualization Dashboard with Dynamic Layer Activations and Signal Flow in a Dark Premium Enterprise Style for commercial creative technology and business use.
00:15
HD
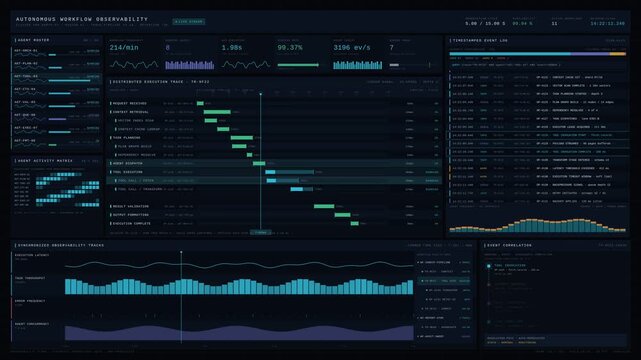
Cinematic autonomous workflow monitoring dashboard featuring distributed execution traces, timestamped logs, agent activity, and real-time system reliability metrics in dark UI.
00:15
HD
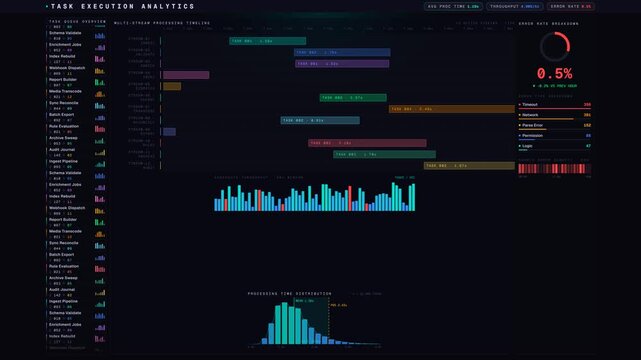
Explore an advanced automated task execution dashboard visualizing processing time, throughput, and error rates in a sleek dark mode design with animated metrics and charts.
00:15
HD
A hand of business man point to data histogram tablet illustration design
00:10
HD
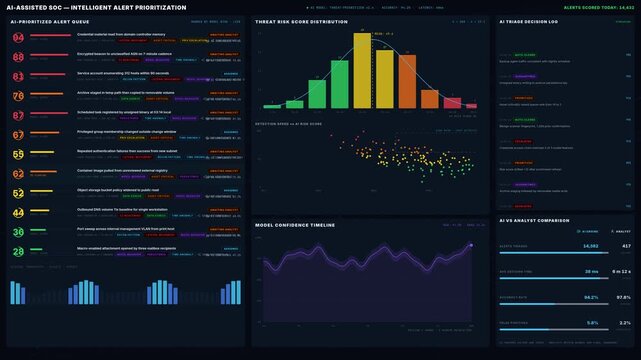
Premium dark mode AI SOC dashboard animation visualizing automated threat risk scoring, prioritized alert queue with confidence rings, and live model performance metrics in a futuristic security.
00:15
HD
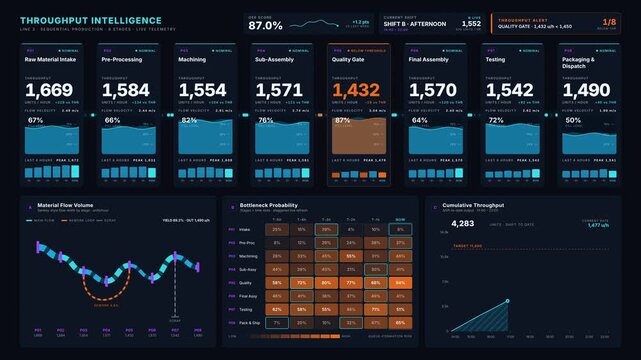
4K manufacturing throughput dashboard animation tracking material flow through sequential production stages with real-time data visualization for commercial creative technology and business use.
00:15
HD
Neon Line Graphs and Bar Charts Display a Dynamic Market Trend Scene.
00:08
HD
grafico economia, istogrammi, statistiche. Grafico progresso. 4k
00:06
HD