Il collegamento per impostare la password è stato inviato a: La password sarà necessaria per accedere in futuro ai tuoi acquisti.
Crea senza limiti: download illimitati e potente modifica AI
Aggiunti nuovi filtri
Ordina per

243.229 risultati per graph statistic in video

financial statistics graph rising prices in stock market and inflation rate
00:15
HD
GDP growth economic indicator chart with rising bar graphs and HUD radar
00:15
HD
Business growth data graph showing financial success and rising statistics over blue digital grid background.
00:30
HD
Animation of multiple charts visualizing the analysis of large amounts of data
00:14
HD
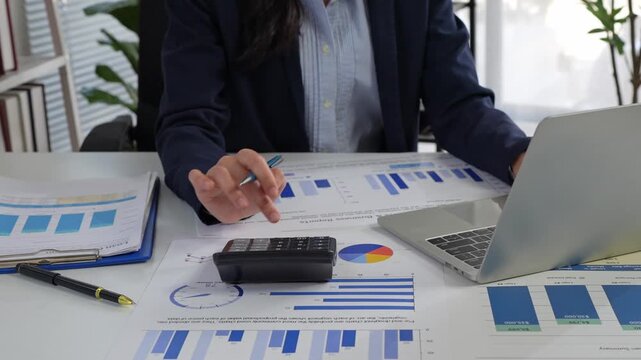
Businesswoman calculating finances and analyzing business data
00:14
HD
A vibrant red bar graph with a sharp upward trending curved arrow against a solid black background representing financial success and economic advancement
00:10
HD
Stock Market Chart, Beautiful 3d Animation of Japanese Candlestick Graph in Time Lapse. Seamless Looping Ultra HD 4K 3840x2160
00:30
HD
Bar graph animation with dashed line. Bar graph blue upward trend on grid. Bar graph business statistics graphic on black background for performance tracking.
00:11
HD
Financial chart with uptrend line graph and world map and graph chart of stock market investment trading concept
00:20
HD
Top down aerial view of professional businessman analyze stock market chart with tablet with investment graph placed at table while investor group pointing at tablet. Creative business. Directorate.
00:16
HD
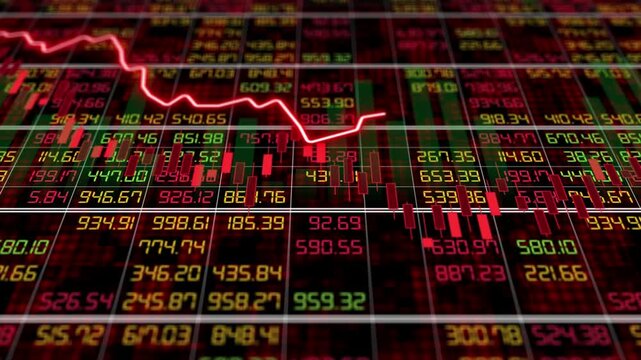
Stock market ticker terminal screen showing multiple live trading graphs and financial charts
00:30
HD
AI SEO assistant data, Futuristic digital finance growth chart data analysis technology background neon green glowing line graph stock market business success trend
00:06
HD
Neon Glowing Upward Growth Graph Chart on Black Background Minimalist Concept
00:08
HD
arrow rising transparent channel. Abstract arrow growth chart of economy icon black color animated down. business line animation. Abstract glowing neon line business graph growth arrow
00:10
HD
Digital data graph with glowing blockchain network and modern finance technology background
00:10
HD
Futuristic digital interface with glowing graphs illustrating comprehensive financial market analysis and real-time trading data trends for strategic economic forecasting
00:10
HD
Business growth concept in allusive graph chart showing marketing sales profit increasing to target . Excellent financial status of corporate business rise up.4k animation video graph
00:10
HD
Dedicated financial analyst reviewing rising market trends and stock fluctuations on multiple glowing digital screens within office animation video footage
00:05
HD
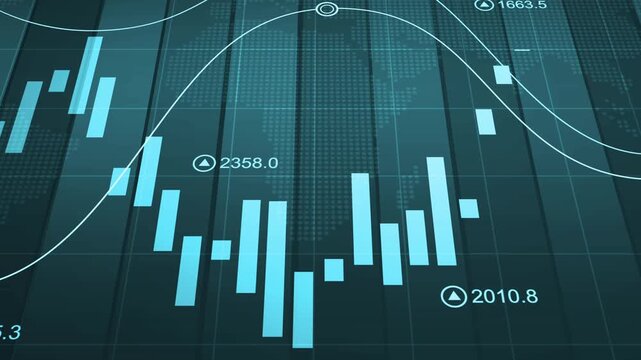
Stylized financial chart with candlesticks animation, bar graphs and line plot on black background
00:12
HD
Financial Stock Chart Market Analysis Data Visualization financial data trends, price movement, analytics indicators. trading visuals, investment strategies, economic reports, fintech presentations.
00:20
HD
Declining bar chart with downward trend, Blue bar chart with falling line graph decline in business data, finance performance and analytics animation
00:07
HD
Analytics dashboard interface showing revenue charts user metrics and traffic data visualization
00:10
HD
Accountant analyst in office reviewing computer data. Screen shows charts graphs and a financial report as coworkers talk nearby in a bright workspace. Simple concept of finance analysis.
00:09
HD
Business team meeting at office desk analyzing charts and financial reports, hands using calculator and tablet for planning and strategy.
00:13
HD
Business team analyzing financial data and marketing strategy
00:20
HD
Business, people and meeting with handshake in office for agreement, celebration and finance deal. Women, shaking hands and team with applause for partnership, achievement and financial negotiation
00:11
HD
Stock Market monitor screen while open market for trading sell and buy stock online. Business economic and finance concept.
00:22
HD
Stock market candlestick chart hologram on digital world map,global financial index analysis,business economy investment.Global market analysis world map with stock market graph overlay animation
00:15
HD
Close-up of financial charts displaying stock market data on a digital screen. Dynamic red and green graphs represent fluctuating stock prices in a modern trading environment.
00:10
HD
A cheerful woman wearing a virtual reality headset interacts with engaging data visualizations, highlighting the intersection of technology and content marketing. Raster
00:15
HD
Business stock market trading graph growth chart concept Infographics animation rising up arrow. Futuristic Data Analytics Dashboard statistics finance visuals business reports, marketing sale profit
00:15
HD
AI SEO assistant data, Financial growth stock market business chart green arrow success investment profit digital graph upward trend economy business growth chart financial
00:08
HD
Smart city skyline of Chicago showing futuristic financial data, stock market infographics, business analytics, big data visualization over urban landscape
00:06
HD
Finance growth chart graph stock market upward data analysis business abstract background with rising green line over bar graph showing market trend investment statistic concept digital chart
00:10
HD
Oil Industry Growth Visualization with Graphs and Icons
00:10
HD
Close-up of a stock market graph with red and green candlestick charts on a dark grid background with a cinematic lighting effect conveying a sense of financial analysis and trading
00:05
HD
Hands working on a smartphone while graphs and icons are displayed on a screen representing data and analytics in business settings
00:10
HD
Business graph with percentage, shopping discount and tax adjustment concept, interest rate changes to fight inflation, investment return, Bar Chart Animation 2040 with Rising Arrow, 4k quality graph
00:09
HD
Businessman touching on hologram digital dashboard overlay showing graph charts, map and growth data animation, Holographic modern business analytics, finance planning and market performance
00:10
HD
Businessman analyzing multiple financial charts and stock market data on large screens.
00:05
HD
Top Down View of Businesswomen and Businessmen Meeting Around Office Desk With Laptops and Reports as Linked Visualization of Glowing Icons Statistics, Cybersecurity, SAAS and AI.
00:07
HD
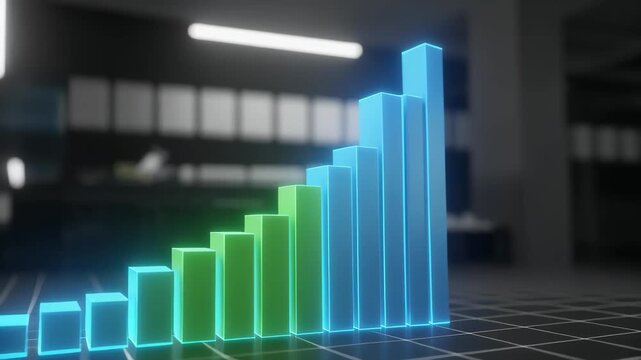
Glowing bar graph rising showing financial growth and success in a modern digital environment chart business
00:06
HD
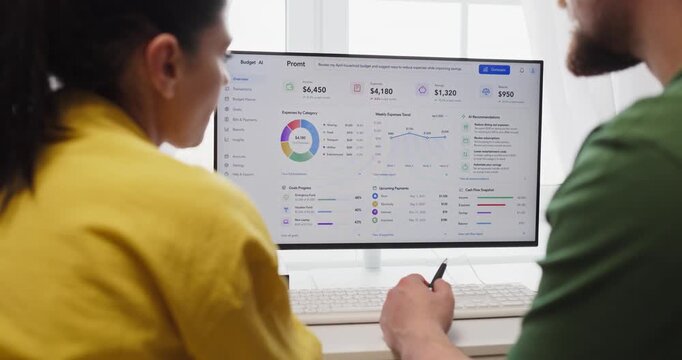
Couple budget planning on finance dashboard online. They review savings and monthly expenses on a computer at home using charts analytics for smarter choices. Clear concept of home finance teamwork
00:08
HD
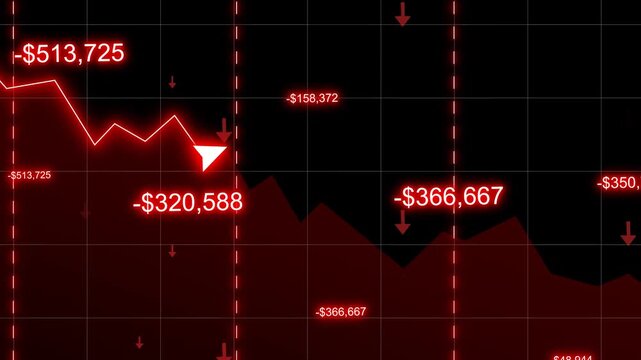
Financial Loss Graph Animation Showing A Dramatic Stock Market Crash With Falling Red Chart Line, Negative Dollar Values, Downward Arrows. Concept Of Economic Recession, Volatility, Investment Failure
00:19
HD
Downward trend graph animation video on a white background
00:06
HD
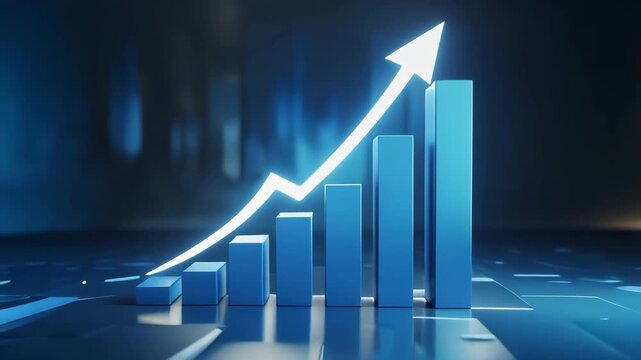
3D bar graph with an upward trending arrow indicating financial growth and success business finance
00:05
HD
Neon business graph chart icon animation background. Neon business growth concept. Glowing neon business graph chart icon animation background
00:10
HD
Animated bar chart graph rising and falling financial animation
00:12
HD
Rising increase index broker progress report, diagram graph management strategy rate chart global target economic, statistic stock financial trade investment analysis finance
00:20
HD
Close-up of hands typing on a keyboard with a digital graph overlay showing upward trends, symbolizing business growth and the influence of technology in data analysis. Copula
00:10
HD
Hand-Drawn White Growth Line Graph 2D Animation on Green Screen | Animated Success Arrow Asset | Minimalist Business Motion Graphic
00:06
HD
Digital analytics data background, glowing blue lines, dots, graphs, network. Represents business intelligence, financial growth, technology, innovation. Concept of big data, global communication

00:20
HD
Abstract neon arrow business graph chart icon animation background. Market Recovery Concept. animation
00:10
HD
Digital line graph tracks upward moving corporate revenue. Interactive line graph demonstrates successful financial forecasting. Economic growth concept with corporate line graph.
00:10
HD
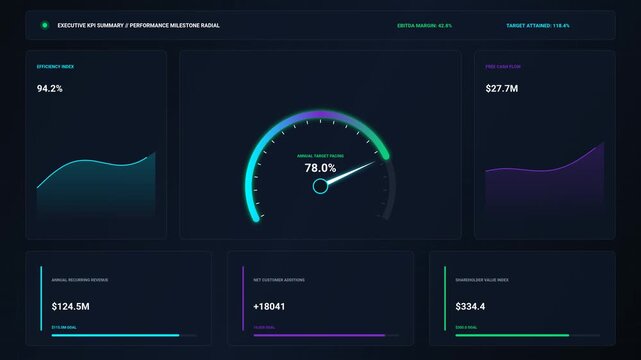
Modern Business Intelligence KPI Dashboard with Radial Performance Gauge
00:10
HD
Close-up of female hand with pen writing on paper, using calculator with laptop on desk. Business, finance, accounting and tax planning at home or office.
00:13
HD
Motion animated footage. Statistics bars columns growth, arrow up. Finance, Bar graph going up, Profit concept, positive increase chart. business graph animation
00:10
HD
neon business graph growth concept animation. Business growth concept on graph chart showing growth of marketing sales profit up to future target.neon line graph animation video
00:10
HD
Animated bar chart with rising trend arrow showing business growth and financial success
00:05
HD
Glowing neon Success stairs sign with flag icon animation  Neon glowing Person Climbing Stairs Towards Success flag, Glowing neon business graph chart concept. on black background ,4k video
00:10
HD
Over-the-shoulder View of a Male Trader Working at a Multi-monitor Desk Displaying Stock Exchange Data, Equity Charts and Market Analytics for Investment, Capital Growth. Asset Management Company
00:06
HD
Motion animated footage. Statistics bars columns growth, arrow up. Finance, Bar graph going up, Profit concept, positive increase chart. business graph animation
00:10
HD
 Artificial intelligence, check electronic documents on digital documents on virtual screen Document Management System
00:14
HD
Glowing blue holographic arrows pointing upwards on a digital grid floor representing financial growth business success and stock market rise
00:11
HD
Overhead arc shot of office team analyzing financial graphs and documents during collaborative corporate meeting
00:12
HD
Analysts teamwork discuss finance data and dashboard. Colleagues review charts on computer screens and printouts, aligning analytics with metrics. Concept image of collaborative office analysis.
00:11
HD
Blue animated business growth bar chart with rising trend line
00:10
HD
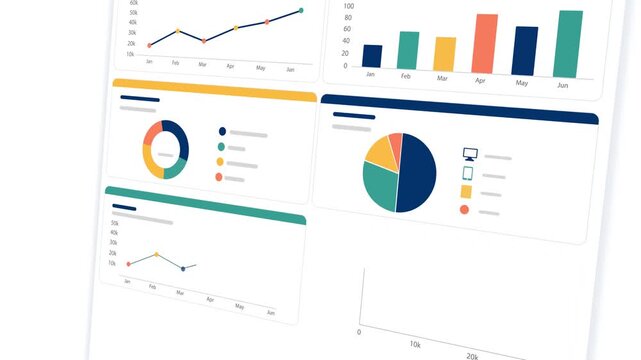
Business intelligence and financial performance analysis report on white background, animated infographic bar chart loop, investment data analytic graph dashboard, enterprise market statistics trend
00:14
HD
Depressed stock market loss and bankruptcy financial crisis recession, economic downturn, negative trading performance, investment risk crash, and business debt pressure concept
00:15
HD
A visually striking abstract digital background featuring graphs and data visualization over a sleek glass building facade, representing modern technology and finance development. Xenic
00:10
HD
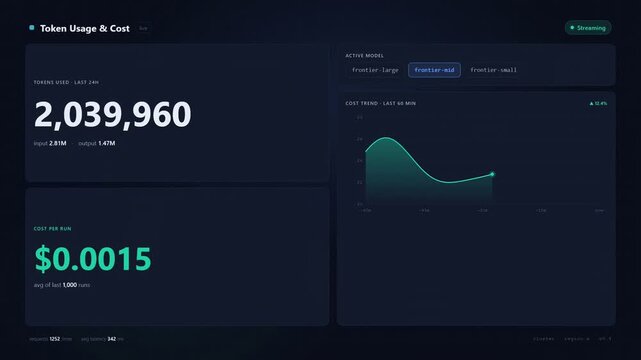
Real-Time AI Token Usage & Cost Dashboard. Monitor LLM API expenses, token consumption, and model performance with animated data visualization.
00:15
HD
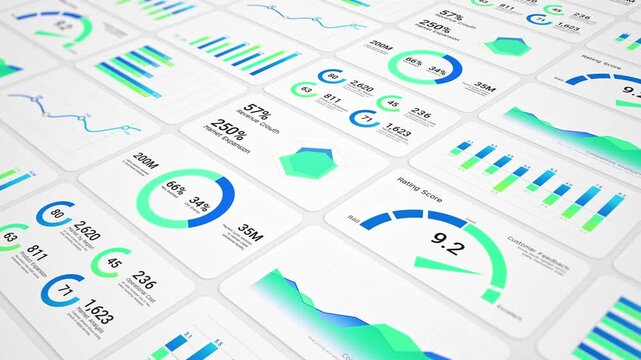
Modern Business Analytics Dashboard Animation with Multiple Data Visualization Panels like Charts, Graphs,  KPI Widgets, And Financial Statistics In A Clean Flat Design. Professional Website Metrics
00:49
HD
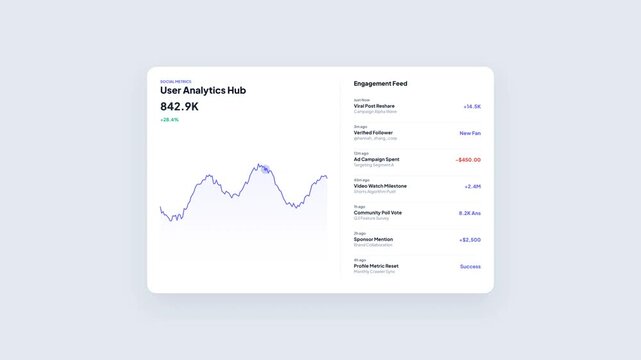
User Analytics Hub Marketing Social Performance Dashboard with Moving Line Graph Trend and Engagement Feed Activity Stream Notification Animation
00:08
HD
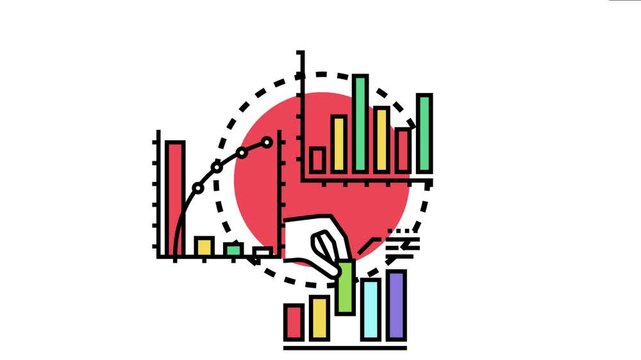
Hand placing a bar on a chart while displaying various types of graphical representations, concepts of data analysis, financial growth, and business strategy
00:17
HD
Growth, arrow up. Finance, Bar graph going up, Profit concept, positive increase chart. graph with rising up arrow and bar stats 4k video animation
00:10
HD
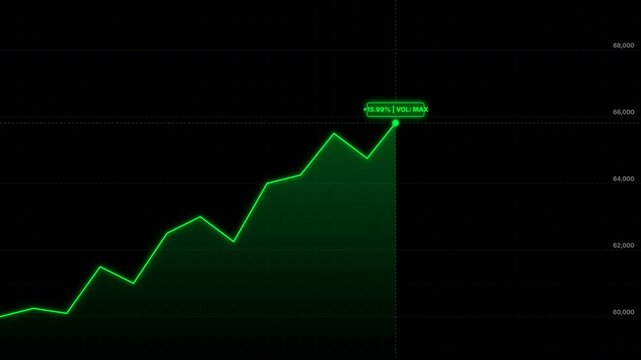
Financial stock market green line graph rising steadily in a digital animation video showing positive growth and high trading volume
00:10
HD
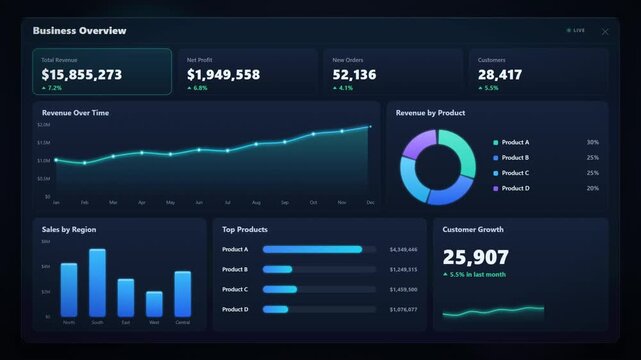
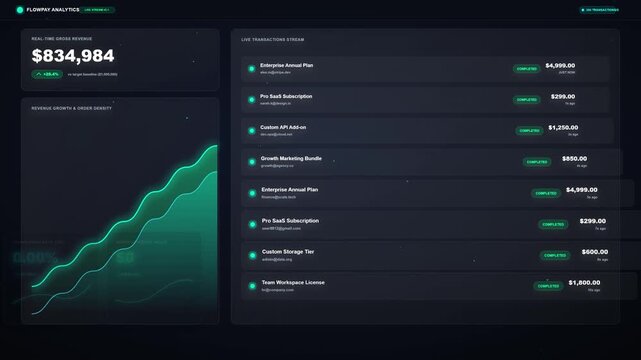
Business overview dashboard with revenue profit sales charts and KPI metrics on dark screen
00:15
HD
Growth, arrow up. Finance, Bar graph going up, Profit concept, positive increase chart. graph with rising 4k Animation video on white Background
00:10
HD
Animated horizontal line chart with glowing area fill showing positive business growth trajectory on dark background
00:08
HD
Business growth concept in graph chart showing marketing sales profit increasing to future target on black background.4k video
00:12
HD
Top Down View of Businesswomen and Businessmen Meeting Around Office Desk With Laptops and Reports as Linked Visualization of Glowing Icons Statistics, Cybersecurity, SAAS and AI.
00:07
HD
Health heart and body wellness charts and graphs diagram seamless and loopable 3d concept animation
00:15
HD
4K motion graphic of decreasing graph or stock market with transparent alpha channel. 2D transparency cartoon animation of red arrow falling down video isolated on white background.
00:05
HD
Business colleagues reviewing financial reports and analytics on a touchscreen tablet during a corporate meeting, collaborating on strategy and discussing growth opportunities
00:10
HD
business graph with arrow animation, Business Infographic bar animation, trading bar chart graph going up line. stock market business Profit concept, Business Success growth trending graph animation.
00:11
HD
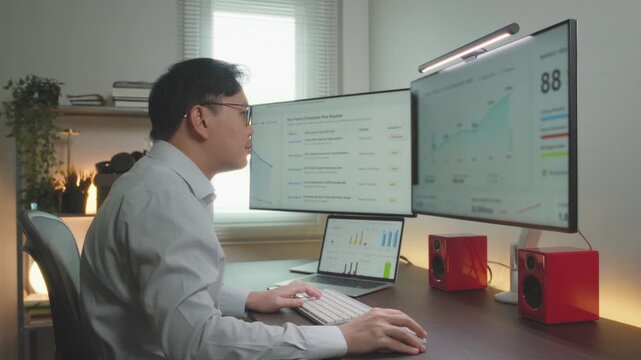
Analyst businesswoman reviews finance data reporting dashboard. She works at dual monitors reviewing charts, spreadsheets, and graphs for budgeting. Clear data analysis and financial reporting
00:10
HD
Industrial worker uses a tablet beside a computer monitor displaying colorful production data charts and performance dashboards in a factory office.
00:21
HD
Modern business data analytics dashboard animation showing high growth with 3D bar chart display
00:10
HD
Financial market chart with candlesticks and line graph, Abstract financial chart with candlestick bars and line graphs market analysis growth and data trends animation
00:10
HD
Futuristic Interface with Charts, Graphs, and AI Concepts Displayed on a Glass Screen While Someone Types on a Keyboard in a Modern Workspace Gluon.
00:10
HD
Data Analyst analyze Data Financial Dashboard and Touch screen Monitor.
00:13
HD
Business meeting with laptop displaying analytics dashboard charts, graphs in corporate office. Professional team presentation, data visualization statistics, performance reporting, strategy planning
00:09
HD
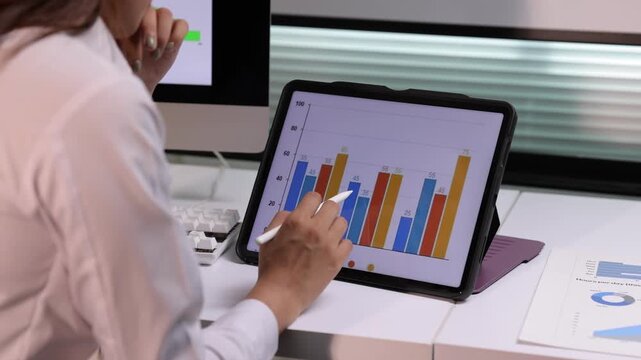
Financial analyst reviewing business performance data on tablet. Young female manager analyzing financial statistics and graphs on her tablet.
00:20
HD
On the stock market, 3d bar graph chart with up arrow, 4k resolution
00:10
HD
Heartbeat pulse line turning into rising upward arrow on white grid background
00:07
HD
Neon blue arrow graph rising with glowing line chart and lightning effects, dynamic upward growth visualization conveying energy and financial success neon blue arrow and glowing financial graph
00:10
HD
Data flow streams converging into a live analytics dashboard with radar chart, bar graphs and system load
00:16
HD
Abstract financial background with stock market graphs and an upward arrow, symbolizing business growth
00:10
HD
Reviewing business report on digital tablet
00:17
HD
Financial statistics graph rising prices in stock market and inflation rate - Animation Rendering
00:10
HD