Il collegamento per impostare la password è stato inviato a: La password sarà necessaria per accedere in futuro ai tuoi acquisti.
Crea senza limiti: download illimitati e potente modifica AI
Aggiunti nuovi filtri
Ordina per

900.822 risultati per chart in video

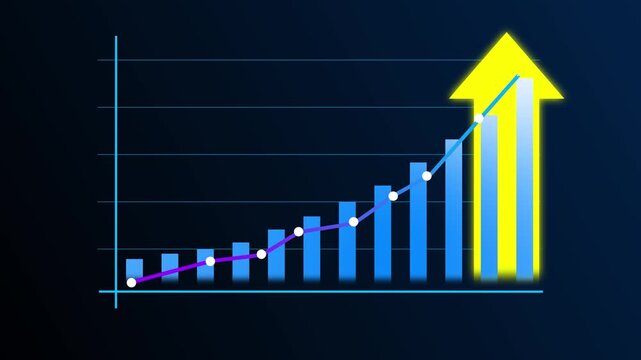
Blue arrow graph rising through digital bar chart during economic growth with dark background
00:05
HD
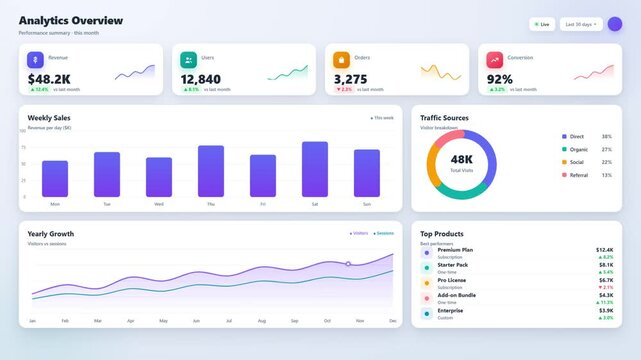
Analytics dashboard interface showing revenue charts user metrics and traffic data visualization
00:10
HD
Animated stock market chart on a black background.
00:30
HD
Analysts teamwork discuss finance data and dashboard. Colleagues review charts on computer screens and printouts, aligning analytics with metrics. Concept image of collaborative office analysis.
00:11
HD
Animated white bar chart graph with rising trend arrow on a clean black background, representing financial growth, business success, data, analysis, market expansion, and positive economic progress
00:10
HD
Digital line graph tracks upward moving corporate revenue. Interactive line graph demonstrates successful financial forecasting. Economic growth concept with corporate line graph.
00:10
HD
A dynamic close-up timelapse of candlestick charts rising and falling on a trading screen, reflecting market volatility and momentum
00:29
HD
Blue animated business growth bar chart with rising trend line
00:10
HD
Business profit income and capital charts and graphs diagram seamless and loopable concept
00:16
HD
Glowing dollar sign surrounded by financial charts and graphs
00:08
HD
Economic wealth performance concept, stock market investment chart showing price volume index, financial trading data analysis, profit and loss statistics, business growth
00:19
HD
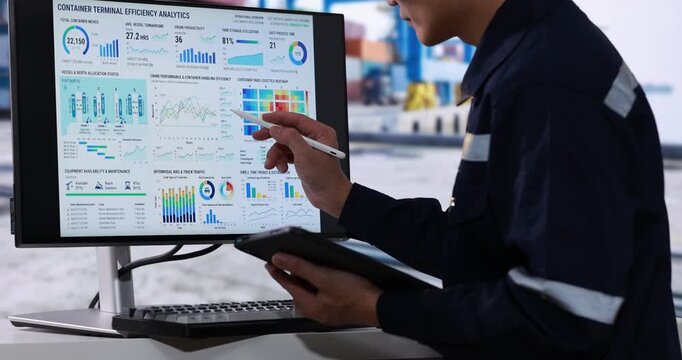
Industrial worker using a tablet beside a monitor energy efficiency charts and factory data in a modern control room.
00:26
HD
An illustration representing a digital organizational chart set in a modern office, showcasing team structure and collaboration among business professionals for strategic planning. Raster
00:20
HD
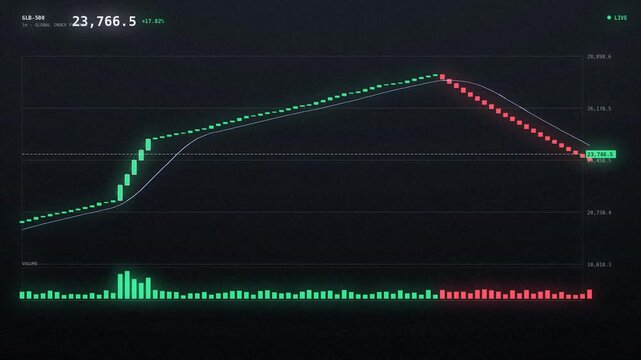
Financial stock market chart showing a strong bullish uptrend with green candlestick patterns on a dark digital interface
00:12
HD
4K glowing cyan line chart drawing rising trend animation on dark background
00:05
HD
Hand placing a bar on a chart while displaying various types of graphical representations, concepts of data analysis, financial growth, and business strategy
00:17
HD
Financial stock market chart showing green rising arrows with digital trading data represented by and numbers on a dark grid screen
00:06
HD
Stock market candlestick chart hologram on digital world map,global financial index analysis,business economy investment.Global market analysis world map with stock market graph overlay animation
00:15
HD
Business Stats Market And Infographics On Computer Screen
Animation of a business and market data analysis and reports with infographics layout bar stats charts and diagrams on a computer screen
00:14
HD
Zoom Out Top Down View: Diverse Team Of Business Professionals With Laptops Entering The Conference Room And Sitting Behind Table To Discuss Financial Data And Project Mindmap in Corporate Office.
00:07
HD
Close-up of a digital candlestick financial market chart with red and green bars. Trading and investment
00:12
HD
Animated horizontal line chart with glowing area fill showing positive business growth trajectory on dark background
00:08
HD
Dynamic 3D Bar Chart and Upward Line Graph Showing 48 Percent Increase and Significant Financial Growth for Business Analytics and Economic Progress Data Visualization on Black Background.
00:10
HD
Couple budget planning on finance dashboard online. They review savings and monthly expenses on a computer at home using charts analytics for smarter choices. Clear concept of home finance teamwork
00:08
HD
Neon Business chart icon isolated . business chart growth concept black background. Zigzag up right arrow with 4k video animation.
00:10
HD
Financial charts rising teal percentage seamless loop
00:15
HD
corporate structure hierarchy business organization chart animation
00:29
HD
Close-up of financial charts displaying stock market data on a digital screen. Dynamic red and green graphs represent fluctuating stock prices in a modern trading environment.
00:10
HD
Business team discussing financial charts and data on a digital tablet during a meeting in a modern office corporate strategy, and teamwork.

00:19
HD
Money transfer animation between two account cards, balances update and green sent checkmark appears
00:14
HD
Finance growth chart graph stock market upward data analysis business abstract background with rising green line over bar graph showing market trend investment statistic concept digital chart
00:10
HD
Digital Document Download Illustration Featuring Analytical Business Charts and Reports
00:10
HD
Hands typing on laptop with data charts and security icons overlay showing analysis, statistics, and technology insights in a dark modern workspace Gluon.
00:10
HD
Man, presentation and charts with review for team at office meeting, board and explain at finance company. Person, speaker and insight with graphs, feedback and collaboration at investment agency
00:20
HD
4K glowing gold line chart drawing rising trend animation on dark background
00:05
HD
Real time performance monitoring dashboard with animated bar charts and key business indicators.
00:11
HD
Stressed businessman silhouette facing financial market crash with red downward trend charts in this cinematic motion background video clip
00:05
HD
Abstract digital candlestick chart with global financial data background, perfect for trading, forex, crypto, and investment presentations. Financial Investment Background. 3d Rendering.
00:20
HD
Stock Market Analysis Magnifying Glass Over Financial Chart
00:10
HD
Display Bar trading graph financial stock market and investment, analytics chart with blue tones color and clean design on black background for overlay.
00:14
HD
Skyscrapers with upward-trending financial chart and rising arrow, symbolizing business growth, investment success and real estate asset value. Ideal for property investment, financial market concepts
00:14
HD
A dynamic close-up timelapse of candlestick charts rising and falling on a trading screen, reflecting market volatility and momentum
00:28
HD
Colorful Semicircular Data Visualization Infographic Animation with Multi Colored Progress Segments on Green Background
00:08
HD
Business people analyzing business growth chart and discussing company strategy
00:24
HD
Abstract digital financial data visualization with moving stock market charts and glowing numeric indicators
00:16
HD
Growing line chart graph - business development competition concept animation. Hi tech style charts with grid. Camera movement with depth of field.
00:15
HD
Rising Inflation and Interest Rates Financial Graph Animation
00:17
HD
Stock market chart showing growing trends on a digital screen
00:05
HD
Animated bar chart with rising trend arrow showing business growth and financial success
00:05
HD
Data flow streams converging into a live analytics dashboard with radar chart, bar graphs and system load
00:16
HD
Declining bar chart with downward trend, Blue bar chart with falling line graph decline in business data, finance performance and analytics animation
00:07
HD
Video animation of a moving candlestick chart in blue and red, showing how a price goes up and down, on a dark background, on a monitor. Volatility of investments (stock market, cryptocurrencies) - se
00:07
HD
Beautiful woman working as a hairdresser holding a hair color chart in a professional salon
00:05
HD
Senior insurance advisor showing financial charts and data on a tablet to a young female client during a professional office consultation.
00:12
HD
Project Manager Updates Agile Task List In Office Diary
00:28
HD
Black color arrow rising transparent channel. Abstract arrow growth chart of economy icon black color animated down to up arrow animation, on a white background, direction animation,with video.
00:06
HD
Modern Business Analytics Dashboard Animation with Multiple Data Visualization Panels like Charts, Graphs,  KPI Widgets, And Financial Statistics In A Clean Flat Design. Professional Website Metrics
00:49
HD
Slow Dolly-in Through a Stock Exchange Asset Management Firm, Where a Stockbroker Ceo Studies Live Charts, Weighing Banking Decisions, Strategy and Capital Growth for Corporate Career Success
00:13
HD
A monitor display showing the real-time movement of stock charts and financial instruments.
00:20
HD
Data visualization animation showing digital bar charts and abstract network nodes moving across white background in dynamic business video footage
00:10
HD
DDR5 memory modules installed on a high performance motherboard with glowing upward growth charts and analytics indicators. Concept of rising RAM prices
00:07
HD
Business Stats On Computer Screen
Technology textured business and market data analysis and reports with infographics layout bar stats charts and diagrams
00:14
HD
Set of infographic and data visualization elements for statistic and financial reports. Analytical dashboard with charts and diagrams  on white background. 4K animation.
00:06
HD
Falling stock market red chart
00:10
HD
Business professional creating organization structure chart with team hierarchy and workflow planning, representing human resource management, corporate structure and leadership strategy for infograph
00:10
HD
Smart city network showing big data communication and financial charts in downtown Chicago with futuristic digital overlay and information graphics connecting buildings
00:11
HD
financial statistics graph rising prices in stock market and inflation rate
00:15
HD
Seamless looped abstract visualization of financial data, price fluctuations, investment analysis and trading activity. Financial market interface with changing charts. Forex trading concept
00:10
HD
Dynamic business dashboard UI interface design vector illustration showing financial analytics charts and modern motion render graphics
00:10
HD
Colorful financial candlestick chart with blue, orange, and red bars showing market trends, data analysis, dynamic trading activity, investment insights, and trend lines for comprehensive market
00:10
HD
Financial market chart with candlesticks and line graph, Abstract financial chart with candlestick bars and line graphs market analysis growth and data trends animation
00:10
HD
 A stock market graph with an upward trend, indicating growth and potential for investment in the financial industry. The background is a digital display showing data points on trading charts
00:10
HD
Elegant woman and her colleagues working in office, top-management of company. Contemporary empowered women, career in old age, active life and work, senior ladies in boardroom, female professionals
00:07
HD
A young professional is examining investment data graphs and charts, analyzing financial information, and monitoring stock market trading reports.
00:38
HD
Financial graph chart, market report, arrow up trend chart stock exchange asset, diagram investment capital gain world money economic growth
00:20
HD
Glowing red neon downward graph with arrow indicating decline, loss, and negative trends on a dark, abstract background, perfect for conveying risk, crisis animation.Right-directional arrow loop.4k
00:10
HD
Business growth concept in graph chart showing marketing sales profit increasing to future target, growing business concept, hi-tech style technology chart with a grid, arrows axis, 4k animation
00:16
HD
Portrait of Male Investor Working at a Desk Analyzing Stock Exchange Feeds, Candlestick Charts and Investment Analytics on Computer Screens to Track Market Trends, Capital Growth
00:15
HD
Financial chart background with rising bar graph and candlestick market data showing growth profit and upward trend animation
00:10
HD
Stock Market Chart, Beautiful 3d Animation of Japanese Candlestick Graph in Time Lapse. Seamless Looping Ultra HD 4K 3840x2160
00:30
HD
Split screen financial comparison animation with green growth and red decline bar charts
00:15
HD
Neon-style bar chart showing descending bars with downward arrow animation
00:10
HD
Stressed Female doctor nurse sit by laptop computer while reviewing patient medical charts at the clinic office.
00:15
HD
Animated financial dashboard with glowing bar charts and upward revenue growth metrics
00:15
HD
Animated bar chart graph rising and falling financial animation
00:12
HD
Business intelligence and financial performance analysis report on white background, animated infographic bar chart loop, investment data analytic graph dashboard, enterprise market statistics trend
00:14
HD
Business growth concept in allusive graph chart showing marketing sales profit increasing to target . Excellent financial status of corporate business rise up.4k animation video graph
00:10
HD
Neon Business chart icon isolated . business chart growth concept black background right arrow icon.
00:10
HD
Animation of a glowing financial bar chart overlay on a black background. Digital trading dashboard UI element, stock market revenue and business growth concept.
00:10
HD
Minimalist Financial Growth Curve Chart on Black Background
00:10
HD
Business growth rising arrow animation. Financial Growth business chart concept. green business growth arrow icon animation on black background.
00:06
HD
Volatile stock market trading animation with glowing orange price chart, financial trend analysis, investment risk, market fluctuation and digital fintech business background video
00:08
HD
Stock Market and Global Economic Inflation with Interest Rates and Data Graph
00:15
HD
Businessman analyzing holographic financial charts on digital devices, Business professional using a smartphone and tablet with glowing hologram financial charts, data graphs and calculator.
00:09
HD
Arrow up trend chart stock exchange asset, diagram investment capital gain world money economic growth, financial graph chart, market report
00:20
HD
Businesswoman analyzing company financial data and growth chart on a computer dashboard screen in the office
00:20
HD
Asian manager talking phone reviewing charts office. Colleague passing document.
00:24
HD
Business data dashboard analytics with growth charts and revenue metrics animation
00:12
HD
Set of animated infographic elements.Market data analysis with light blue and grey infographics, charts and diagrams isolated on white background. 4K animation
00:10
HD
Growth up stock markets blue chart 3d loop animation. Success, rising business and financial graph, economy data diagram and money investment analysis loopable and seamless abstract concept.
00:15
HD