Un lien pour définir votre mot de passe a été envoyé à : Pour accéder à vos achats à l’avenir, vous aurez besoin d’un mot de passe.
Obtenez 10 images Stock avec un essai gratuit
Nouveaux filtres ajoutés
Trier par

105 249 résultats pour volatility chart dans tout

13 082 résultats dans les vidéos
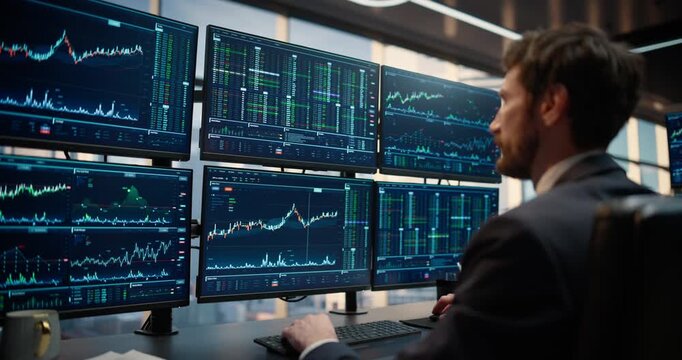
Slow Dolly-in Through a Stock Exchange Asset Management Firm, Where a Stockbroker Ceo Studies Live Charts, Weighing Banking Decisions, Strategy and Capital Growth for Corporate Career Success
00:13
HD
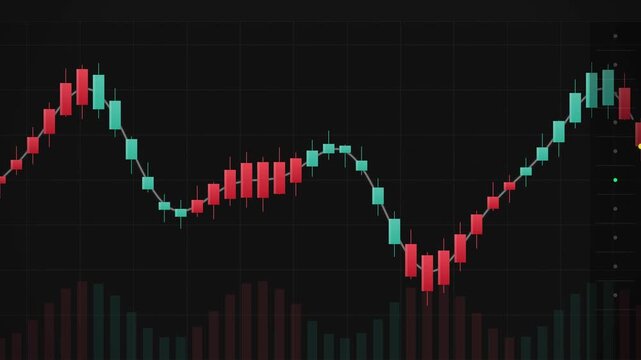
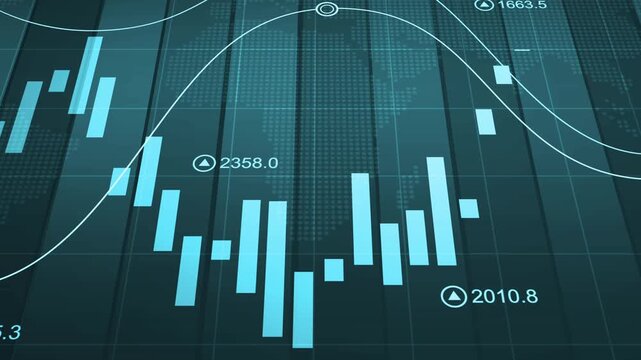
Financial candlestick charts showing market volatility on dark grid
00:15
HD
Digital charts global map rising market curves. financial technology, market volatility, economic research, portfolio analysis, trading dashboards, global growth, corporate strategy business news.
00:20
HD
Abstract stock market digital display showing green and red financial data, trading indices and stock price fluctuation charts
00:10
HD
Finance growth chart graph stock market upward data analysis business abstract background with rising green line over bar graph showing market trend investment statistic concept digital chart
00:10
HD
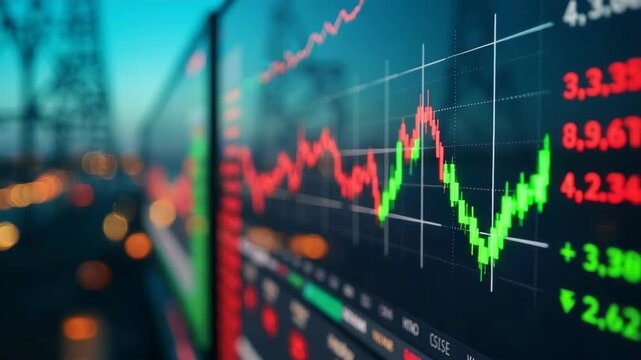
Close-up of financial charts displaying stock market data on a digital screen. Dynamic red and green graphs represent fluctuating stock prices in a modern trading environment.
00:10
HD
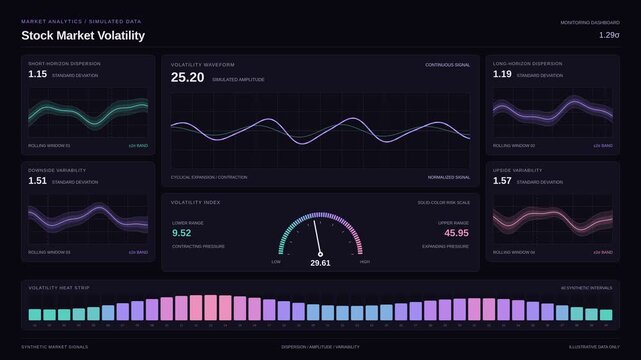
Stock market volatility dashboard showing financial data charts and digital gauge interface
00:15
HD
Person using smartphone with stock market charts on screen. Trader analyzing financial data on trading app. Concept of online trading, investment analysis and financial risk
00:12
HD
A dynamic close-up timelapse of candlestick charts rising and falling on a trading screen, reflecting market volatility and momentum
00:09
HD
Abstract digital candlestick chart with global financial data background, perfect for trading, forex, crypto, and investment presentations. Financial Investment Background. 3d Rendering.
00:20
HD
Abstract financial chart with glowing digital candlestick data points moving across dark screen representing stock market volatility investment analysis business growth and economic trends.
00:10
HD
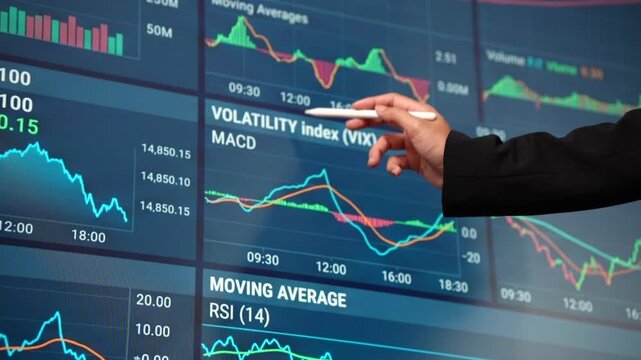
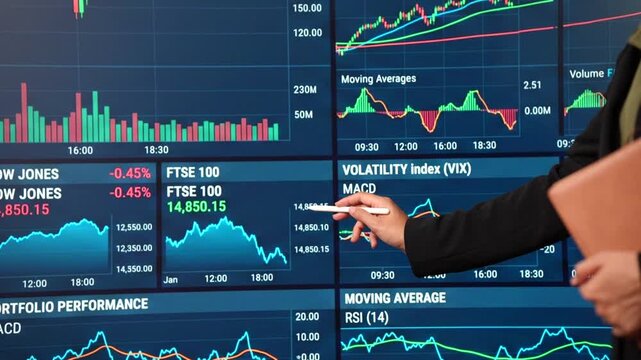
Businessperson pointing at digital financial charts showing stock prices, volatility index, macd and moving averages on a trading screen.
00:12
HD
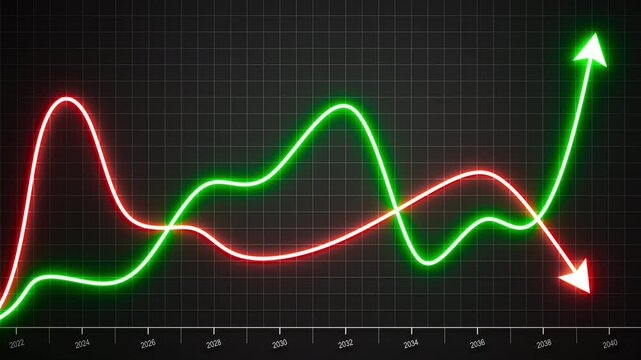
Looped 3D animation of green and red financial charts crossing over time, showing market volatility, growth and decline, investment trends, competition, economic change and stock performance.
00:10
HD
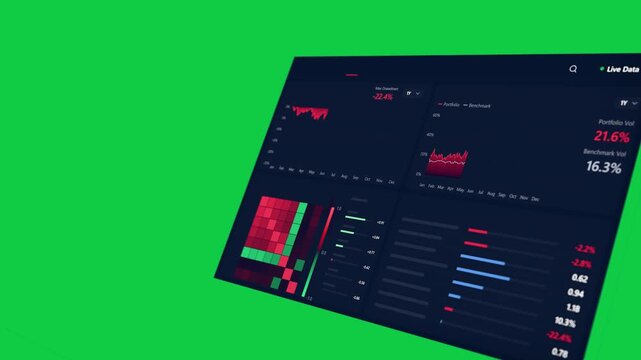
3D panel entering lower-right, rotating, revealing live volatility charts on transparent background
00:10
HD
Seamless looped abstract visualization of financial data, price fluctuations, investment analysis and trading activity. Financial market interface with changing charts. Forex trading concept
00:10
HD
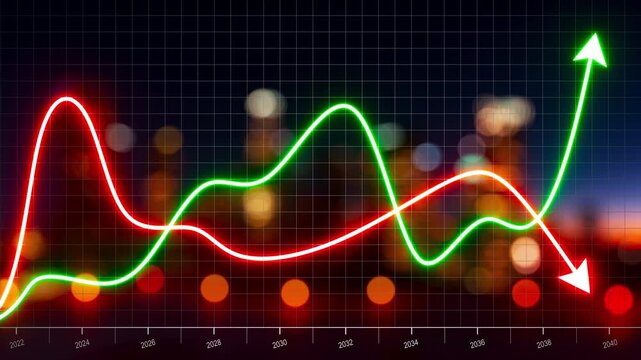
Looped 3D animation of red and green financial charts crossing over blurred city lights, showing market volatility, growth and decline, investment trends, competition and economic change.
00:10
HD
Glowing red neon downward graph with arrow indicating decline, loss, and negative trends on a dark, abstract background, perfect for conveying risk, crisis animation.Right-directional arrow loop.4k
00:10
HD
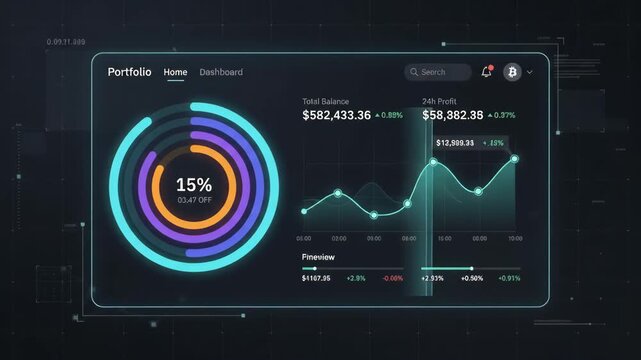
digital financial dashboard showing colorful circular charts with cryptocurrency market price fluctuations displayed against dark tech-themed interface background with grid lines and data nodes
00:06
HD
Business analyst points at digital market charts showing stock prices, trading volume, moving averages and volatility on multiple screens.
00:13
HD
Financial market chart with candlesticks and line graph, Abstract financial chart with candlestick bars and line graphs market analysis growth and data trends animation
00:10
HD