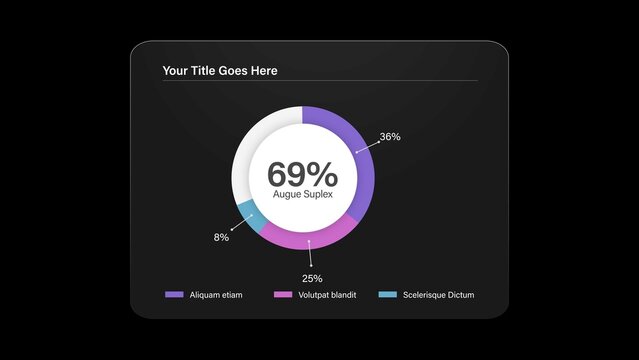
Colorful Pie Chart Infographic 1

Dynamic Pie Chart Layout
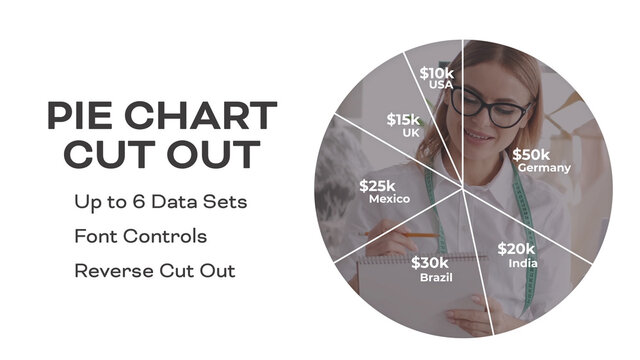
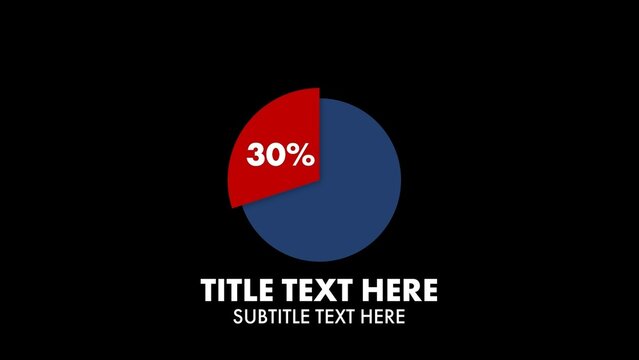
Cut Out Pie Chart

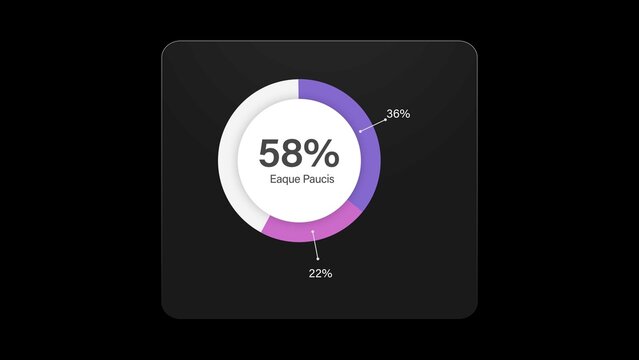
Animated Pie Chart 2


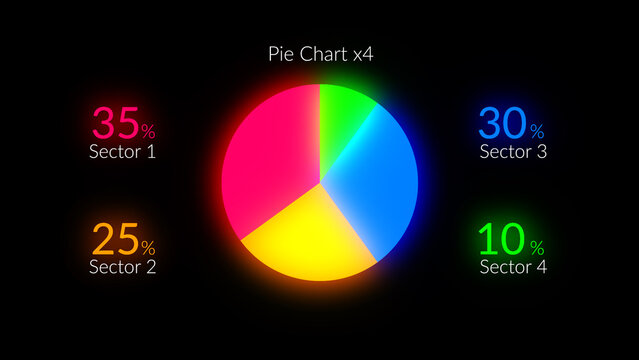
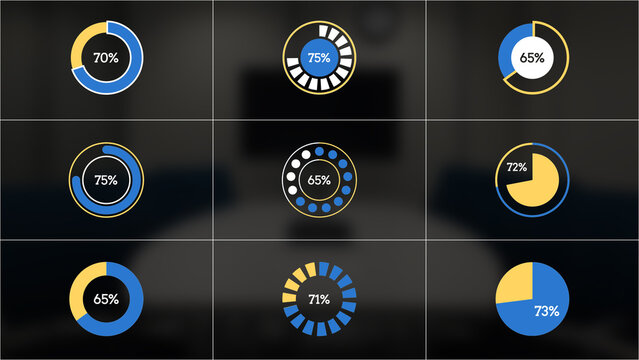
HUD Neon Infographics Pie Chart x4 – Futuristic Sci Fi Data Interface, Glowing Digital Dashboard Elements, Cyberpunk Analytics Charts, Tech UI Visualization Pack


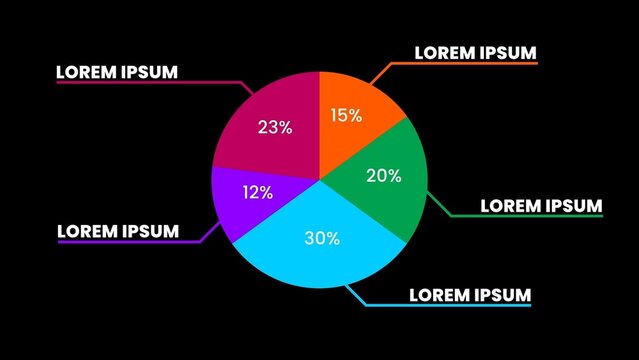
Pie Chart Infographic Layout with Droplet Pointers
Infographics Pie Chart With Animated Values
Infographic Pie Chart Animation Template


Animated Infographics Pie Chart Percentage

Infographic Pie Chart Animation Template
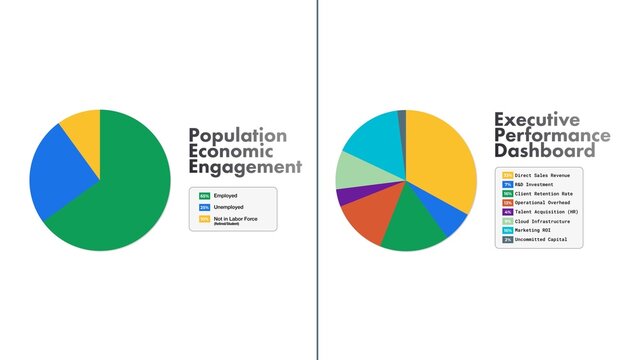
Pie Chart Analytics Dashboard
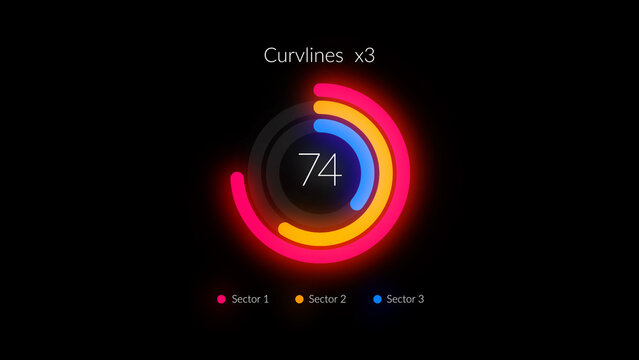
HUD Neon Infographics Curve Lines x3
Pie Chart Infographic Template in Modern Minimal Style
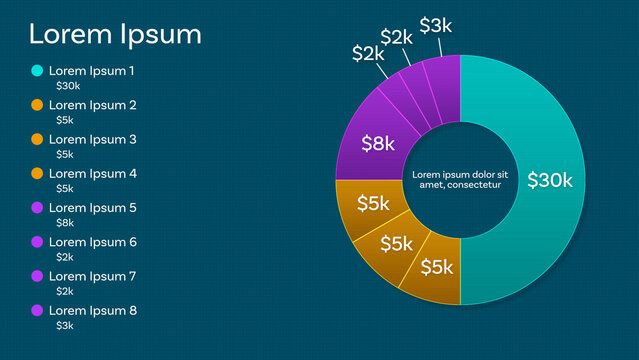
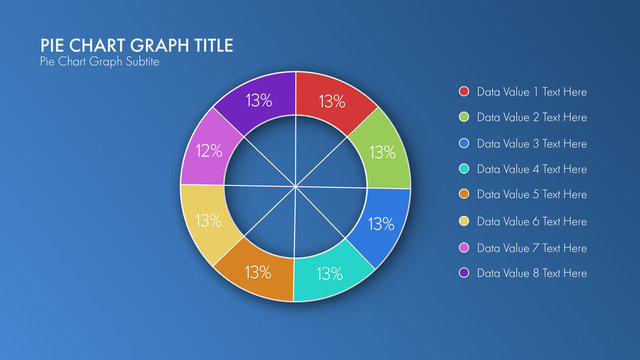
Responsive Pie Chart Mogrt for Clean and Modern Data Visualizations Design and Slide Presentation up to 8 Animated Data Points and Custom Text and Color with Percent Value Display Option and Paragraph
Simple Pie Infographic