Un lien pour définir votre mot de passe a été envoyé à : Pour accéder à vos achats à l’avenir, vous aurez besoin d’un mot de passe.
Obtenez 10 images Stock avec un essai gratuit
Nouveaux filtres ajoutés
Trier par

34 706 résultats pour physics chart dans tout

3 131 résultats dans les vidéos
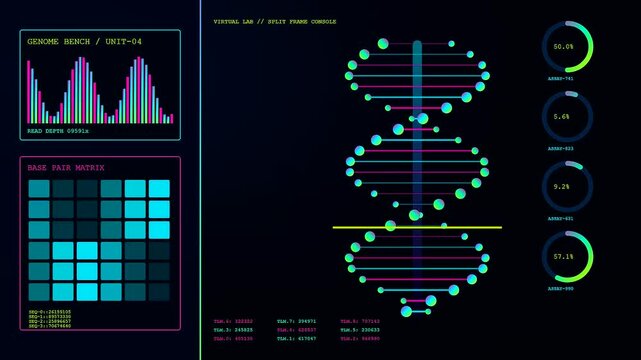
Digital displays in a virtual lab showing glowing dna helix structures with oscillating wave patterns and circle charts floating in dark environment with vibrant neon light
00:06
HD
Industrial carbon capture digital interface display showing fluid liquefaction vessel pressure monitoring with data charts and graphs in a dark laboratory setting for scientific observation
00:06
HD
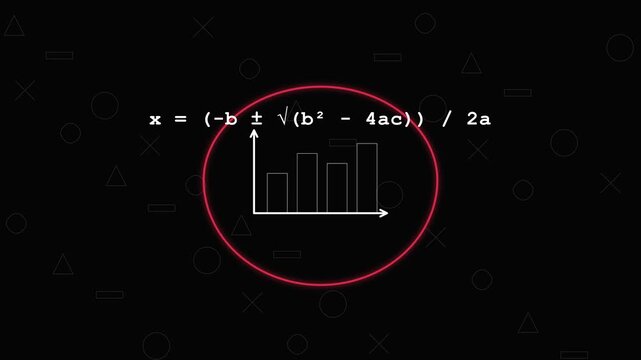
Animated math formulas and charts in 4K stock footage
00:15
HD
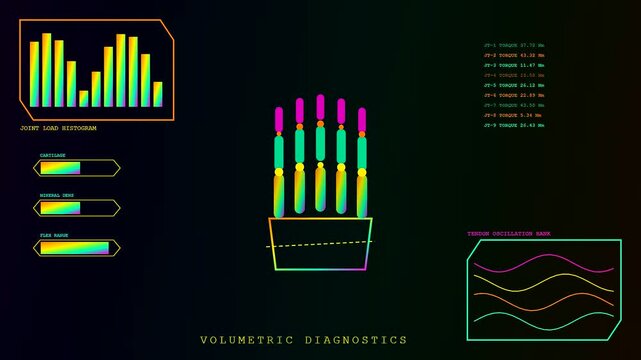
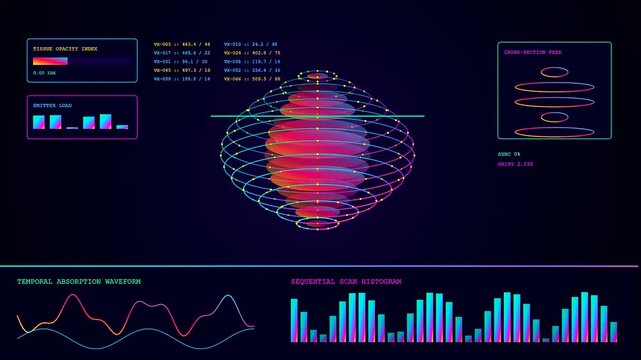
Digital volumetric diagnostics display featuring abstract skeletal hand anatomy charts with glowing bar graphs and oscillating wave patterns rendered in a neon dark medical interface style
00:06
HD
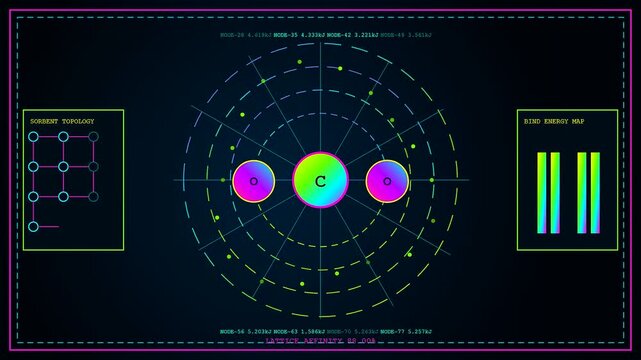
Carbon capture visualization showing digital molecular structures with orbiting glowing atoms and scientific data charts on a screen for advanced atmospheric research and chemical engineering analysis
00:06
HD
a virtual lab interface displays rotating atomic particle structures with neon glowing orbital rings and fluctuating data charts presented against a dark vibrant gradient digital field
00:06
HD
A digital broadcast switcher monitoring interface displays evolving signal flow patterns across triple panel screens featuring glowing neon lines and colorful bar charts for complex network control
00:06
HD
Explore a sleek dark analytics dashboard showcasing relevance scores for document chunks with animated bubble charts and dynamic visualizations in 4K resolution.
00:15
HD
Futuristic UI HUD dashboard with levitation control and data charts
00:30
HD
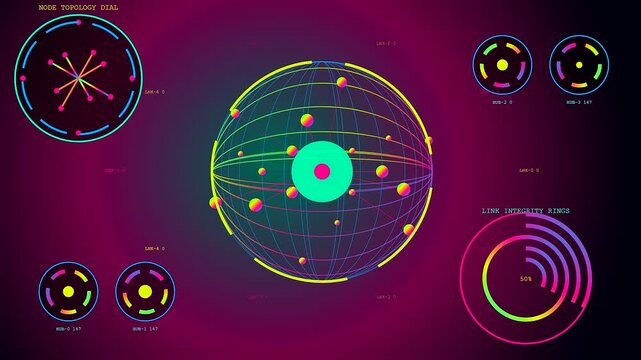
Volumetric diagnostics display floating rotating spheres surrounded by glowing data rings and circular charts on a vibrant gradient purple canvas showing orbital movement in space
00:06
HD
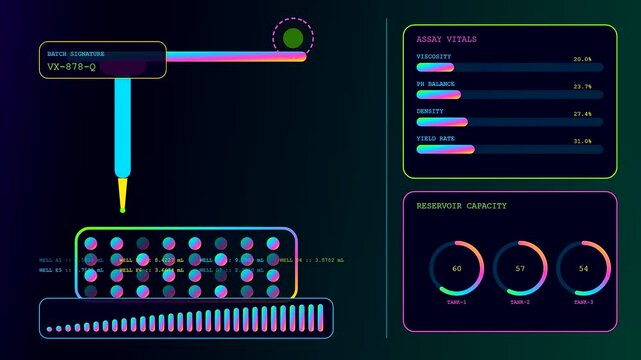
A digital virtual lab interface displays fluid chemical analysis process on a dark screen with vibrant neon bar charts and circular data panels in motion
00:06
HD
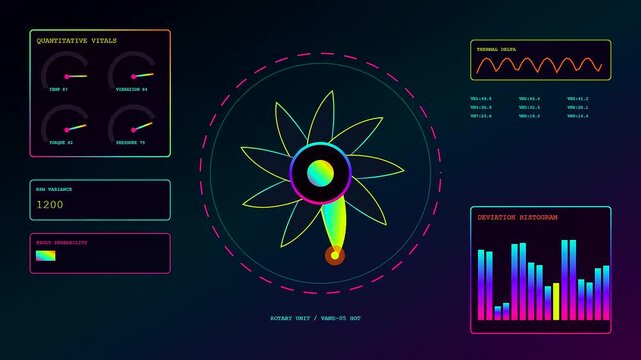
Data streaming of anomaly detection visual diagnostics displaying rotary unit performance metrics with fluctuating signal wave charts and colorful rotating floral patterns on a dark screen
00:06
HD
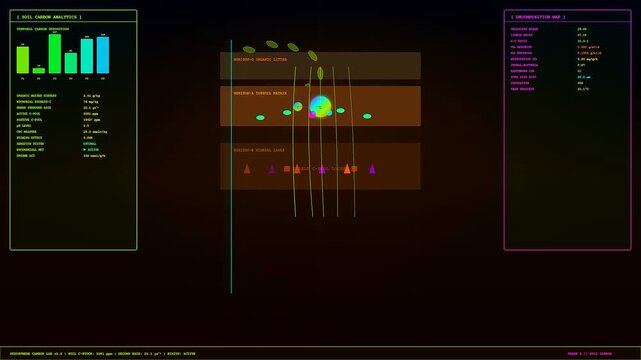
Digital displays showing carbon sequestration data with glowing charts and soil composition graphics for ecological monitoring and climate research studies in a dark laboratory setting
00:06
HD
Multi-color column bar chart analytics loop
00:10
HD
Volumetric diagnostics display flickering on screen showing glowing neon spheres with oscillating waveforms and rhythmic bar charts animating in a continuous loop for medical data visualization
00:06
HD
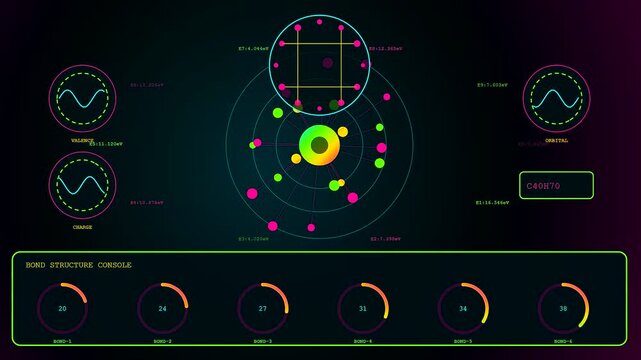
a virtual lab interface displays complex molecular bonding cycles and data visualizations with glowing circular nodes on a dark digital monitor for scientific research analysis
00:06
HD
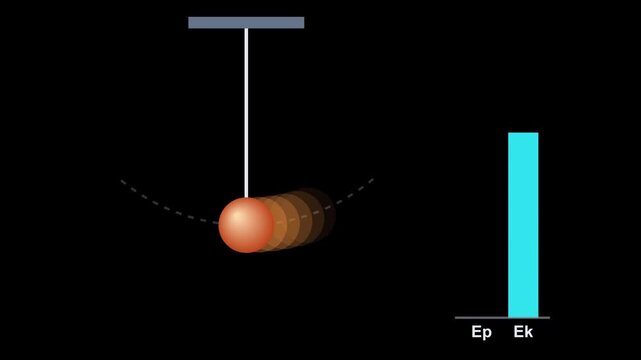
Pendulum movement illustration demonstrating energy conversion between potential and kinetic states with a dynamic bar chart for physics education
00:08
HD
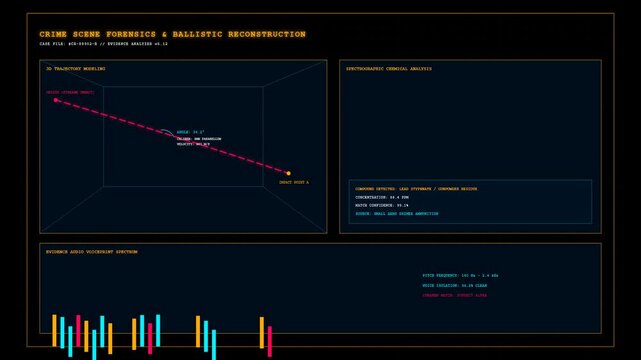
Digital Forensics Interface Showing Ballistic Trajectory Reconstruction and Analytical Data Analysis
00:10
HD
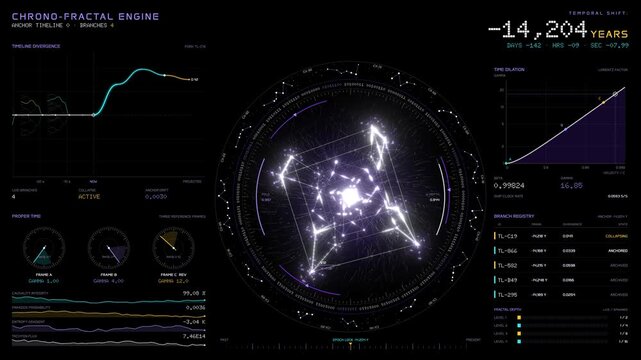
Sci fi time travel dashboard interface with timeline divergence charts
00:20
HD
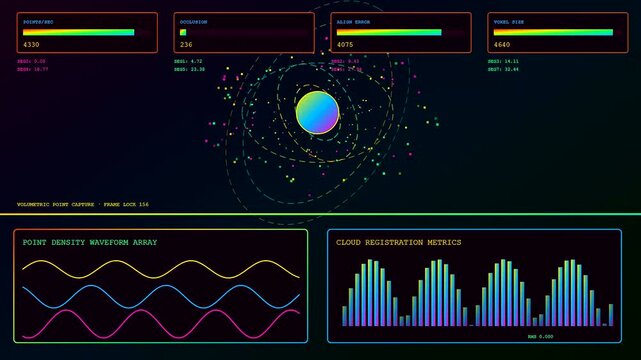
Volumetric diagnostics display showing shifting data particle clouds with glowing orbital paths and digital wave patterns pulsing across dark interfaces in a triple screen computer layout
00:06
HD
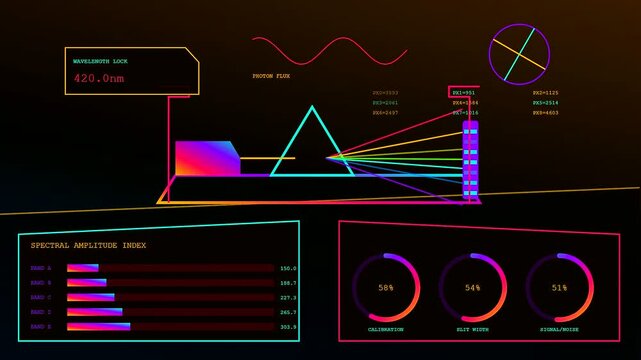
A digital virtual lab interface displays light refraction through a glowing prism with shifting spectral data metrics and circular monitoring charts in a dark room environment
00:06
HD
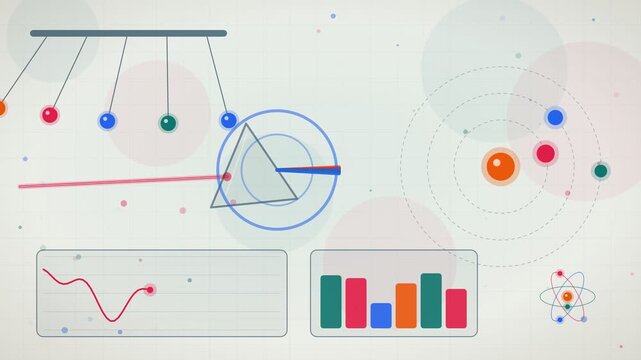
Educational Physics Infographics Animation Featuring Newton's Cradle, Prism Light Dispersion, and Scientific Data Charts on a Light Background
00:10
HD