Un lien pour définir votre mot de passe a été envoyé à : Pour accéder à vos achats à l’avenir, vous aurez besoin d’un mot de passe.
Obtenez 10 images Stock avec un essai gratuit
Nouveaux filtres ajoutés
Trier par

99 729 résultats pour interface statistic vector dans tout

4 582 résultats dans les vidéos
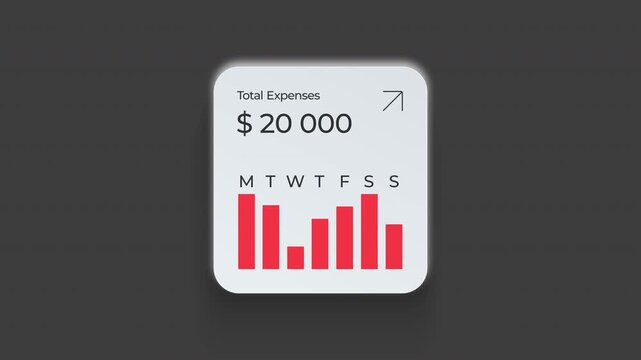
Expenses chart dashboard interface widget showing financial data vector motion graphic
00:13
HD
Dashboard interface with analytics charts and data visualization metrics on a dark background
00:10
HD
Circular Progress Bar Graphic Featuring Twenty Five Percent Completion Indicator for User Interface
00:08
HD
Digital dashboard interface with animated data visualization charts and energy monitoring metrics
00:10
HD
Modern abstract bar chart interface on dark blue background
00:12
HD
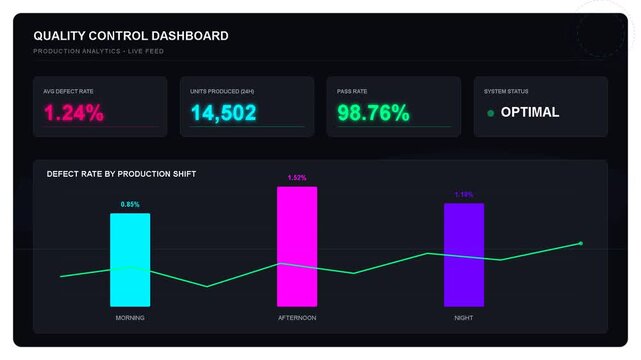
Digital data dashboard interface with neon bar charts and line graphs showing performance metrics and statistical progress analysis
00:08
HD
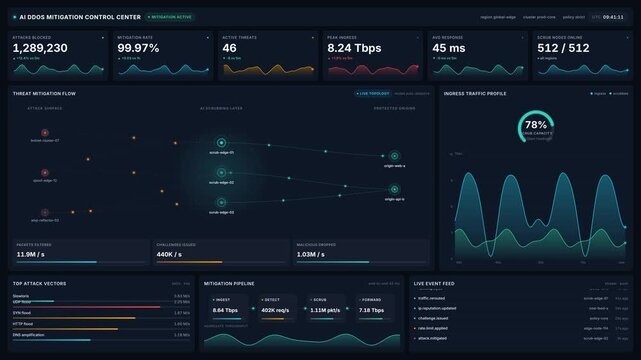
Advanced ai ddos mitigation control center dashboard for live threat neutralization, traffic graphs, attack vectors, for cybersecurity, network monitoring, system protection
00:20
HD
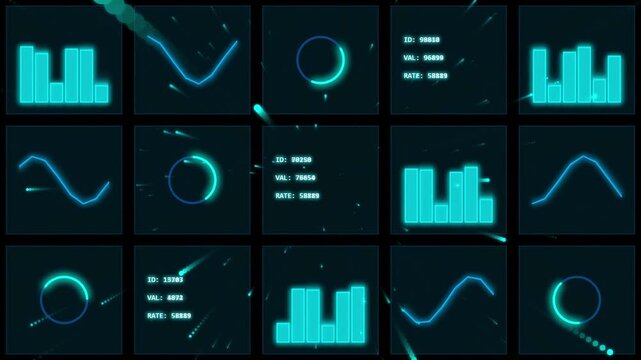
Set of glowing blue neon data charts and digital info graphs with futuristic interface elements
00:10
HD
Digital fundraising goal progress circle with amount displayed
00:12
HD
Digital dashboard interface windows floating on green screen
00:10
HD
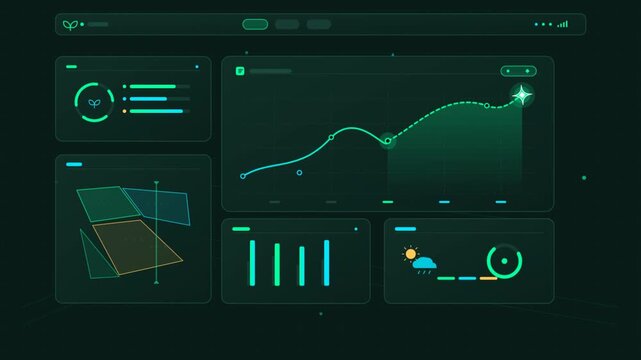
Futuristic digital dashboard interface displaying green vector charts
00:10
HD
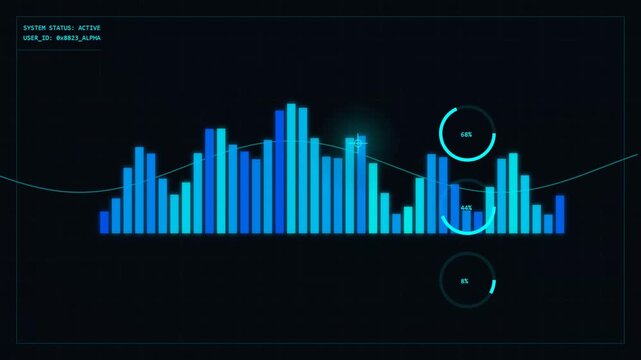
Futuristic digital data graph with blue bars and glowing elements HUD interface
00:05
HD
Modern UI vector animation displaying dashboard analytics interface with interactive charts and search magnifying glass graphic
00:11
HD
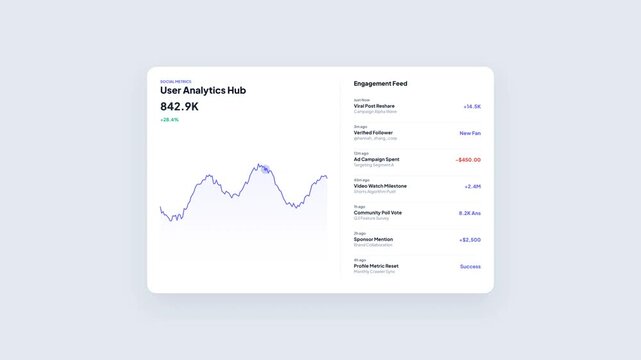
User Analytics Hub Marketing Social Performance Dashboard with Moving Line Graph Trend and Engagement Feed Activity Stream Notification Animation
00:08
HD
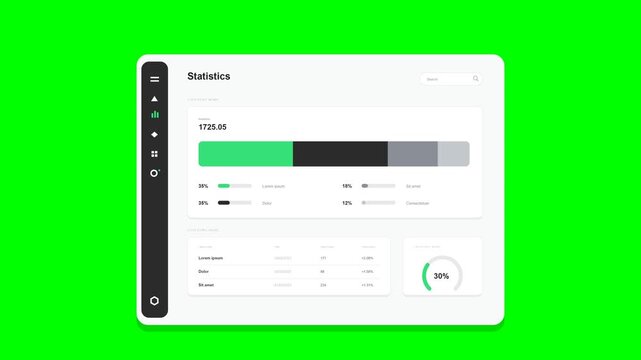
Flat vector statistics dashboard UI faithfully matching the reference on solid chroma green background: white rounded panel with soft shadow; dark charcoal sidebar pill with hamburger, triangle, green
00:12
HD
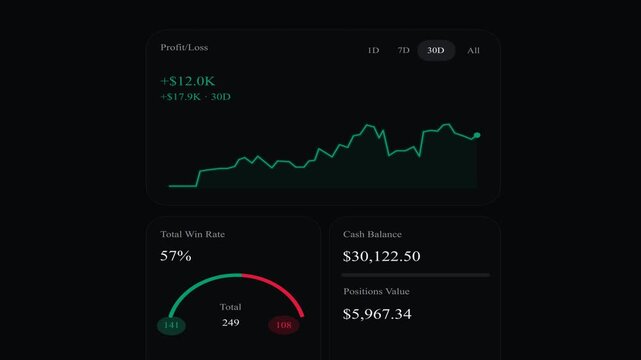
An app interface for tracking statistics and analytics for bets or predictions, as well as portfolio trackers. Animation without a background, with an alpha channel
00:10
HD
futuristic ai automation dashboard interface with data analytics charts and progress indicators in red
00:09
HD
A digital collaboration invite expands as network nodes emerge from a central profile icon on a dark monitor display with changing analytical data panels below
00:06
HD
Digital data flow and data transfer animation with ui interface nodes
00:06
HD
Futuristic HUD interface animation with morphing data charts and vector panels
00:10
HD
Animated infographics displaying dynamic financial analytics charts and statistics in vector motion footage loop
00:11
HD
Clean animation of loading progress bar and pie chart
00:15
HD
Video percentage progress bar set for ui data visualization
00:15
HD
dynamic data visualization interface featuring bar charts and interactive infographics for business intelligence analysis, dashboard monitoring, reporting, financial metrics, performance tracking
00:09
HD
Percentage shows sixty six percent inside a circular progress ring graphic accompanied by a green upward arrow indicating positive performance growth rate.
00:10
HD
Data analytics dashboard panels on chroma key green background
00:12
HD
Dynamic 2d vector user interface dashboard with tactical hud elements and morphing charts
00:10
HD
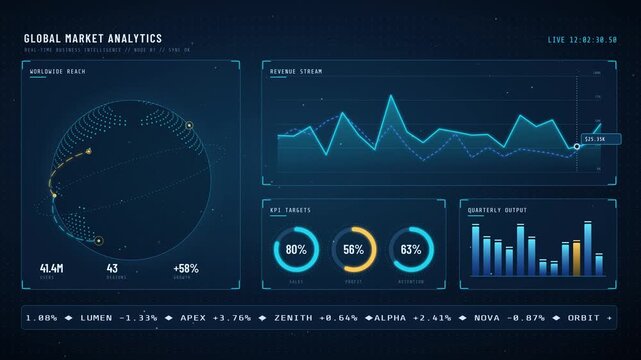
Global market analytics dashboard with digital globe
00:10
HD