Un lien pour définir votre mot de passe a été envoyé à : Pour accéder à vos achats à l’avenir, vous aurez besoin d’un mot de passe.
Essai gratuit : obtenez 10 images Stock, plus des outils d’édition par IA.
Nouveaux filtres ajoutés
Trier par

1 102 508 résultats pour graph bar dans tout

Voir graph bar dans les vidéos (30409)
aet 
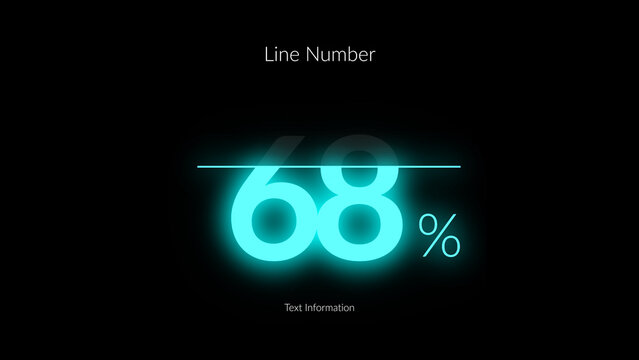
HUD Neon Infographics Line Number x1
aet 
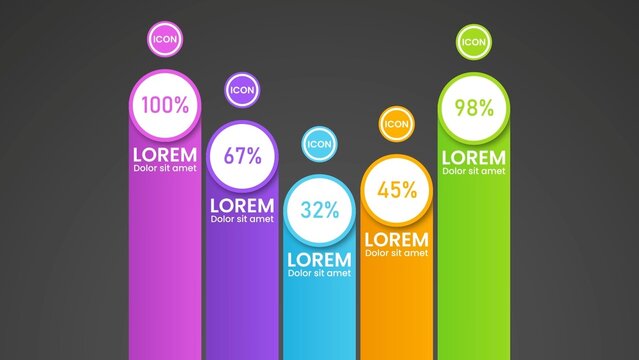
Infographic Data Visualiser Bright Colors
Blue Bar Chart with an Upward Arrow Indicating Growth and Success on a Dark Blue Background graph
00:05
Abstract digital bar graph representing data analysis and financial growth in a futuristic technological landscape.
00:05
aet 
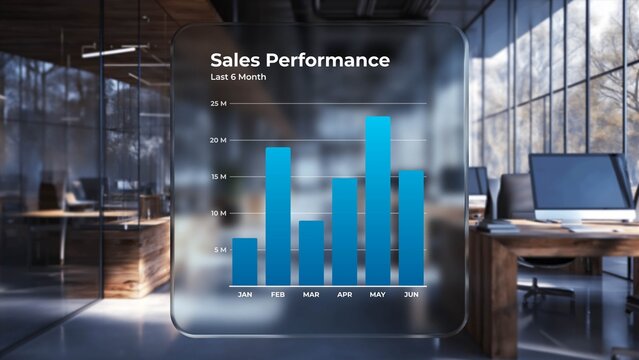
Glassmorphism Sales Performance Dashboard
Dynamic 4k animation of financial stock market growth with upward trending bar graph and line chart over a grid background.
00:28
aet 
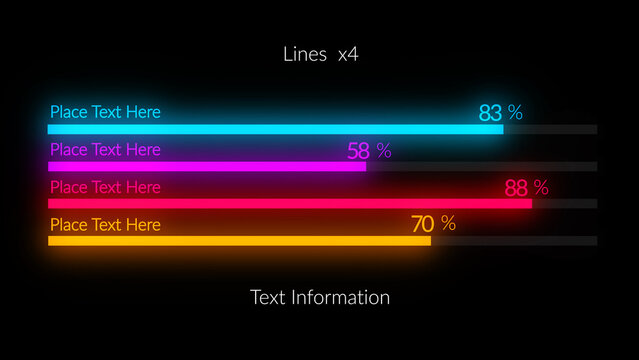
HUD Neon Infographics Lines x4
aet 
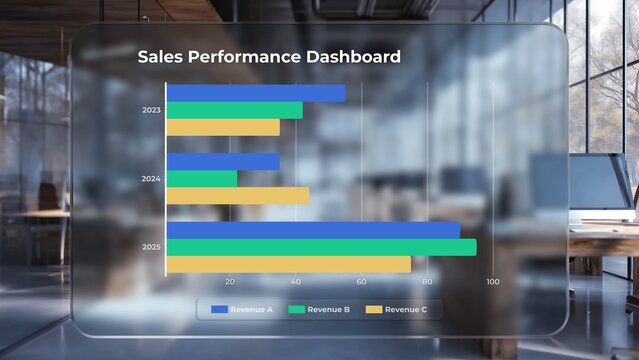
Glass UI Business Analytics Chart
mogrt 
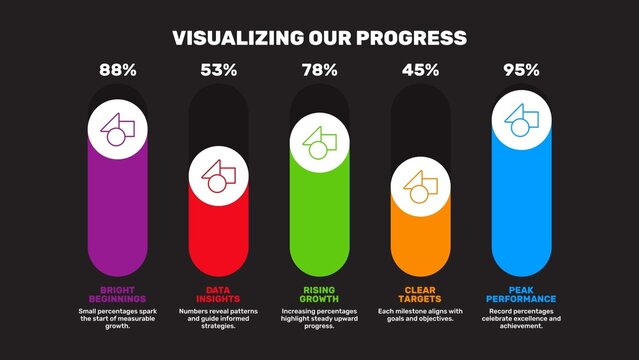
Bar Slider Professional Performance Tracker Infographic
Businessman interacting with a glowing turquoise digital bar graph on a tablet screen finance
00:10
Animated monthly data visualization bar and line chart with pink downward arrow over the year. Showing a decreasing trend in business performance for financial loss and analysis visuals
00:10
aet 
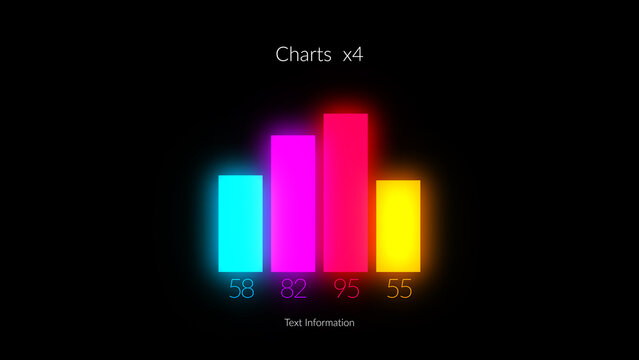
HUD Neon Infographics Chart Bars x4
Dynamic financial data visualization with glowing bar graphs in motion, captured through a smooth camera pan in a futuristic, cinematic style; perfect for technology and finance themes.
00:10
Business bar chart and line graph showing yearly business growth from 2022 to new year 2026, represent data analytics, future 2026 planning, business 2026 trend, and performance analysis 2026 Marrow
00:10
3D bar graph with an upward trending arrow indicating financial growth and success business finance
00:05
Dynamic animation of a bar graph with an orange arrow indicating increasing financial success and market growth. This visual represents positive business trends and economic improvement.
00:08
aet 
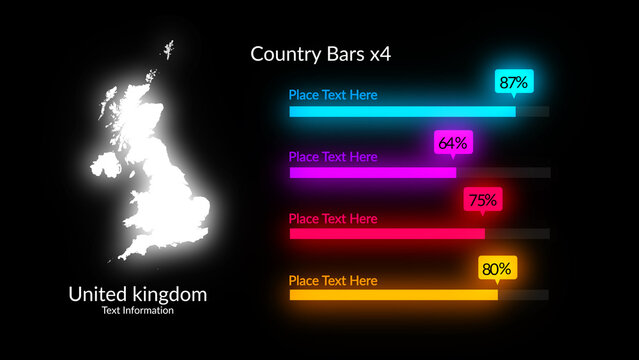
HUD Neon Maps Country Bars x4 (210 Flags, 195 World Countries Maps Included)
mogrt 
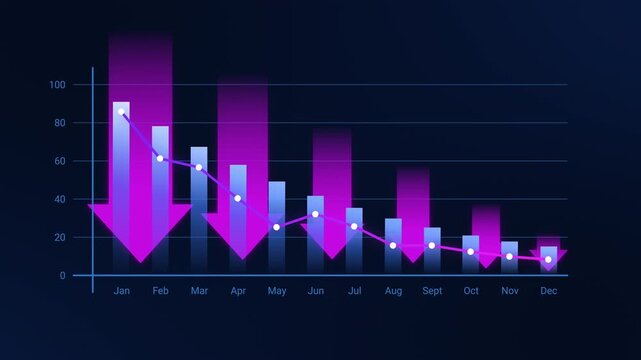
Gradient Graphic Bar Value Comparison Infographic
ait Histogram Infographic Vector – Data Distribution Chart, Frequency Bar Graph Template for Statistics, Analytics, and Reports